| Param | Original file | Final file |
|---|---|---|
| Filename | modeM0/AS1G05_246T01_9000000450_03342cztM0_level2.evt | modeM0/AS1G05_246T01_9000000450_03342cztM0_level2_quad_clean.evt |
| Size (bytes) | 556,119,360 | 89,029,440 |
| Size | 530.4 MB | 84.9 MB |
| Events in quadrant A | 3,347,922 | 549,130 |
| Events in quadrant B | 4,332,019 | 561,454 |
| Events in quadrant C | 5,434,310 | 557,044 |
| Events in quadrant D | 3,250,047 | 537,391 |
| Mode M0 | |||
|---|---|---|---|
| Quadrant | BADHDUFLAG | Total packets | Discarded packets |
| A | 0 | 14657 | 3 |
| B | 0 | 17616 | 2 |
| C | 0 | 21020 | 2 |
| D | 0 | 14625 | 2 |
| Mode SS | |||
|---|---|---|---|
| Quadrant | BADHDUFLAG | Total packets | Discarded packets |
| A | 0 | 146 | 0 |
| B | 0 | 146 | 0 |
| C | 0 | 146 | 0 |
| D | 0 | 146 | 0 |
| Mode M9 | |||
|---|---|---|---|
| Quadrant | BADHDUFLAG | Total packets | Discarded packets |
| A | 0 | 23 | 0 |
| B | 0 | 23 | 0 |
| C | 0 | 23 | 0 |
| D | 0 | 23 | 0 |
| Quadrant | Total seconds | Saturated seconds | Saturation percentage |
|---|---|---|---|
| A | 7047 | 40 | 0.567617% |
| B | 7047 | 130 | 1.844757% |
| C | 7047 | 188 | 2.667802% |
| D | 7047 | 22 | 0.312190% |
Noise dominated data is calculated using 1-second bins in cleaned event files. If a bin has >2000 counts, and if more than 50% of those come from <1% of pixels, then it is considered to be noise-dominated and hence unusable.
| Quadrant | # 1 sec bins | Bins with >0 counts | Bins with >2000 counts | High rate bins dominated by noise | Noise dominated (total time) | Noise dominated (detector-on time) | Marked lightcurve |
|---|---|---|---|---|---|---|---|
| A | 9432 | 7049 | 1 | 1 | 0.01% | 0.01% | 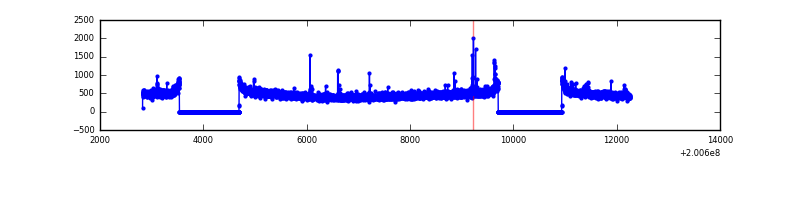 |
| B | 9432 | 7049 | 44 | 44 | 0.47% | 0.62% | 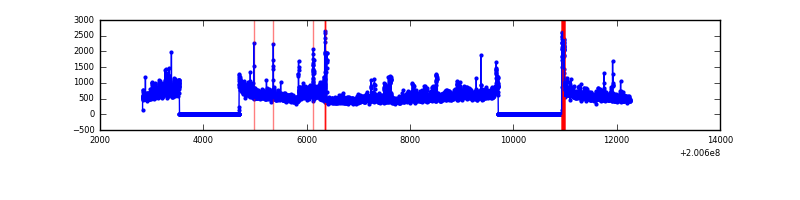 |
| C | 9432 | 7049 | 127 | 127 | 1.35% | 1.80% | 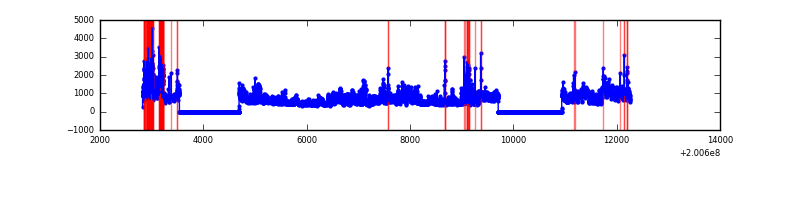 |
| D | 9432 | 7049 | 7 | 7 | 0.07% | 0.10% | 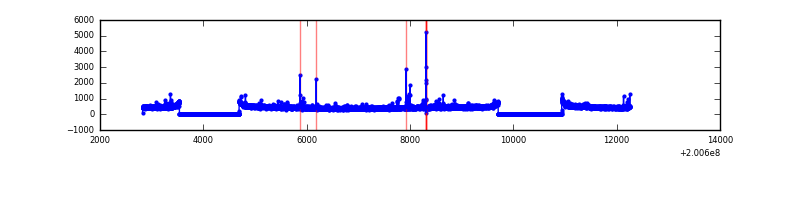 |
Top three noisy pixels from each quadrant. If the there are fewer than three noisy pixels in the level2.evt file, extra rows are filled as -1
| Pixel properties | Quadrant properties | ||||||
|---|---|---|---|---|---|---|---|
| Quadrant | DetID | PixID | Counts | Sigma | Mean | Median | Sigma |
| A | 14 | 249 | 20831 | 114.06 | 850 | 830 | 175.4 |
| A | 8 | 15 | 20406 | 111.63 | 850 | 830 | 175.4 |
| A | 0 | 118 | 18087 | 98.41 | 850 | 830 | 175.4 |
| B | 15 | 204 | 455684 | 2721.6 | 866 | 846 | 167.1 |
| B | 3 | 0 | 281958 | 1682.08 | 866 | 846 | 167.1 |
| B | 6 | 203 | 79498 | 470.63 | 866 | 846 | 167.1 |
| C | 8 | 208 | 1398589 | 7184.6 | 833 | 840 | 194.5 |
| C | 14 | 223 | 610720 | 3134.86 | 833 | 840 | 194.5 |
| C | 1 | 192 | 60538 | 306.85 | 833 | 840 | 194.5 |
| D | 2 | 206 | 34749 | 167.39 | 832 | 810 | 202.8 |
| D | 8 | 195 | 33666 | 162.05 | 832 | 810 | 202.8 |
| D | 5 | 233 | 16817 | 78.95 | 832 | 810 | 202.8 |
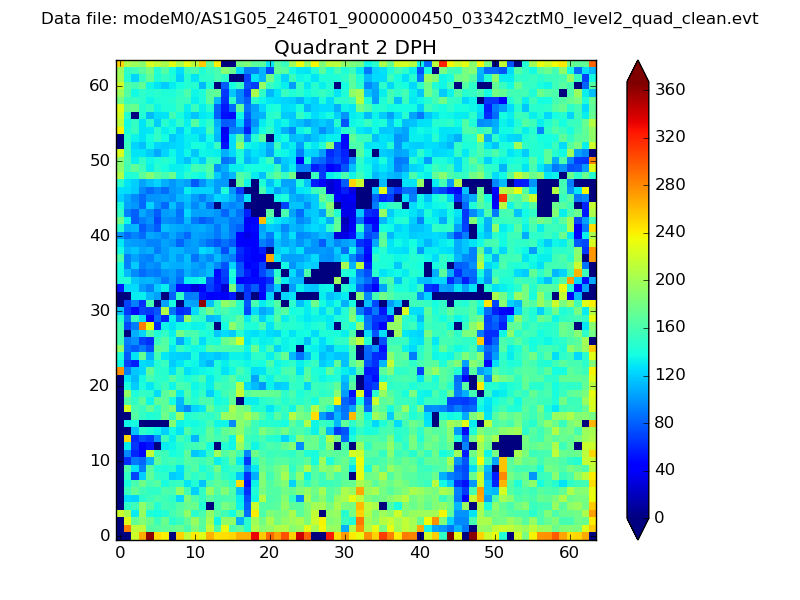
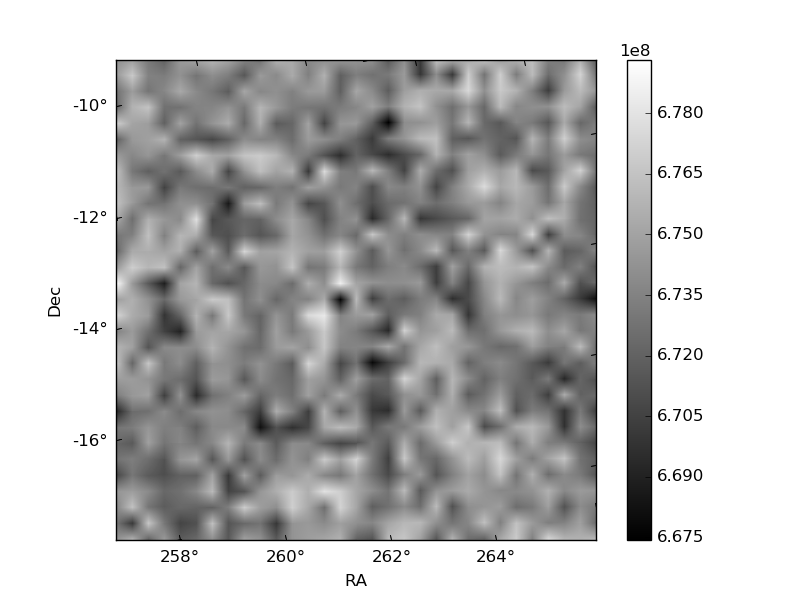
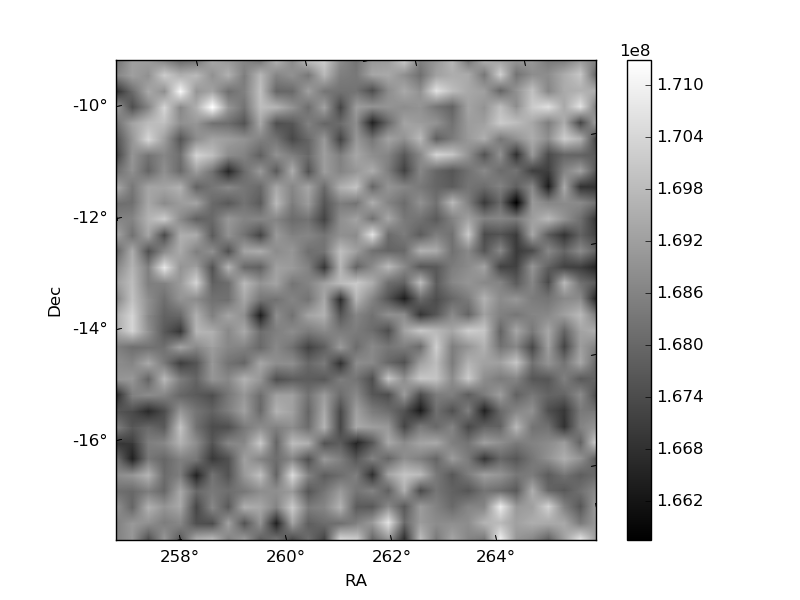
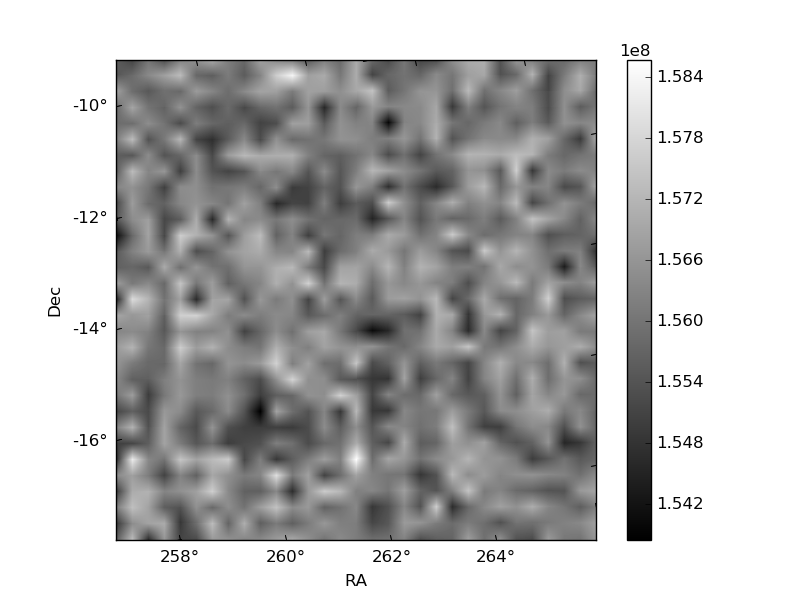
Histogram calculated using DETX and DETY for each event in the final _common_clean file
| Quadrant A | 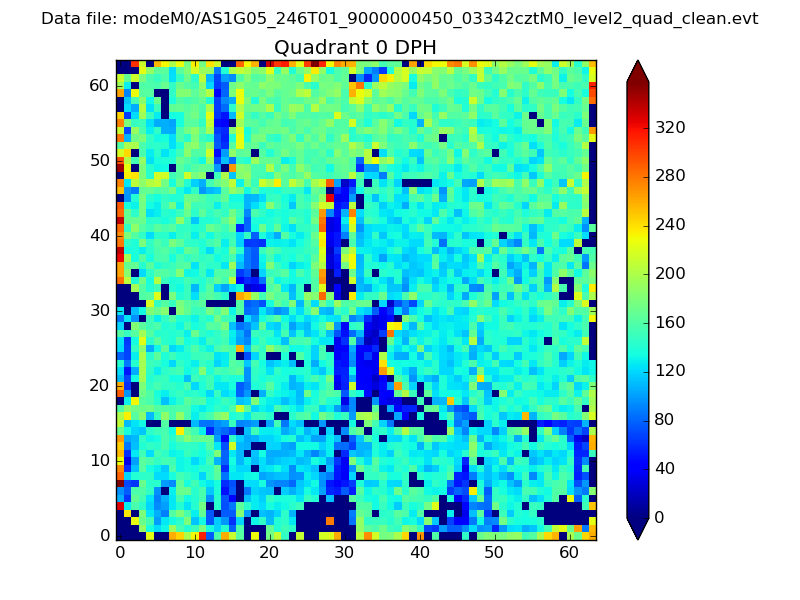 |
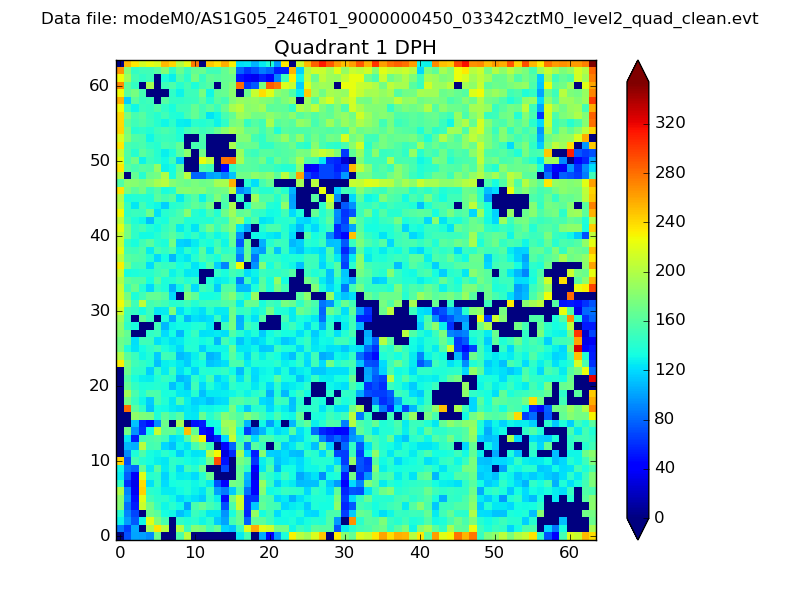 |
Quadrant B |
|---|---|---|---|
| Quadrant D | 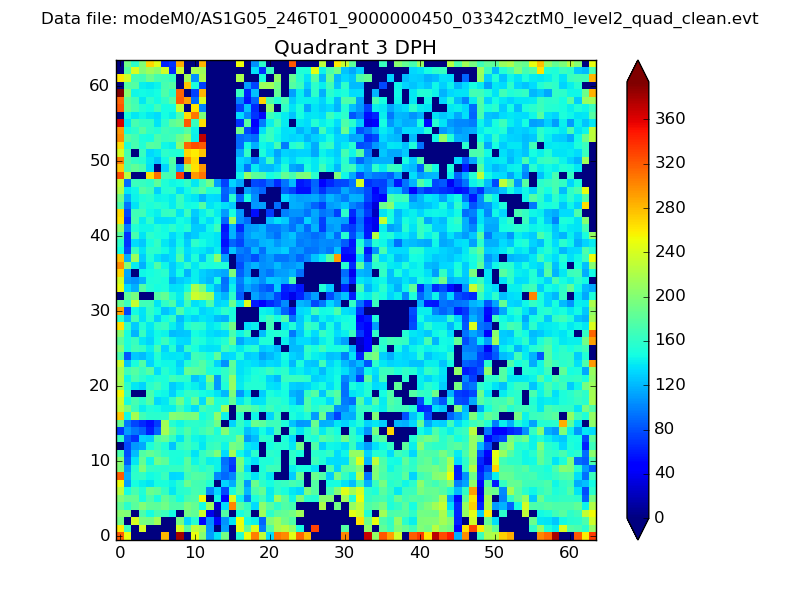 |
 |
Quadrant C |
| Plot type | Count rate plots | Images |
|---|---|---|
| Comparison with Poisson distribution Blue bars denote a histogram of data divided into 1 sec bins. Red curve is a Poisson curve with rate = median count rate of data. |
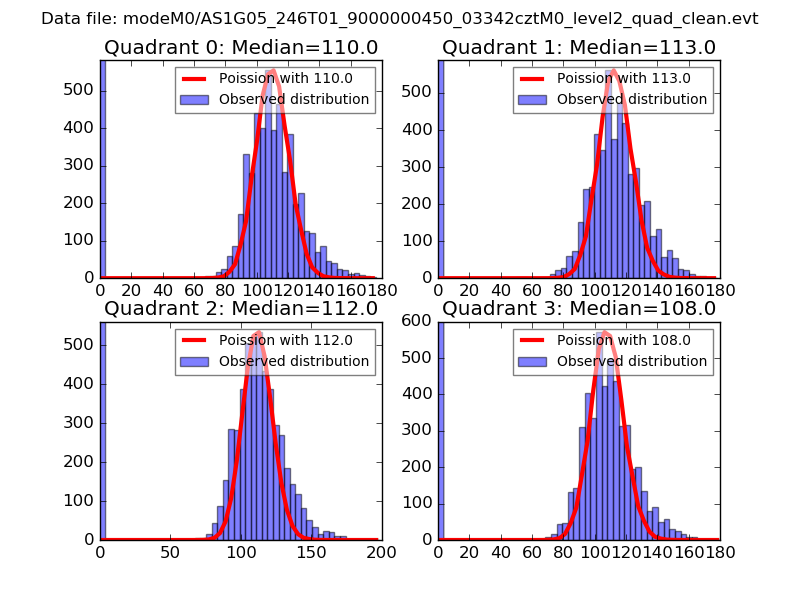 |
 |
| Quadrant-wise count rates Data is divided into 100 sec bins |
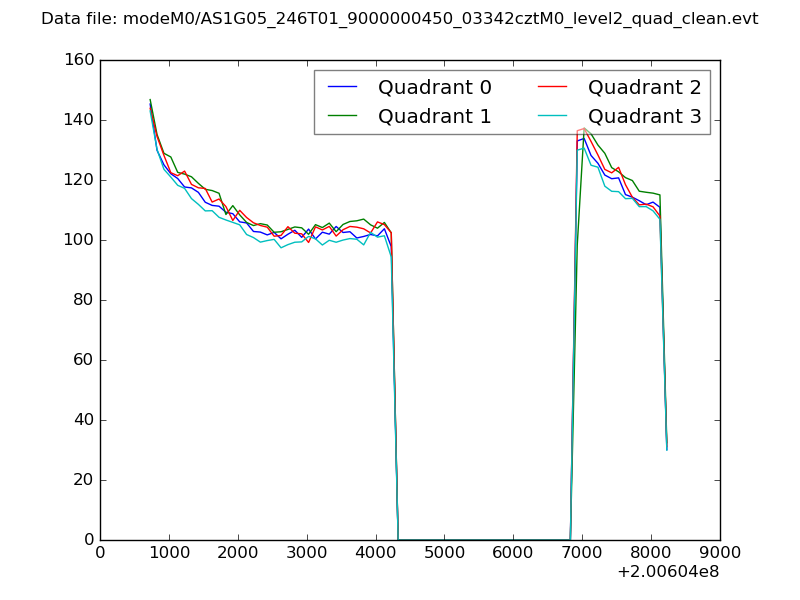 |
|
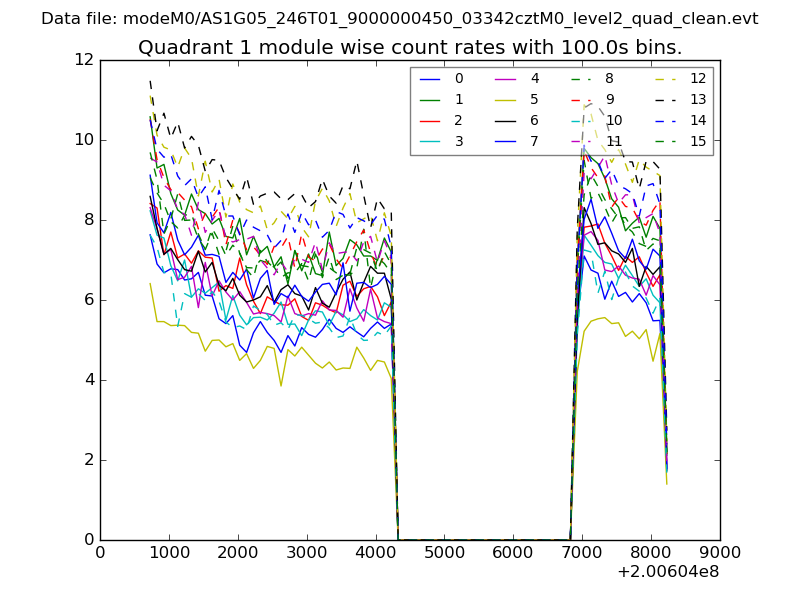
| Module-wise count rates for Quadrant A Data is divided into 100 sec bins |
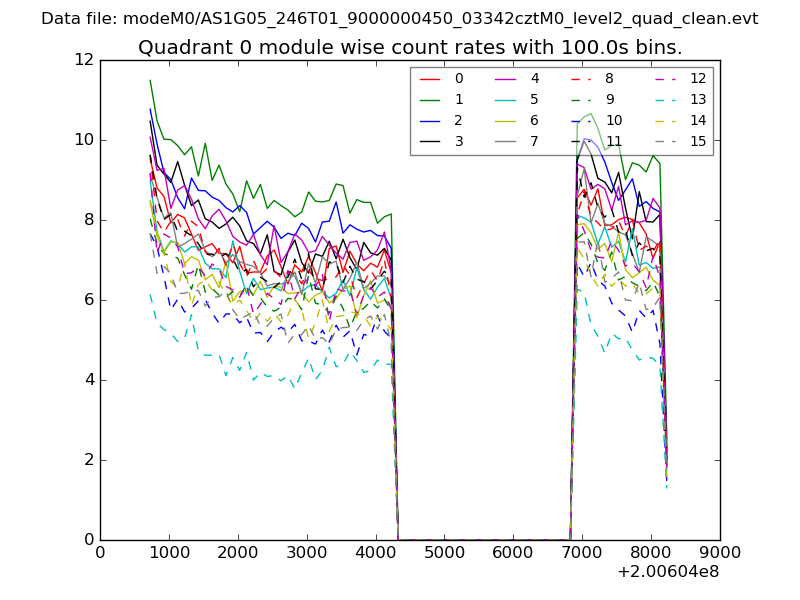 |
 |
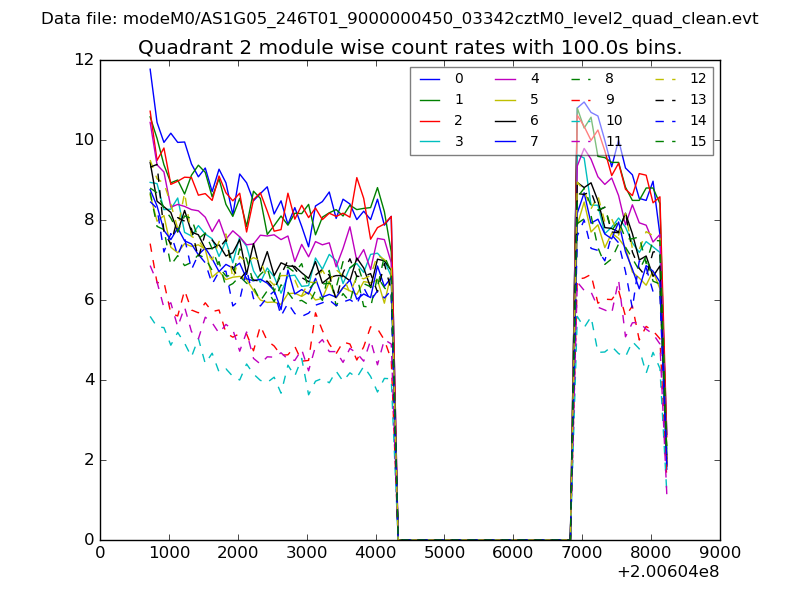
| Module-wise count rates for Quadrant B Data is divided into 100 sec bins |
 |
 |
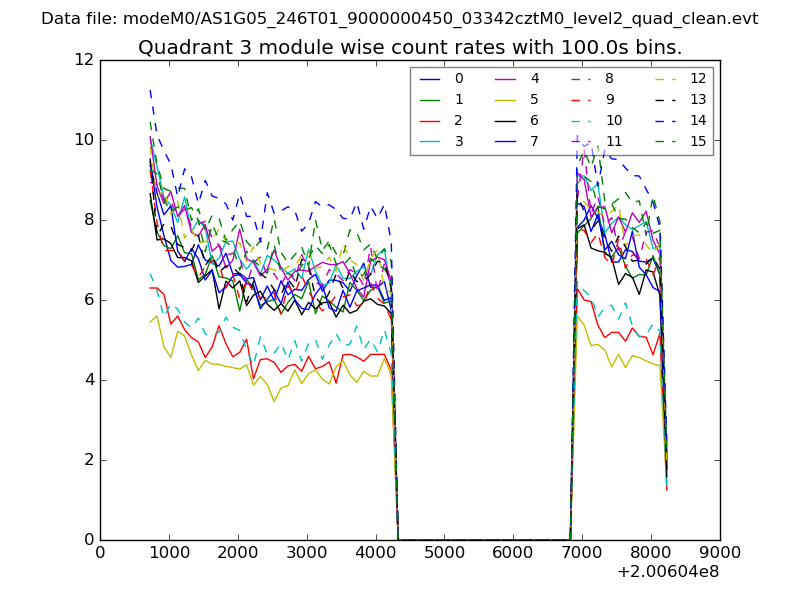
| Module-wise count rates for Quadrant C Data is divided into 100 sec bins |
 |
 |
| Module-wise count rates for Quadrant D Data is divided into 100 sec bins |
 |
 |
| Parameter | Plot |
|---|---|
| CZT HV Monitor | 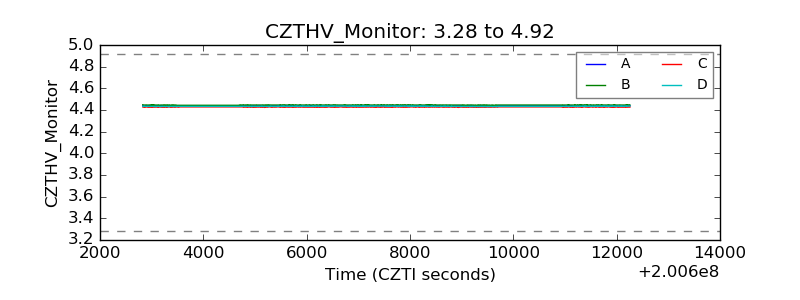 |
| D_VDD |  |
| Temperature 1 | 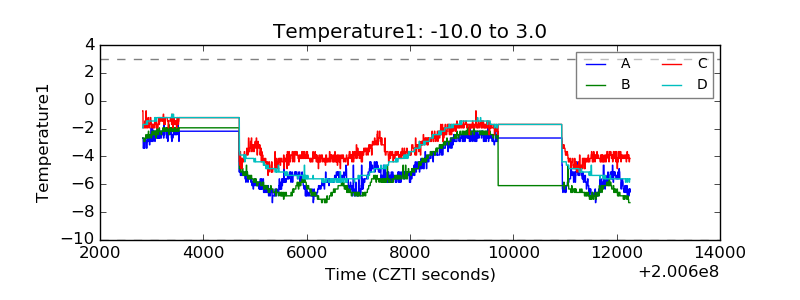 |
| Veto HV Monitor | 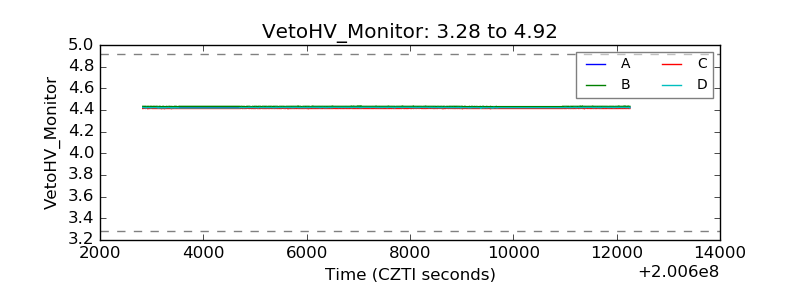 |
| Veto LLD | 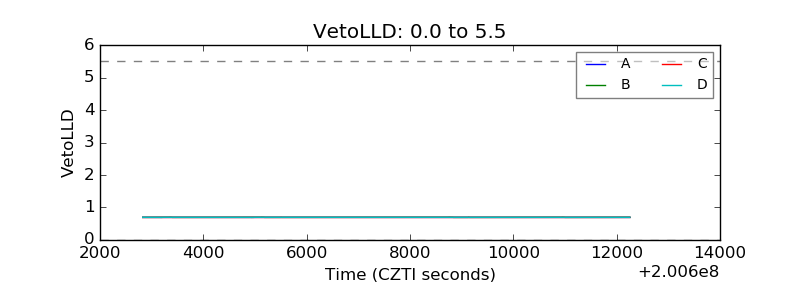 |
| Alpha Counter | 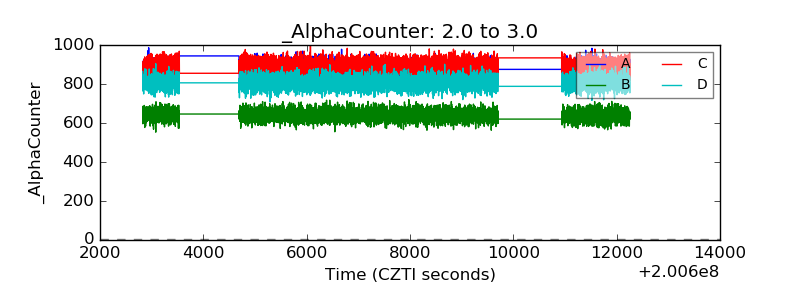 |
| _CPM_Rate | 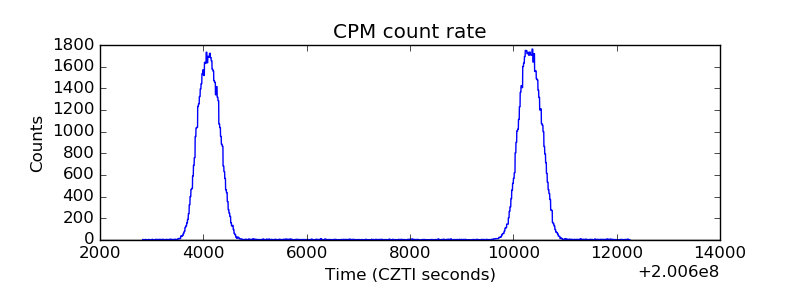 |
| CZT Counter | 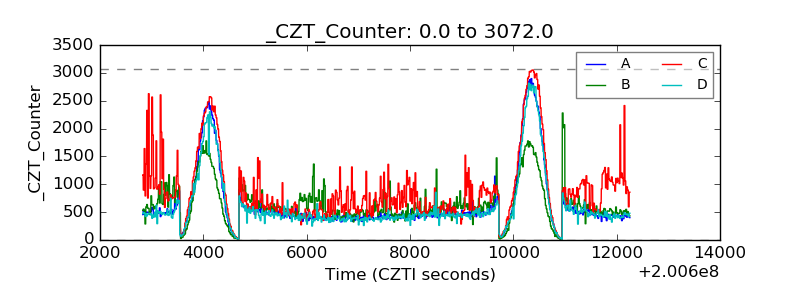 |
| +2.5 Volts monitor |  |
| +5 Volts monitor |  |
| _ROLL_ROT | 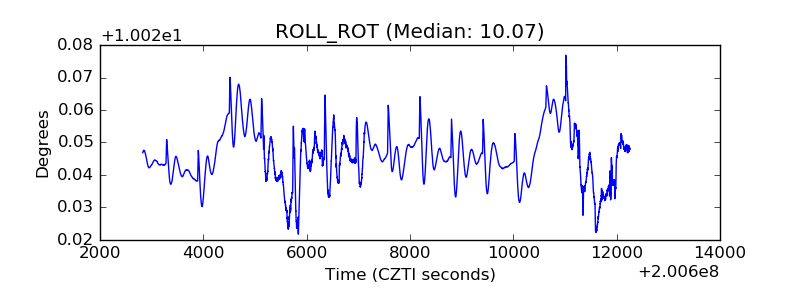 |
| _Roll_DEC | 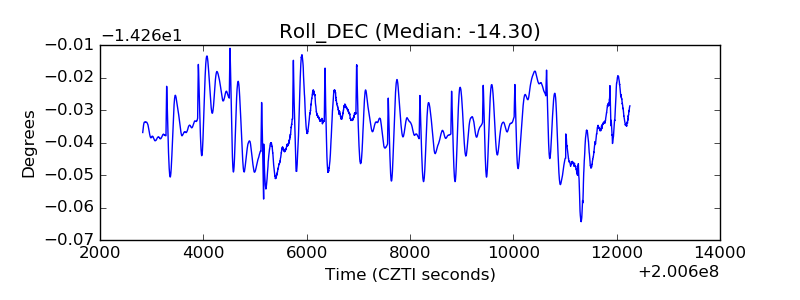 |
| _Roll_RA | 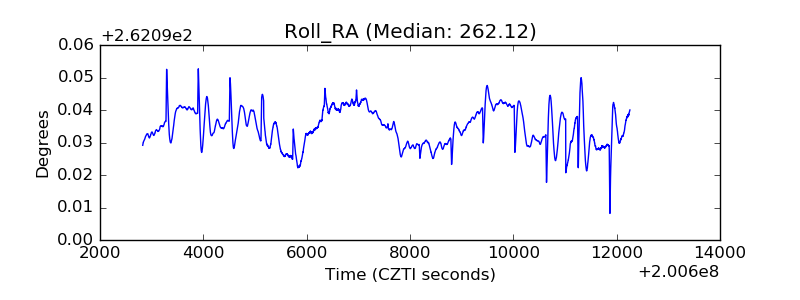 |
| Veto Counter | 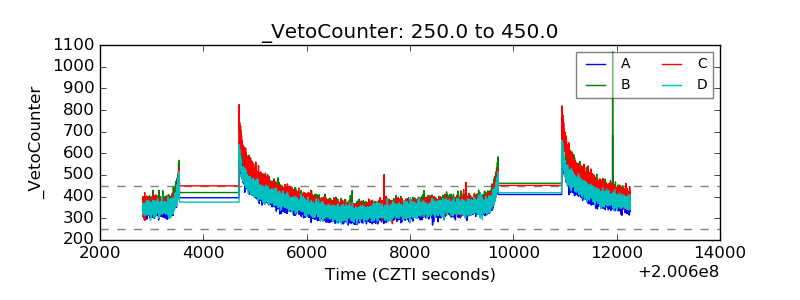 |