| Param | Original file | Final file |
|---|---|---|
| Filename | modeM0/AS1G05_246T01_9000000450_03343cztM0_level2.evt | modeM0/AS1G05_246T01_9000000450_03343cztM0_level2_quad_clean.evt |
| Size (bytes) | 524,177,280 | 80,256,960 |
| Size | 499.9 MB | 76.5 MB |
| Events in quadrant A | 2,929,932 | 499,659 |
| Events in quadrant B | 3,617,264 | 513,571 |
| Events in quadrant C | 6,056,887 | 497,943 |
| Events in quadrant D | 2,852,853 | 488,450 |
| Mode M0 | |||
|---|---|---|---|
| Quadrant | BADHDUFLAG | Total packets | Discarded packets |
| A | 0 | 12911 | 3 |
| B | 0 | 14724 | 2 |
| C | 0 | 22392 | 2 |
| D | 0 | 12765 | 2 |
| Mode SS | |||
|---|---|---|---|
| Quadrant | BADHDUFLAG | Total packets | Discarded packets |
| A | 0 | 124 | 0 |
| B | 0 | 124 | 0 |
| C | 0 | 124 | 0 |
| D | 0 | 124 | 0 |
| Mode M9 | |||
|---|---|---|---|
| Quadrant | BADHDUFLAG | Total packets | Discarded packets |
| A | 0 | 17 | 0 |
| B | 0 | 17 | 0 |
| C | 0 | 17 | 0 |
| D | 0 | 18 | 0 |
| Quadrant | Total seconds | Saturated seconds | Saturation percentage |
|---|---|---|---|
| A | 6174 | 17 | 0.275348% |
| B | 6174 | 94 | 1.522514% |
| C | 6174 | 258 | 4.178814% |
| D | 6174 | 16 | 0.259151% |
Noise dominated data is calculated using 1-second bins in cleaned event files. If a bin has >2000 counts, and if more than 50% of those come from <1% of pixels, then it is considered to be noise-dominated and hence unusable.
| Quadrant | # 1 sec bins | Bins with >0 counts | Bins with >2000 counts | High rate bins dominated by noise | Noise dominated (total time) | Noise dominated (detector-on time) | Marked lightcurve |
|---|---|---|---|---|---|---|---|
| A | 7459 | 6175 | 0 | 0 | 0.00% | 0.00% | 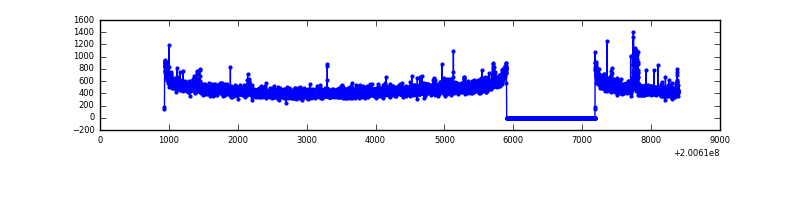 |
| B | 7459 | 6175 | 44 | 44 | 0.59% | 0.71% | 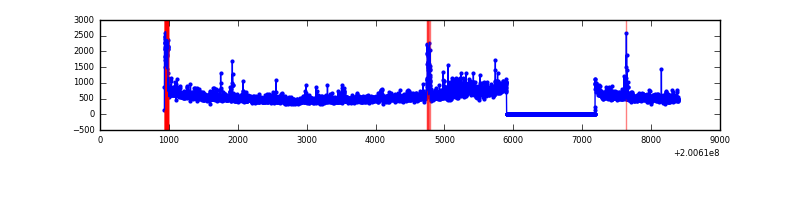 |
| C | 7459 | 6175 | 163 | 163 | 2.19% | 2.64% | 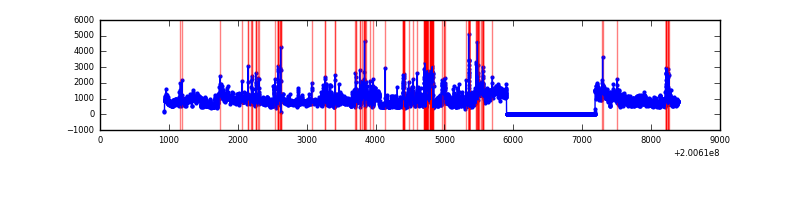 |
| D | 7459 | 6175 | 6 | 6 | 0.08% | 0.10% | 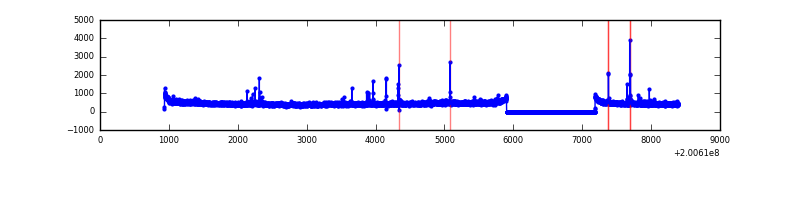 |
Top three noisy pixels from each quadrant. If the there are fewer than three noisy pixels in the level2.evt file, extra rows are filled as -1
| Pixel properties | Quadrant properties | ||||||
|---|---|---|---|---|---|---|---|
| Quadrant | DetID | PixID | Counts | Sigma | Mean | Median | Sigma |
| A | 0 | 118 | 38642 | 251.61 | 737 | 722 | 150.7 |
| A | 8 | 15 | 29677 | 192.13 | 737 | 722 | 150.7 |
| A | 0 | 226 | 11043 | 68.48 | 737 | 722 | 150.7 |
| B | 15 | 204 | 422106 | 2914.21 | 753 | 735 | 144.6 |
| B | 6 | 203 | 79289 | 543.28 | 753 | 735 | 144.6 |
| B | 0 | 229 | 71707 | 490.84 | 753 | 735 | 144.6 |
| C | 8 | 208 | 2011080 | 11932.98 | 720 | 727 | 168.5 |
| C | 14 | 223 | 644349 | 3820.39 | 720 | 727 | 168.5 |
| C | 14 | 48 | 393034 | 2328.64 | 720 | 727 | 168.5 |
| D | 8 | 195 | 60361 | 339.78 | 722 | 701 | 175.6 |
| D | 13 | 239 | 25837 | 143.16 | 722 | 701 | 175.6 |
| D | 2 | 206 | 10737 | 57.16 | 722 | 701 | 175.6 |
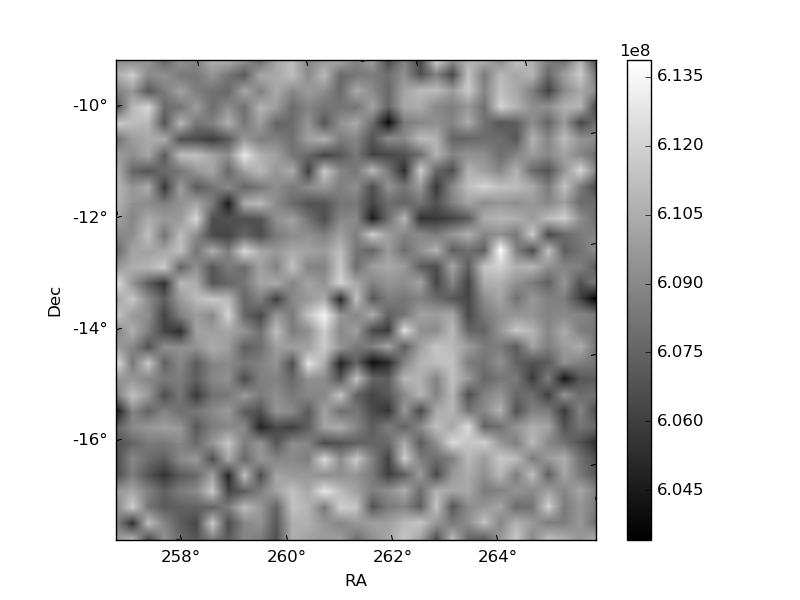
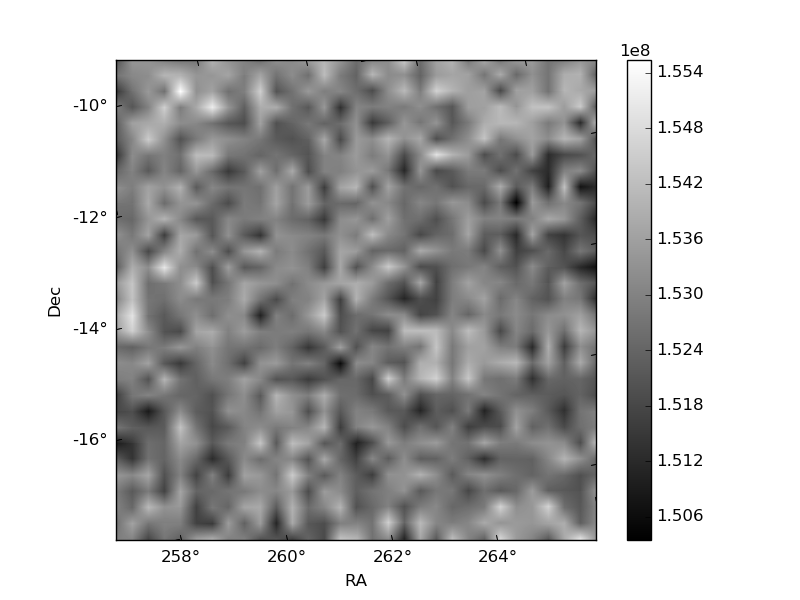
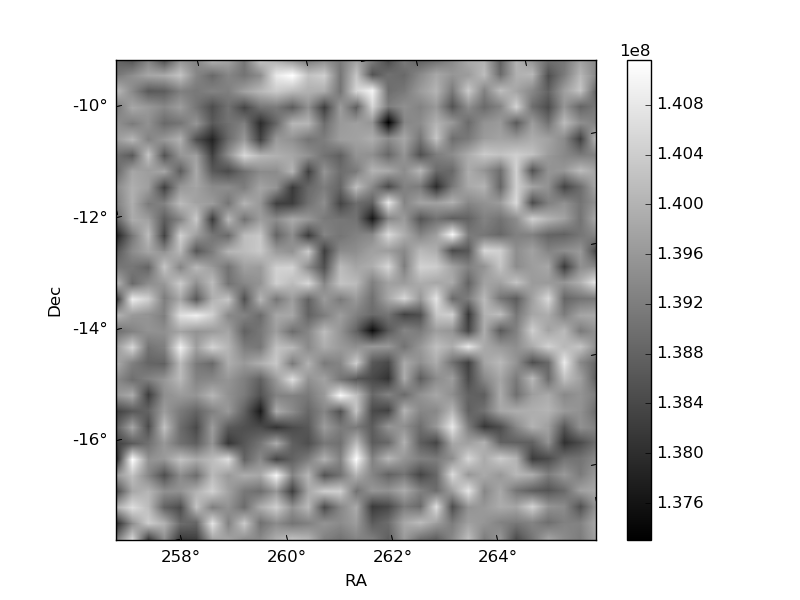
Histogram calculated using DETX and DETY for each event in the final _common_clean file
| Quadrant A | 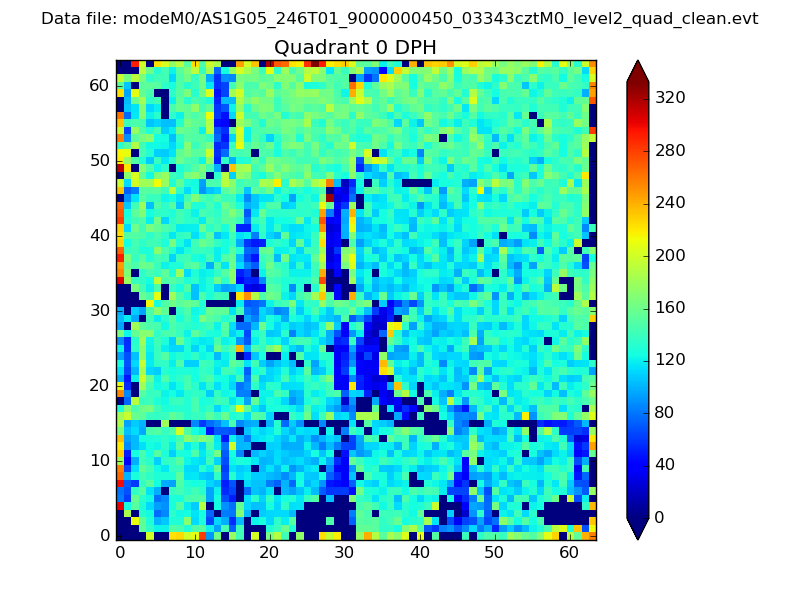 |
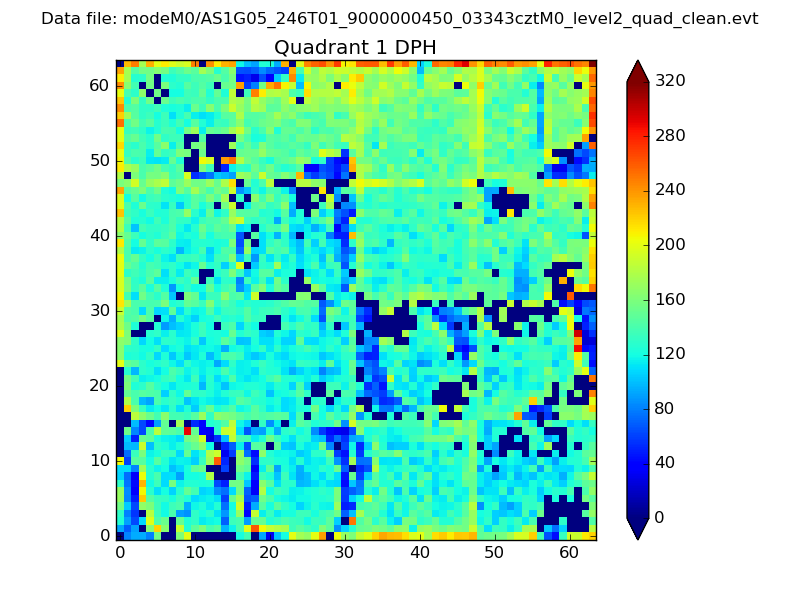 |
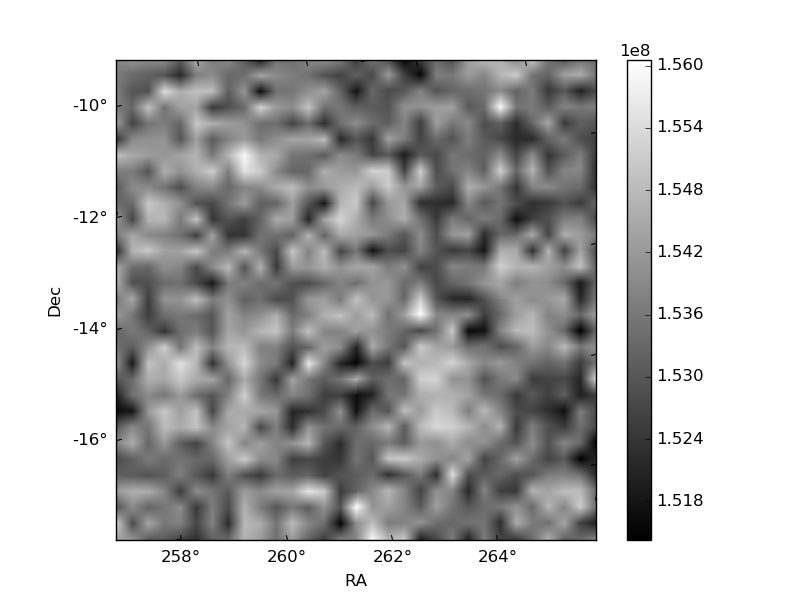
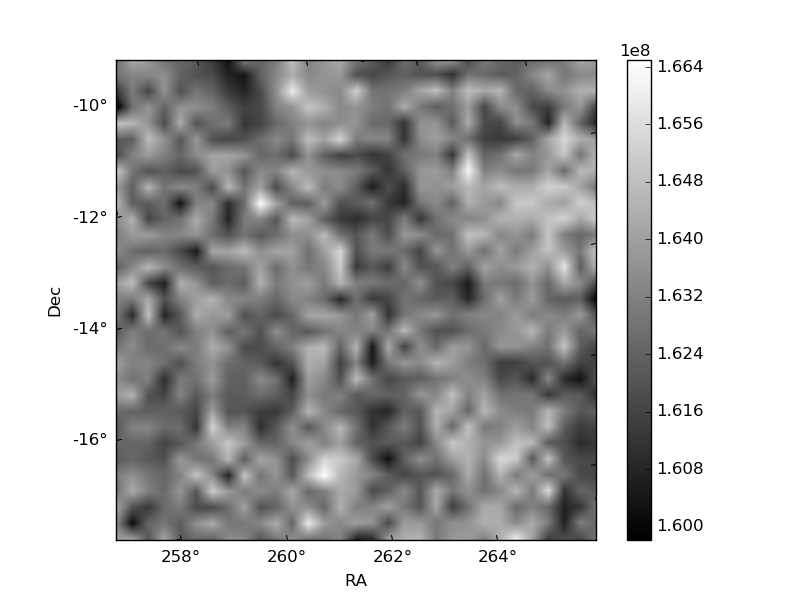
Quadrant B |
|---|---|---|---|
| Quadrant D | 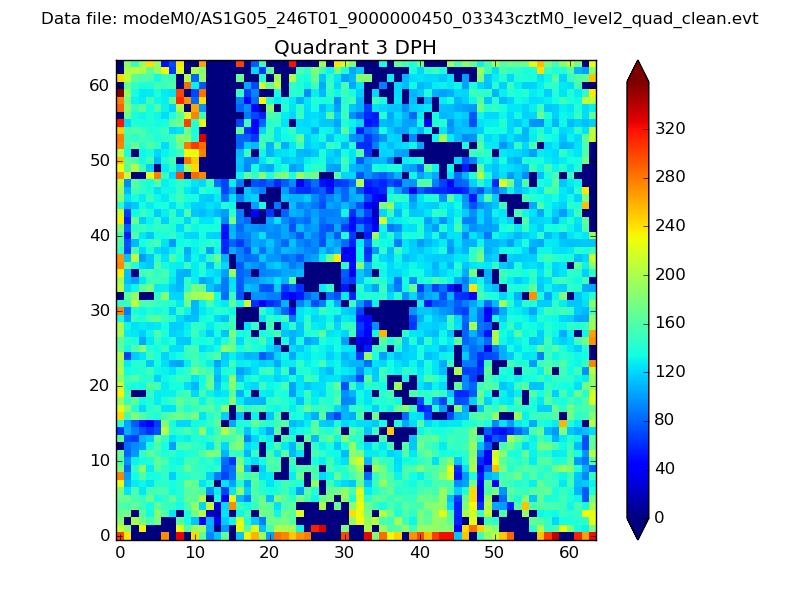 |
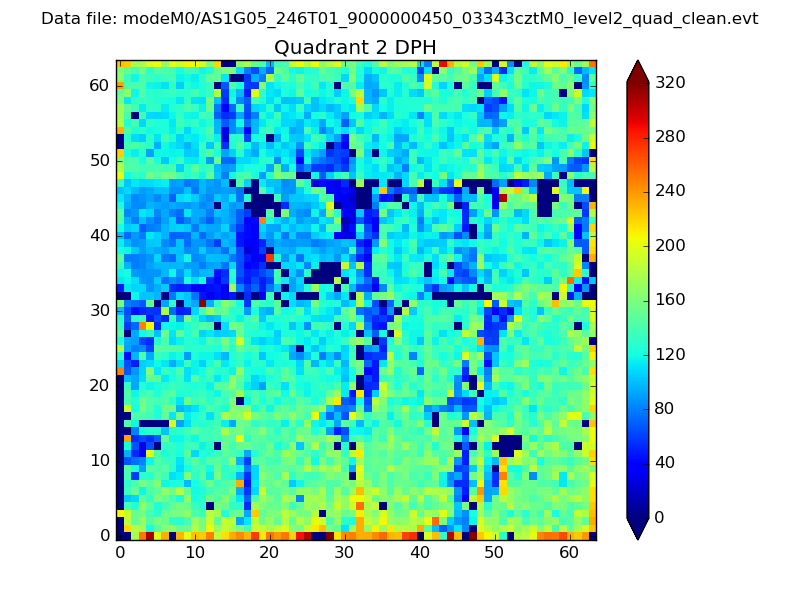 |
Quadrant C |
| Plot type | Count rate plots | Images |
|---|---|---|
| Comparison with Poisson distribution Blue bars denote a histogram of data divided into 1 sec bins. Red curve is a Poisson curve with rate = median count rate of data. |
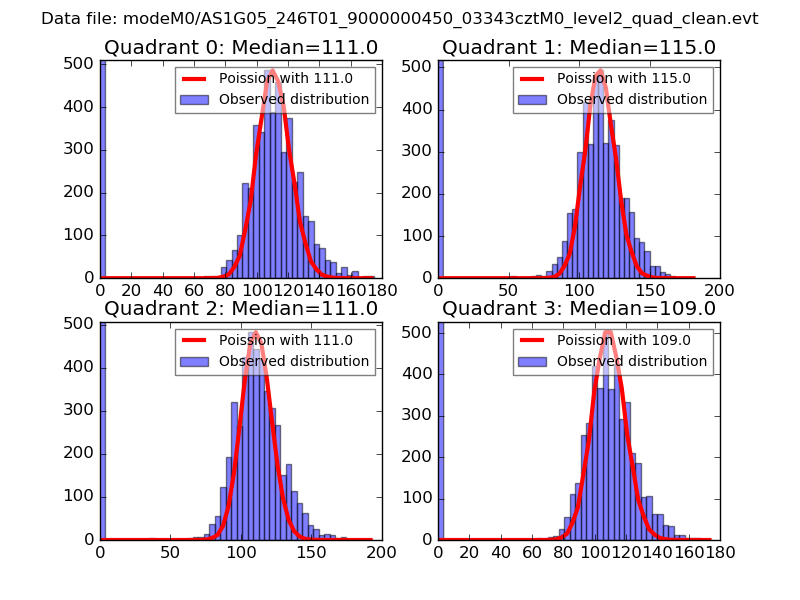 |
 |
| Quadrant-wise count rates Data is divided into 100 sec bins |
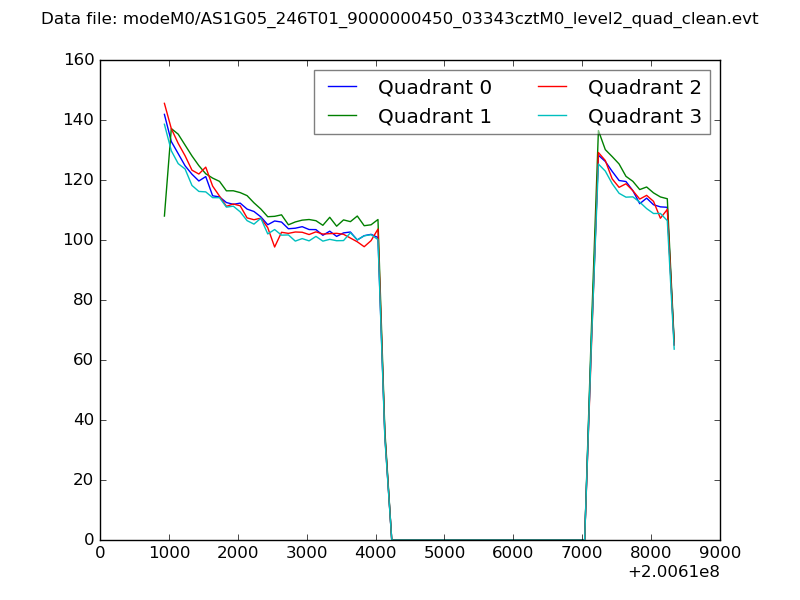 |
|
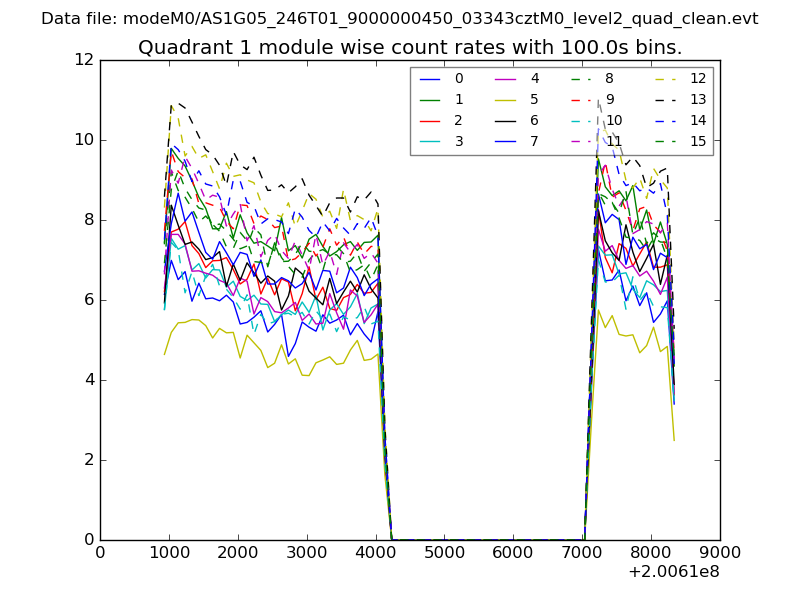
| Module-wise count rates for Quadrant A Data is divided into 100 sec bins |
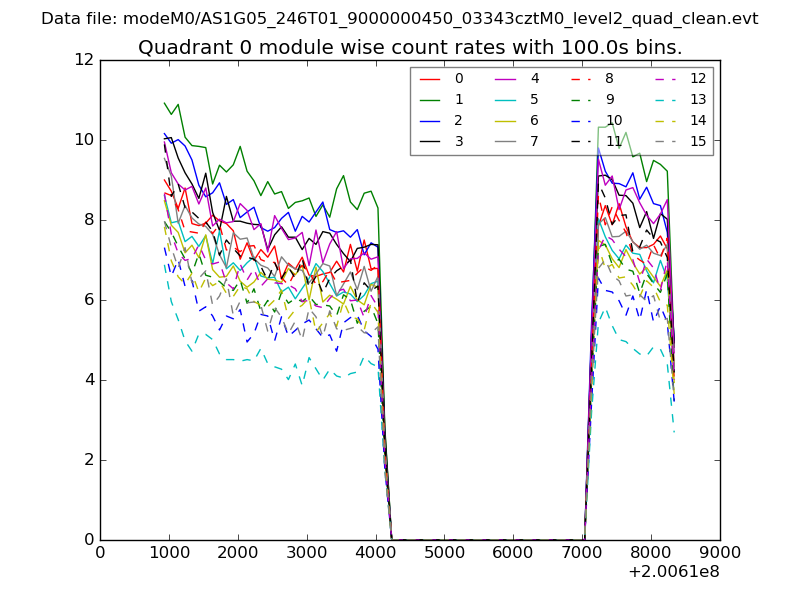 |
 |
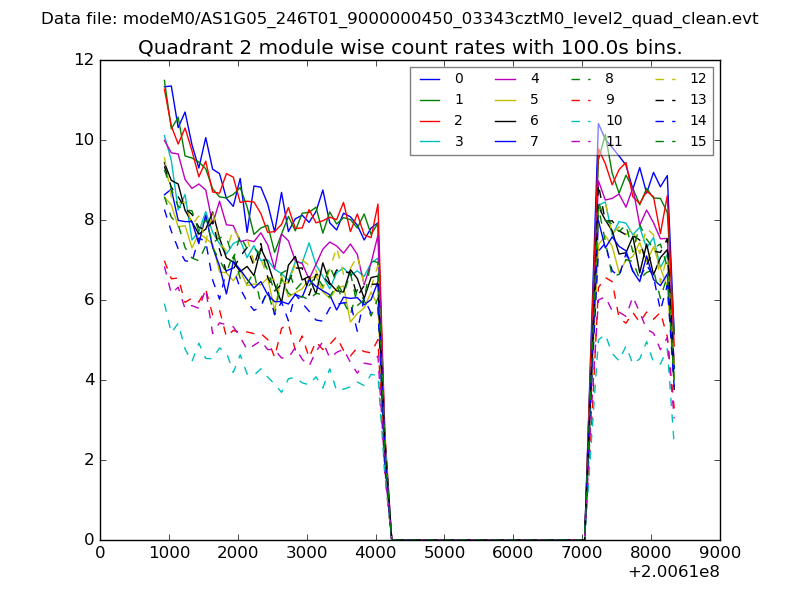
| Module-wise count rates for Quadrant B Data is divided into 100 sec bins |
 |
 |
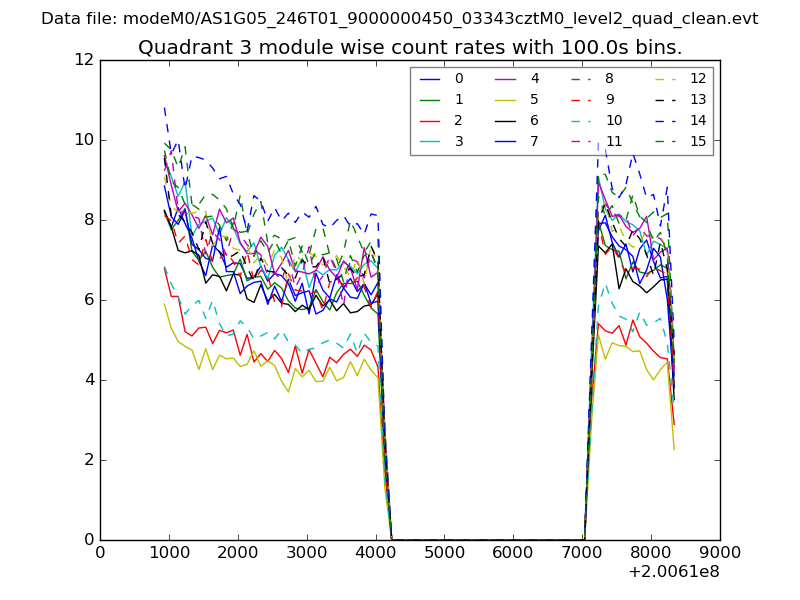
| Module-wise count rates for Quadrant C Data is divided into 100 sec bins |
 |
 |
| Module-wise count rates for Quadrant D Data is divided into 100 sec bins |
 |
 |
| Parameter | Plot |
|---|---|
| CZT HV Monitor | 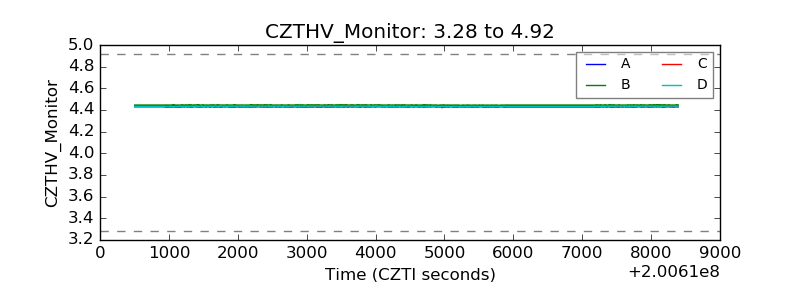 |
| D_VDD | 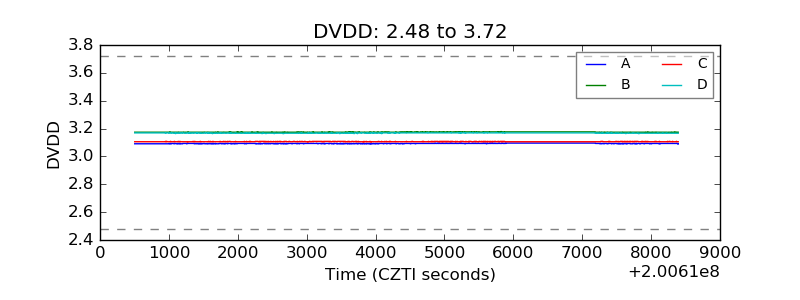 |
| Temperature 1 | 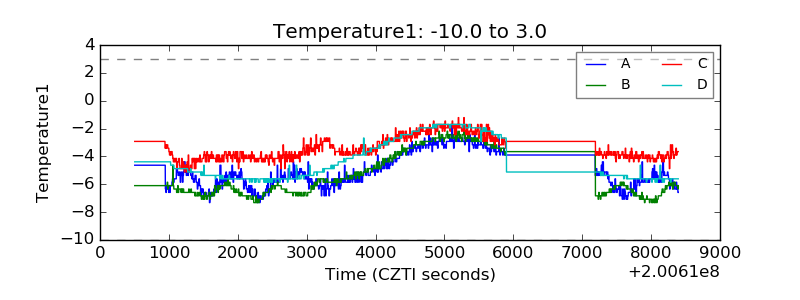 |
| Veto HV Monitor | 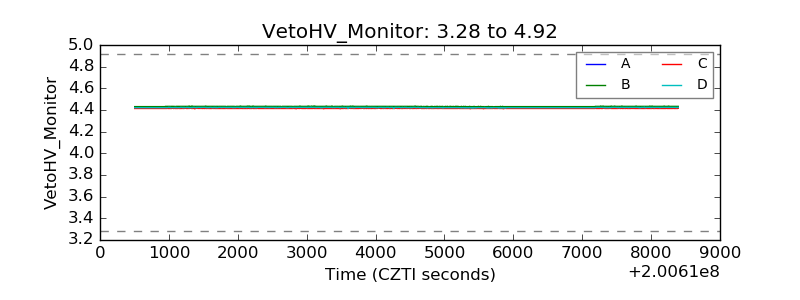 |
| Veto LLD | 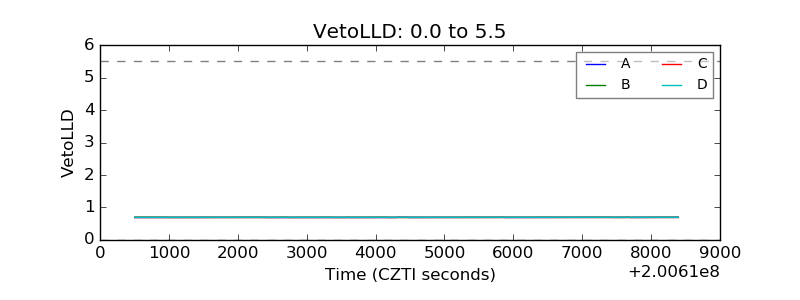 |
| Alpha Counter | 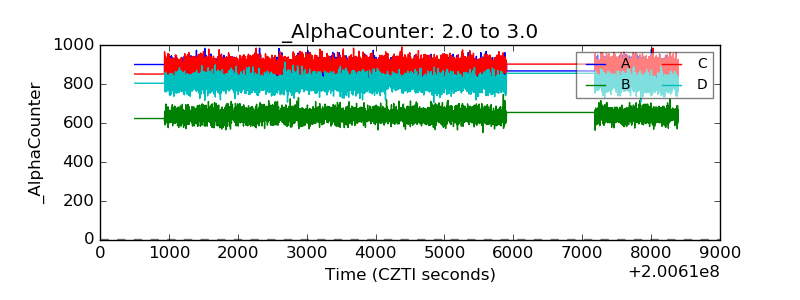 |
| _CPM_Rate | 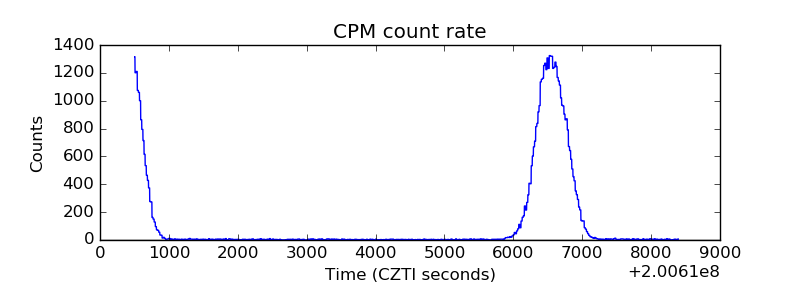 |
| CZT Counter | 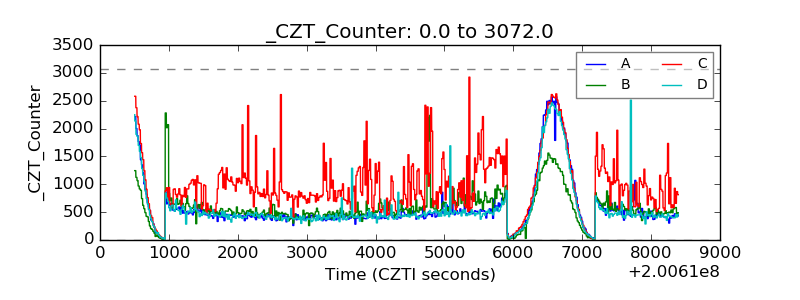 |
| +2.5 Volts monitor |  |
| +5 Volts monitor |  |
| _ROLL_ROT | 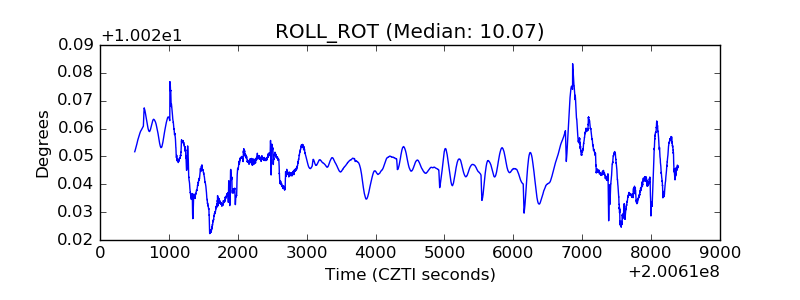 |
| _Roll_DEC | 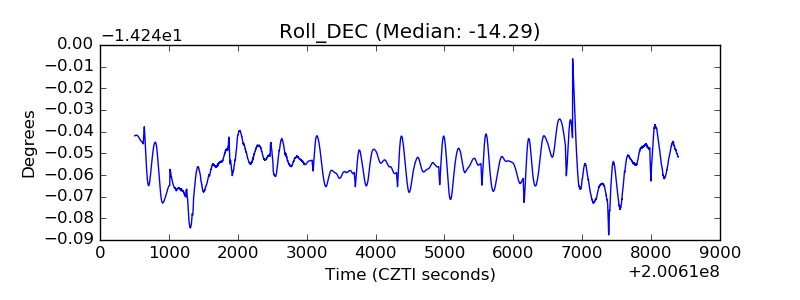 |
| _Roll_RA | 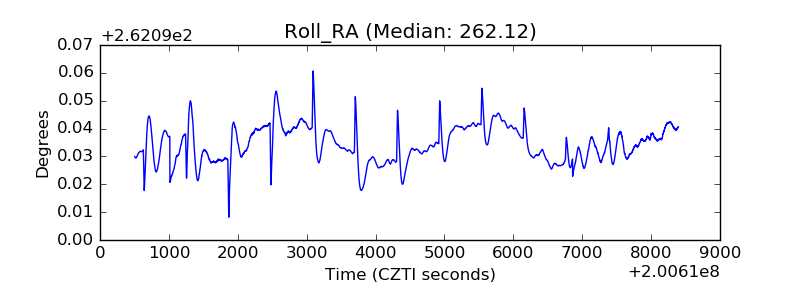 |
| Veto Counter | 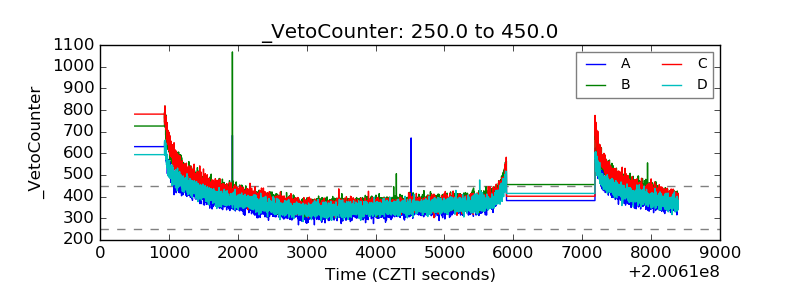 |