| Param | Original file | Final file |
|---|---|---|
| Filename | modeM0/AS1G05_246T01_9000000450_03345cztM0_level2.evt | modeM0/AS1G05_246T01_9000000450_03345cztM0_level2_quad_clean.evt |
| Size (bytes) | 482,091,840 | 81,483,840 |
| Size | 459.8 MB | 77.7 MB |
| Events in quadrant A | 3,128,470 | 494,490 |
| Events in quadrant B | 3,824,816 | 507,737 |
| Events in quadrant C | 4,041,042 | 499,718 |
| Events in quadrant D | 3,135,150 | 482,613 |
| Mode M0 | |||
|---|---|---|---|
| Quadrant | BADHDUFLAG | Total packets | Discarded packets |
| A | 0 | 14221 | 4 |
| B | 0 | 15989 | 3 |
| C | 0 | 16714 | 3 |
| D | 0 | 14425 | 3 |
| Mode SS | |||
|---|---|---|---|
| Quadrant | BADHDUFLAG | Total packets | Discarded packets |
| A | 0 | 142 | 0 |
| B | 0 | 142 | 0 |
| C | 0 | 142 | 0 |
| D | 0 | 142 | 0 |
| Mode M9 | |||
|---|---|---|---|
| Quadrant | BADHDUFLAG | Total packets | Discarded packets |
| A | 0 | 20 | 0 |
| B | 0 | 20 | 0 |
| C | 0 | 20 | 0 |
| D | 0 | 21 | 0 |
| Quadrant | Total seconds | Saturated seconds | Saturation percentage |
|---|---|---|---|
| A | 6927 | 27 | 0.389779% |
| B | 6927 | 50 | 0.721813% |
| C | 6927 | 52 | 0.750686% |
| D | 6927 | 34 | 0.490833% |
Noise dominated data is calculated using 1-second bins in cleaned event files. If a bin has >2000 counts, and if more than 50% of those come from <1% of pixels, then it is considered to be noise-dominated and hence unusable.
| Quadrant | # 1 sec bins | Bins with >0 counts | Bins with >2000 counts | High rate bins dominated by noise | Noise dominated (total time) | Noise dominated (detector-on time) | Marked lightcurve |
|---|---|---|---|---|---|---|---|
| A | 8022 | 6929 | 0 | 0 | 0.00% | 0.00% | 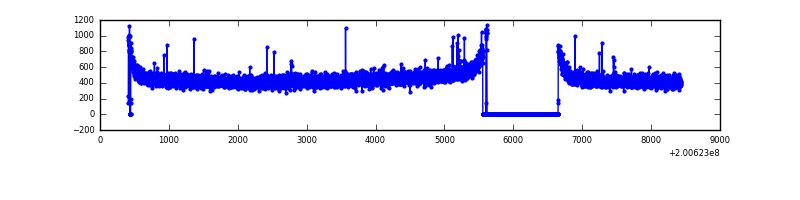 |
| B | 8022 | 6929 | 4 | 4 | 0.05% | 0.06% | 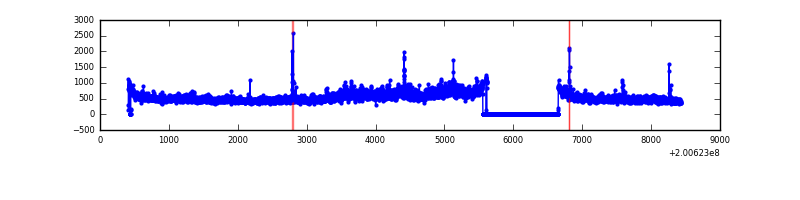 |
| C | 8022 | 6929 | 13 | 13 | 0.16% | 0.19% |  |
| D | 8022 | 6929 | 16 | 16 | 0.20% | 0.23% | 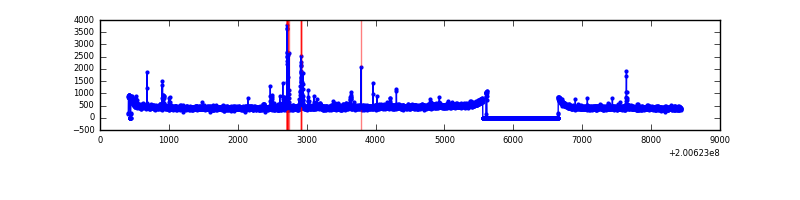 |
Top three noisy pixels from each quadrant. If the there are fewer than three noisy pixels in the level2.evt file, extra rows are filled as -1
| Pixel properties | Quadrant properties | ||||||
|---|---|---|---|---|---|---|---|
| Quadrant | DetID | PixID | Counts | Sigma | Mean | Median | Sigma |
| A | 14 | 249 | 18691 | 108.16 | 804 | 785 | 165.5 |
| A | 0 | 226 | 8563 | 46.98 | 804 | 785 | 165.5 |
| A | 12 | 194 | 8536 | 46.82 | 804 | 785 | 165.5 |
| B | 15 | 204 | 466862 | 2937.93 | 818 | 799 | 158.6 |
| B | 14 | 167 | 89402 | 558.53 | 818 | 799 | 158.6 |
| B | 3 | 0 | 36734 | 226.52 | 818 | 799 | 158.6 |
| C | 8 | 208 | 811177 | 4332.48 | 790 | 793 | 187.0 |
| C | 9 | 54 | 48781 | 256.55 | 790 | 793 | 187.0 |
| C | 14 | 223 | 32308 | 168.49 | 790 | 793 | 187.0 |
| D | 9 | 85 | 57114 | 292.55 | 786 | 761 | 192.6 |
| D | 13 | 223 | 36268 | 184.33 | 786 | 761 | 192.6 |
| D | 8 | 195 | 15005 | 73.94 | 786 | 761 | 192.6 |
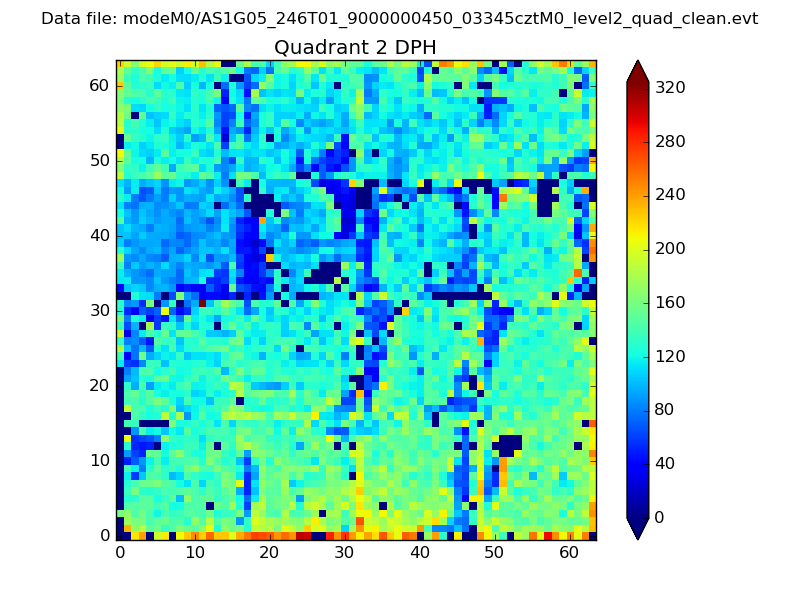
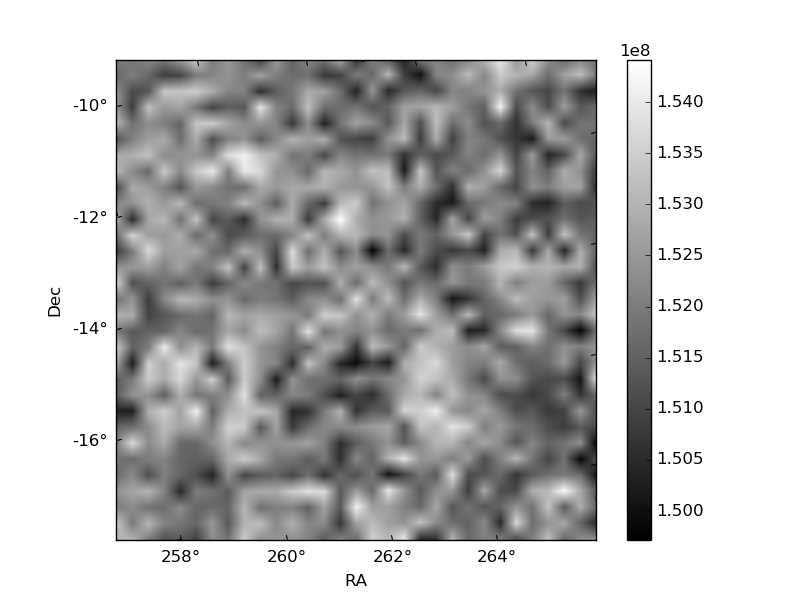
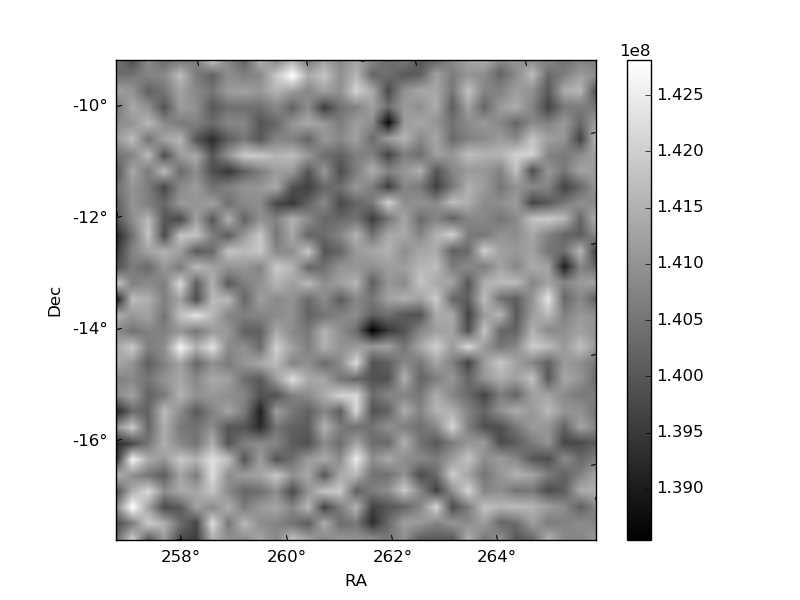
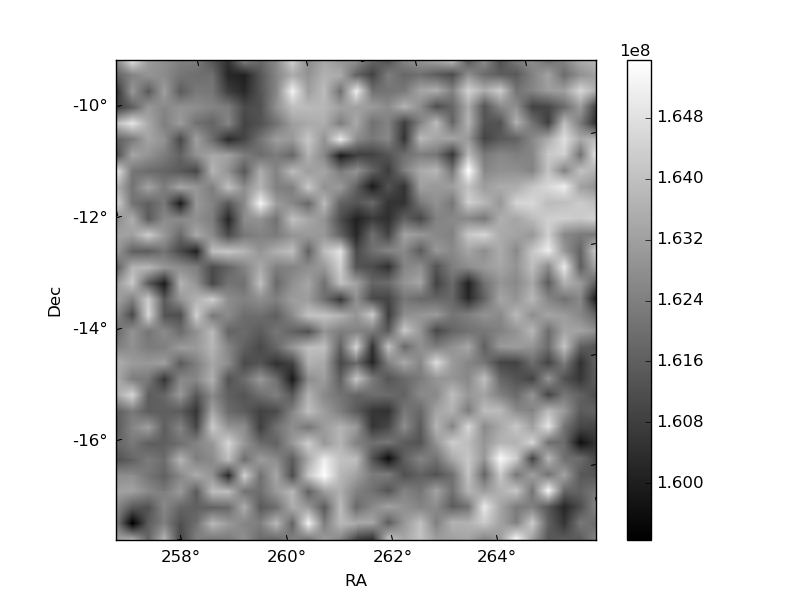
Histogram calculated using DETX and DETY for each event in the final _common_clean file
| Quadrant A | 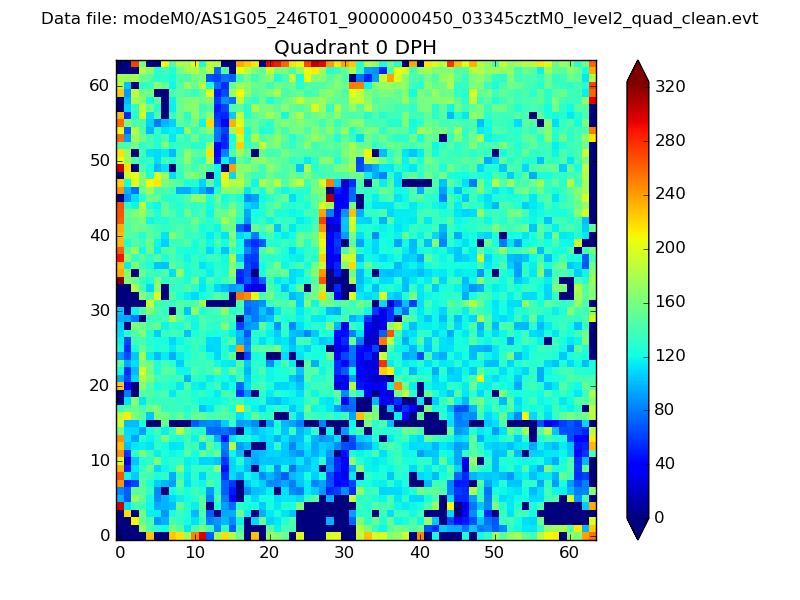 |
 |
Quadrant B |
|---|---|---|---|
| Quadrant D | 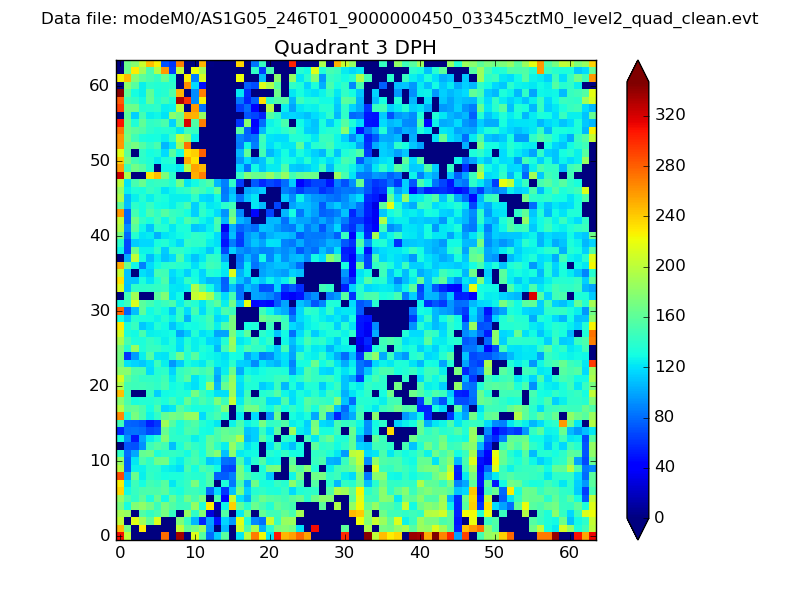 |
 |
Quadrant C |
| Plot type | Count rate plots | Images |
|---|---|---|
| Comparison with Poisson distribution Blue bars denote a histogram of data divided into 1 sec bins. Red curve is a Poisson curve with rate = median count rate of data. |
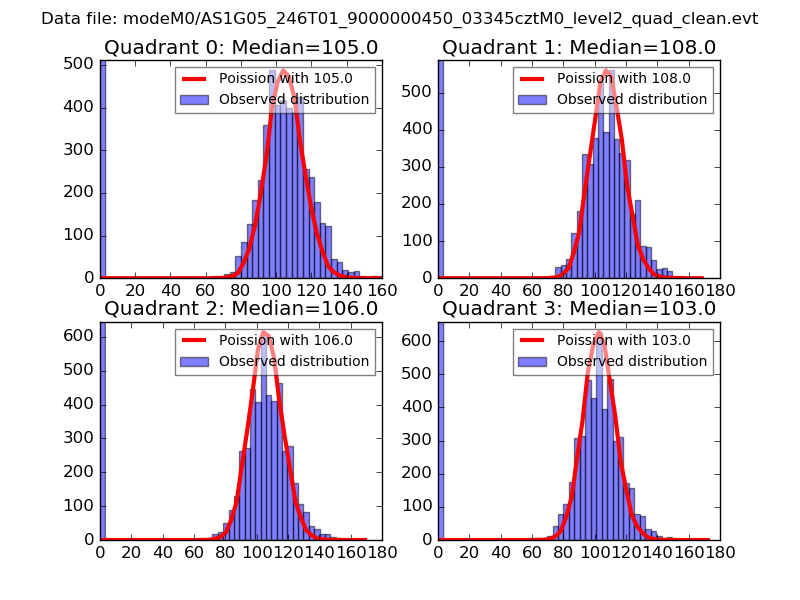 |
 |
| Quadrant-wise count rates Data is divided into 100 sec bins |
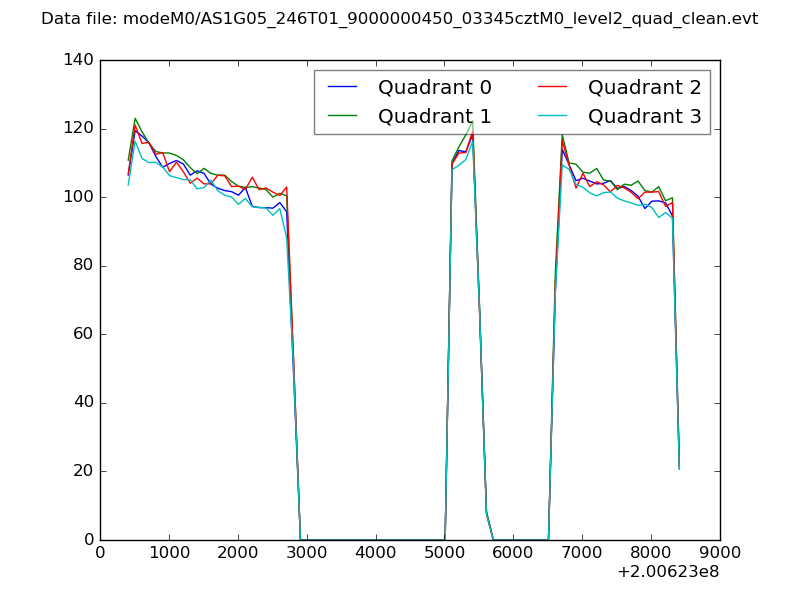 |
|
| Module-wise count rates for Quadrant A Data is divided into 100 sec bins |
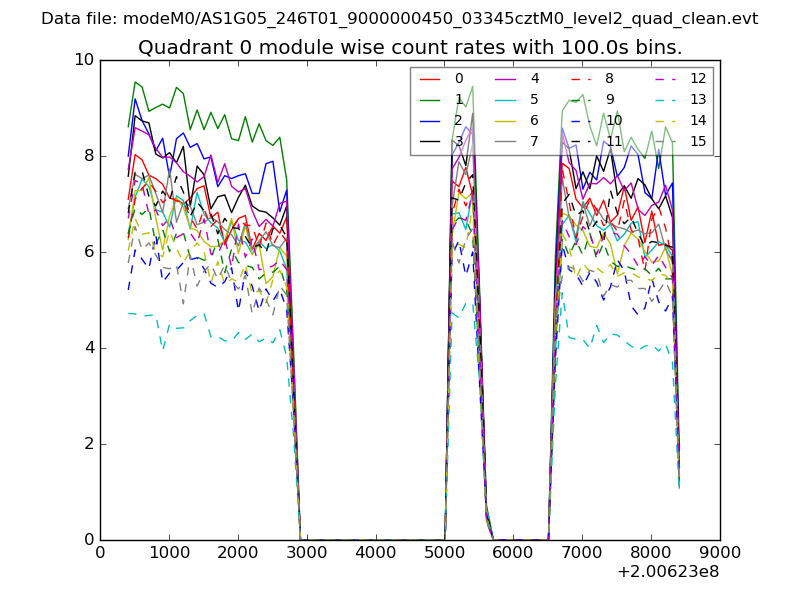 |
 |
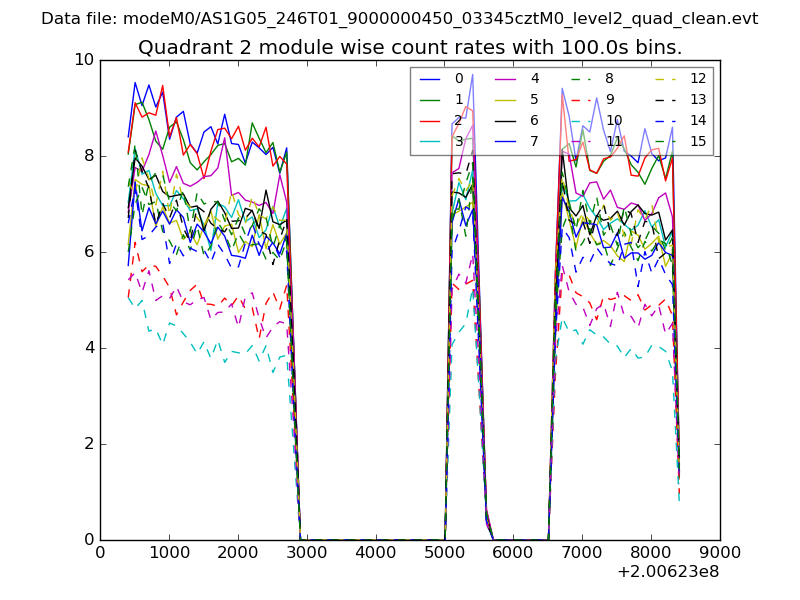
| Module-wise count rates for Quadrant B Data is divided into 100 sec bins |
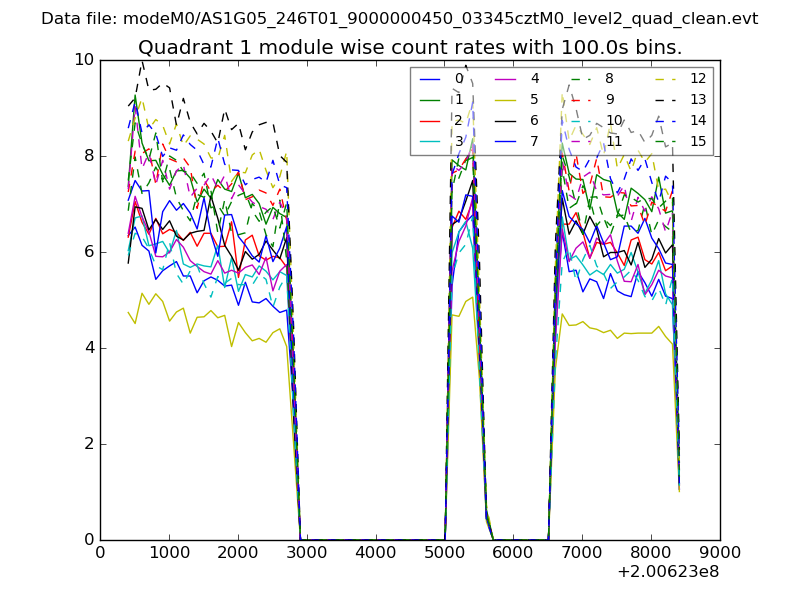 |
 |
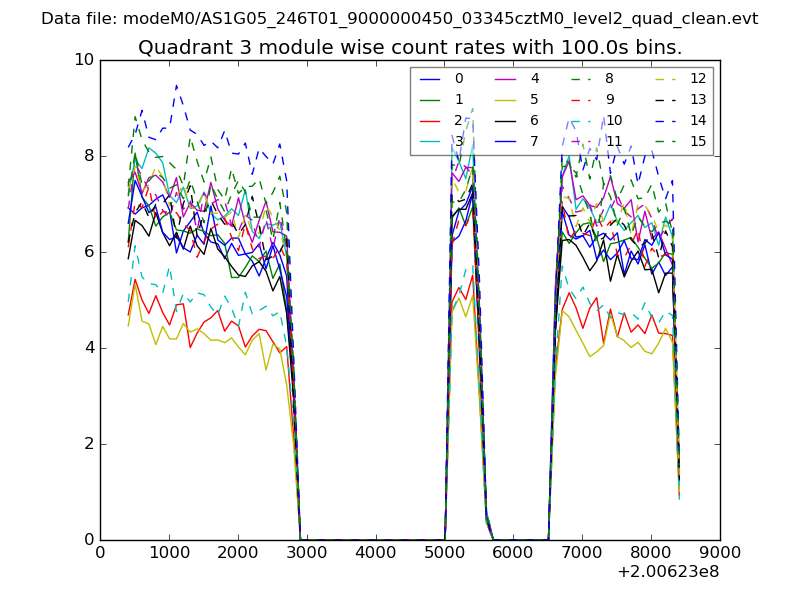
| Module-wise count rates for Quadrant C Data is divided into 100 sec bins |
 |
 |
| Module-wise count rates for Quadrant D Data is divided into 100 sec bins |
 |
 |
| Parameter | Plot |
|---|---|
| CZT HV Monitor | 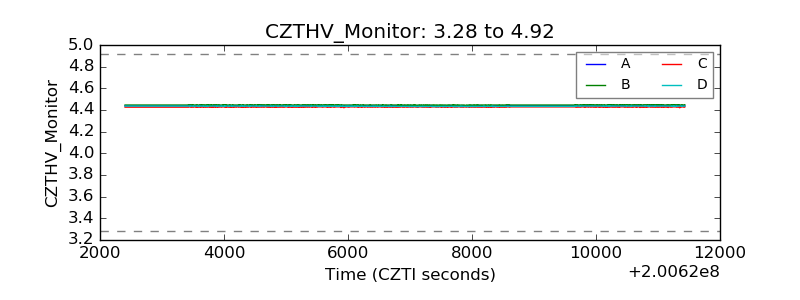 |
| D_VDD | 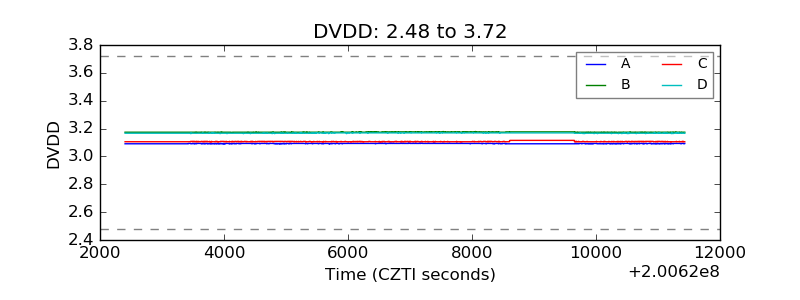 |
| Temperature 1 | 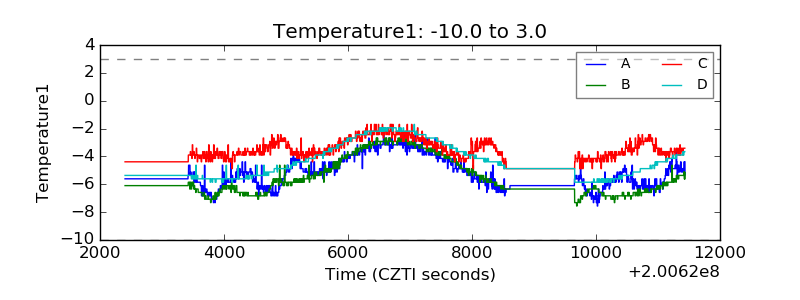 |
| Veto HV Monitor | 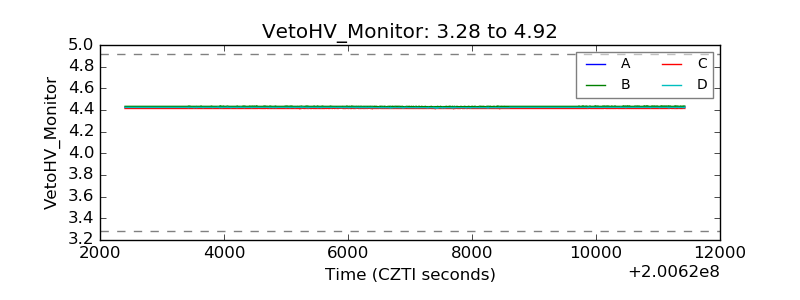 |
| Veto LLD | 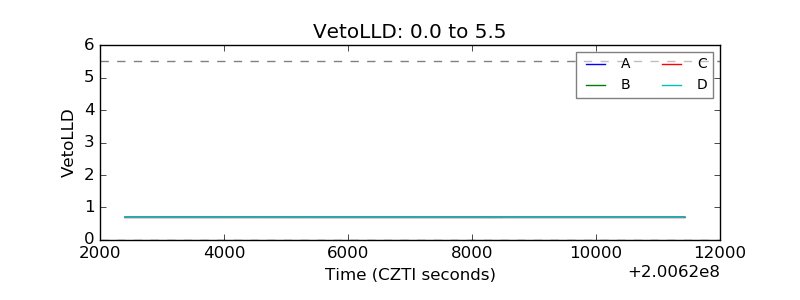 |
| Alpha Counter | 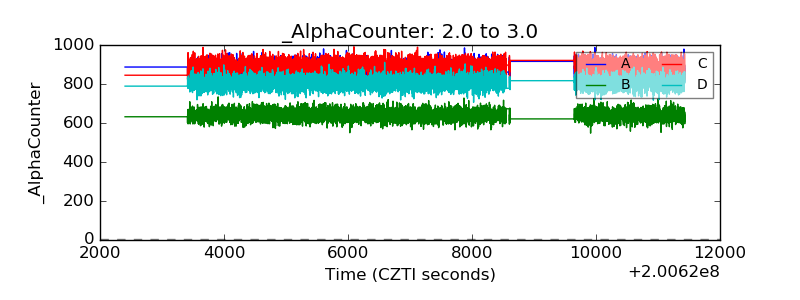 |
| _CPM_Rate | 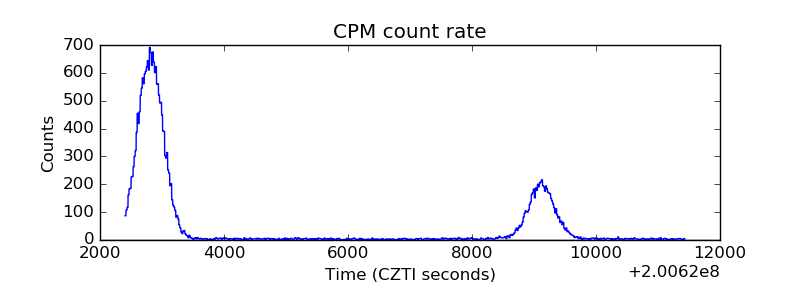 |
| CZT Counter | 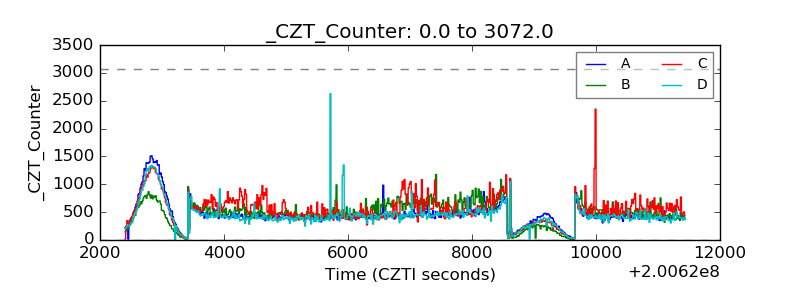 |
| +2.5 Volts monitor |  |
| +5 Volts monitor |  |
| _ROLL_ROT | 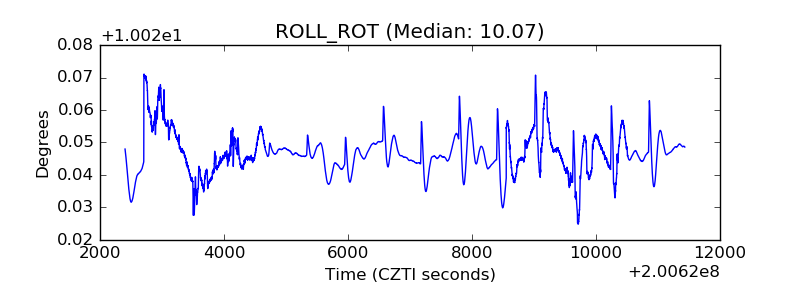 |
| _Roll_DEC | 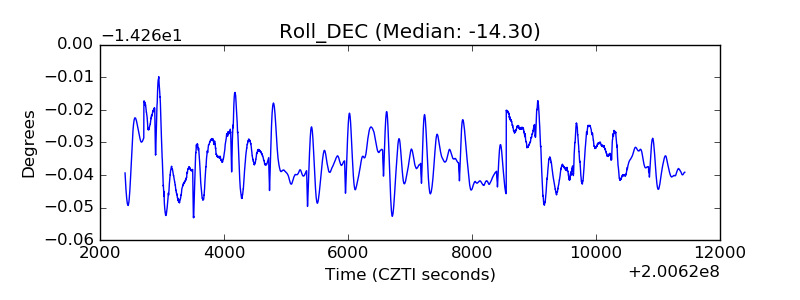 |
| _Roll_RA | 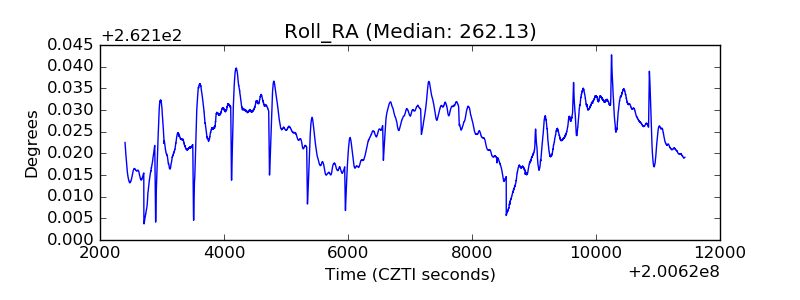 |
| Veto Counter | 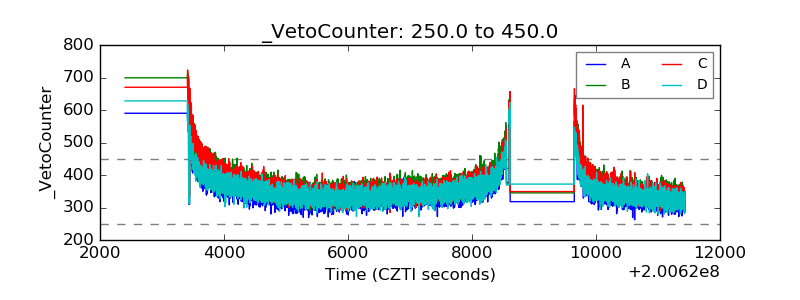 |