| Param | Original file | Final file |
|---|---|---|
| Filename | modeM0/AS1G05_246T01_9000000450_03347cztM0_level2.evt | modeM0/AS1G05_246T01_9000000450_03347cztM0_level2_quad_clean.evt |
| Size (bytes) | 609,373,440 | 89,167,680 |
| Size | 581.1 MB | 85.0 MB |
| Events in quadrant A | 3,721,282 | 541,135 |
| Events in quadrant B | 4,286,709 | 554,022 |
| Events in quadrant C | 5,862,509 | 522,070 |
| Events in quadrant D | 4,041,256 | 525,829 |
| Mode M0 | |||
|---|---|---|---|
| Quadrant | BADHDUFLAG | Total packets | Discarded packets |
| A | 0 | 16799 | 3 |
| B | 0 | 17893 | 2 |
| C | 0 | 22970 | 2 |
| D | 0 | 18082 | 2 |
| Mode SS | |||
|---|---|---|---|
| Quadrant | BADHDUFLAG | Total packets | Discarded packets |
| A | 0 | 162 | 0 |
| B | 0 | 162 | 0 |
| C | 0 | 162 | 0 |
| D | 0 | 162 | 0 |
| Quadrant | Total seconds | Saturated seconds | Saturation percentage |
|---|---|---|---|
| A | 7993 | 381 | 4.766671% |
| B | 7993 | 384 | 4.804204% |
| C | 7993 | 843 | 10.546728% |
| D | 7993 | 420 | 5.254598% |
Noise dominated data is calculated using 1-second bins in cleaned event files. If a bin has >2000 counts, and if more than 50% of those come from <1% of pixels, then it is considered to be noise-dominated and hence unusable.
| Quadrant | # 1 sec bins | Bins with >0 counts | Bins with >2000 counts | High rate bins dominated by noise | Noise dominated (total time) | Noise dominated (detector-on time) | Marked lightcurve |
|---|---|---|---|---|---|---|---|
| A | 8043 | 7994 | 4 | 4 | 0.05% | 0.05% | 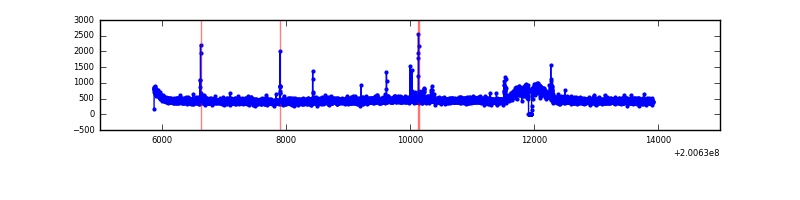 |
| B | 8043 | 7994 | 1 | 1 | 0.01% | 0.01% | 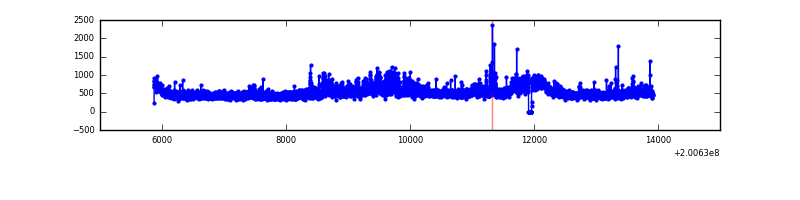 |
| C | 8043 | 7994 | 443 | 443 | 5.51% | 5.54% | 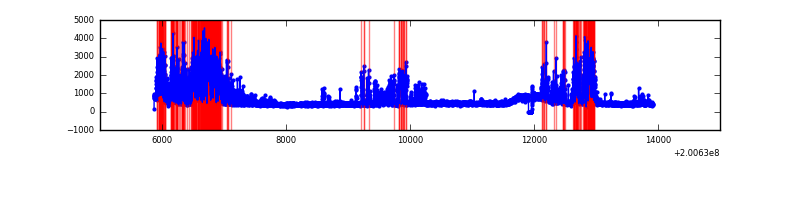 |
| D | 8043 | 7994 | 85 | 85 | 1.06% | 1.06% | 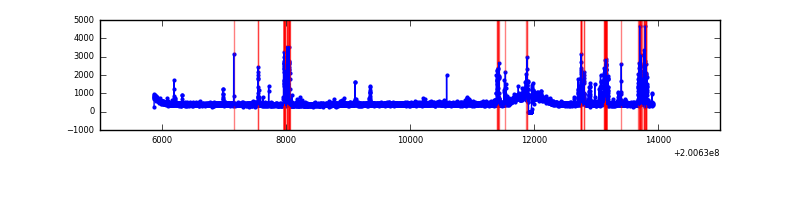 |
Top three noisy pixels from each quadrant. If the there are fewer than three noisy pixels in the level2.evt file, extra rows are filled as -1
| Pixel properties | Quadrant properties | ||||||
|---|---|---|---|---|---|---|---|
| Quadrant | DetID | PixID | Counts | Sigma | Mean | Median | Sigma |
| A | 0 | 50 | 36215 | 182.8 | 943 | 918 | 193.1 |
| A | 14 | 249 | 31439 | 158.07 | 943 | 918 | 193.1 |
| A | 0 | 118 | 12903 | 62.07 | 943 | 918 | 193.1 |
| B | 15 | 204 | 429469 | 2284.67 | 956 | 930 | 187.6 |
| B | 14 | 167 | 80010 | 421.6 | 956 | 930 | 187.6 |
| B | 2 | 249 | 33628 | 174.32 | 956 | 930 | 187.6 |
| C | 8 | 208 | 1583509 | 7455.37 | 905 | 907 | 212.3 |
| C | 14 | 223 | 594170 | 2794.76 | 905 | 907 | 212.3 |
| C | 5 | 250 | 41834 | 192.8 | 905 | 907 | 212.3 |
| D | 13 | 223 | 510655 | 2258.05 | 921 | 891 | 225.8 |
| D | 4 | 160 | 40298 | 174.56 | 921 | 891 | 225.8 |
| D | 10 | 172 | 11152 | 45.45 | 921 | 891 | 225.8 |
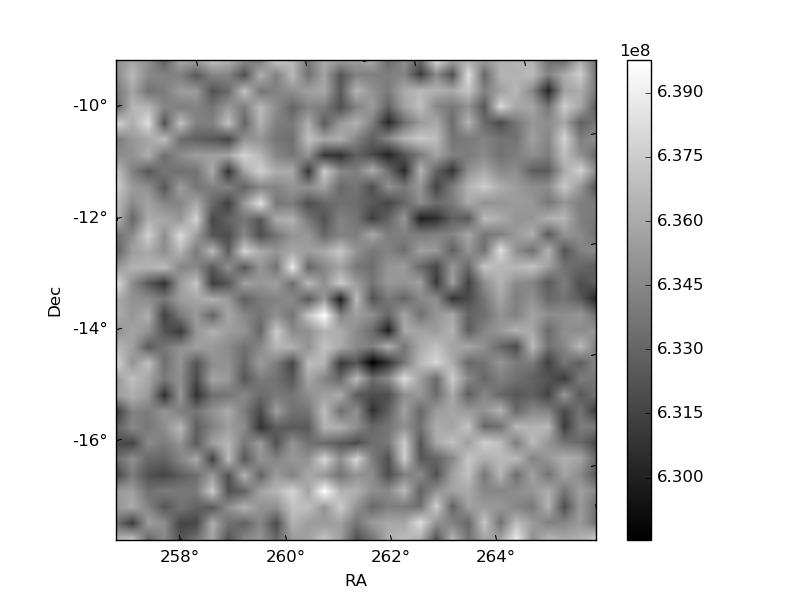
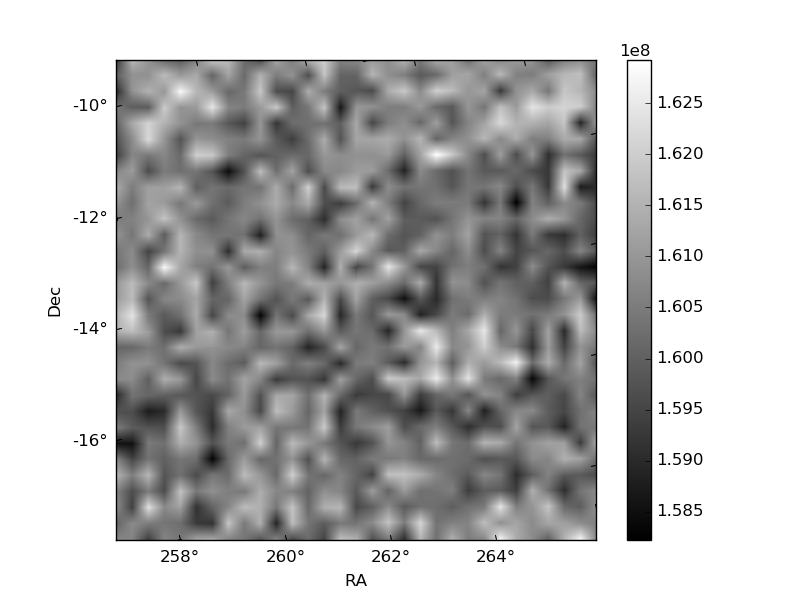
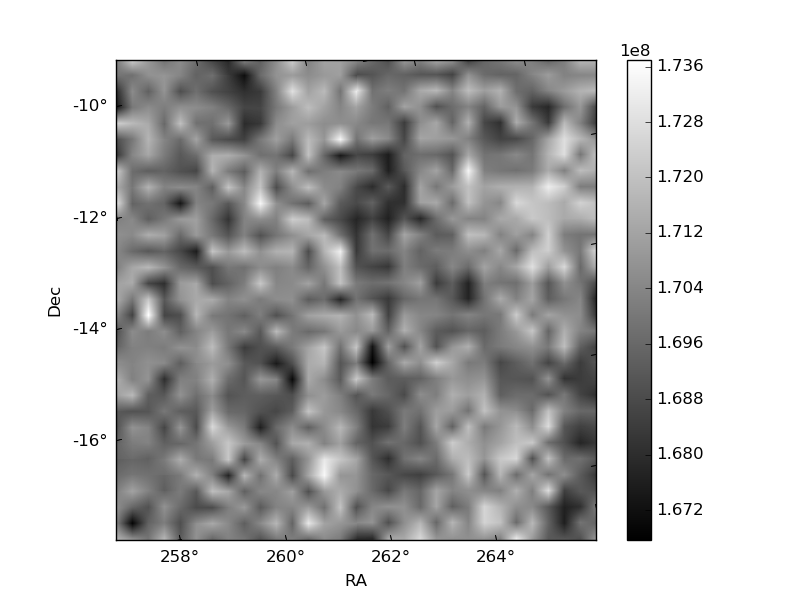
Histogram calculated using DETX and DETY for each event in the final _common_clean file
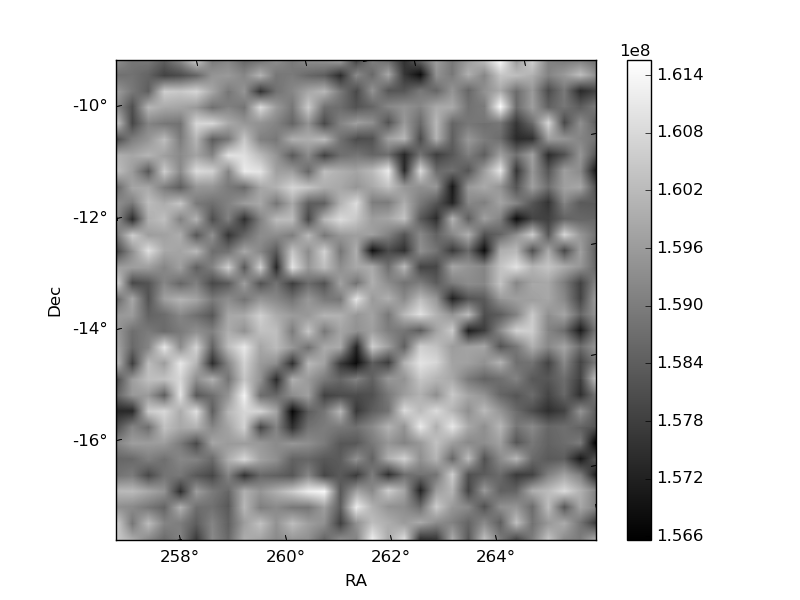
| Quadrant A | 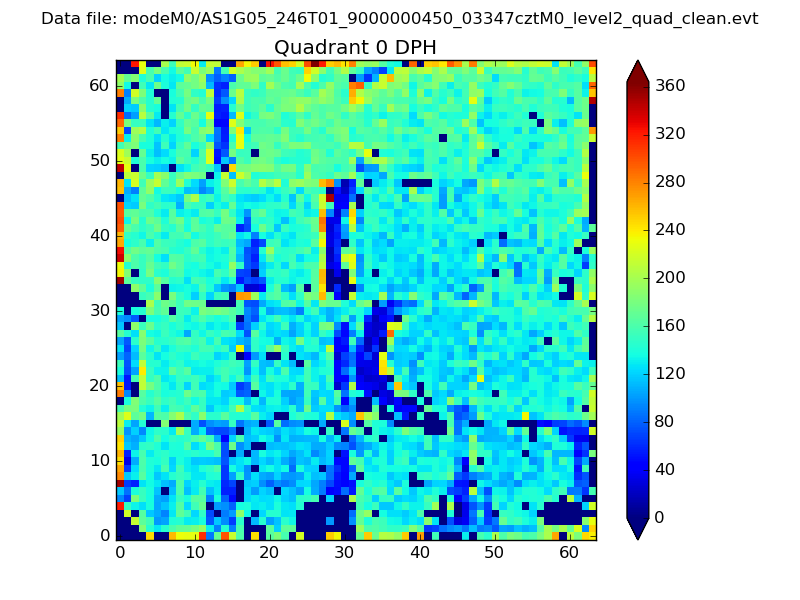 |
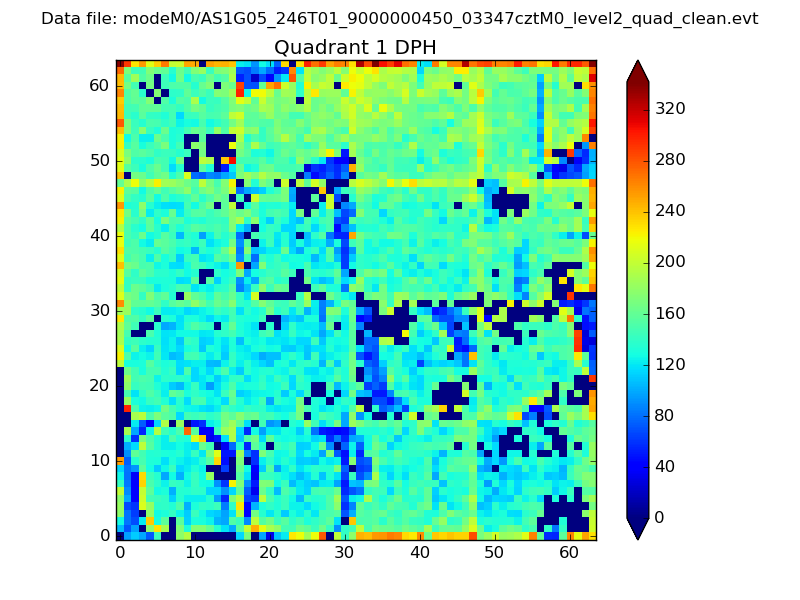 |
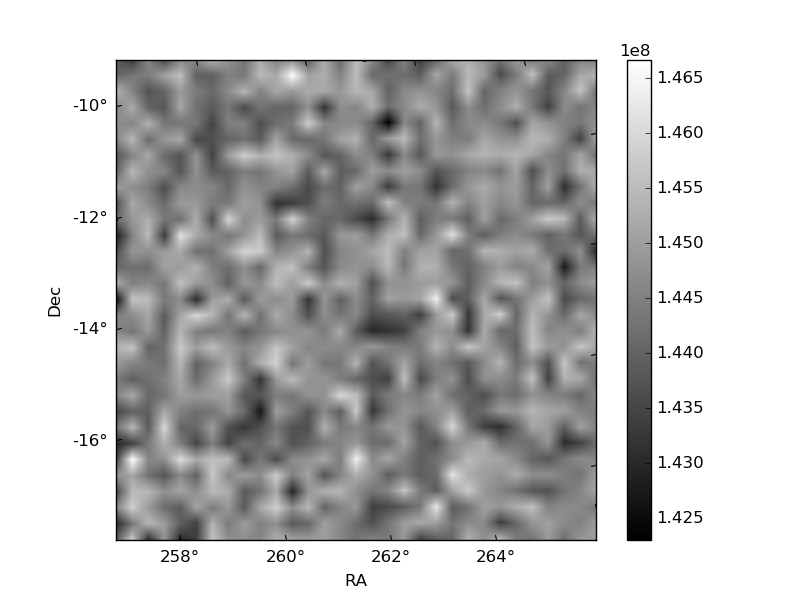
Quadrant B |
|---|---|---|---|
| Quadrant D |  |
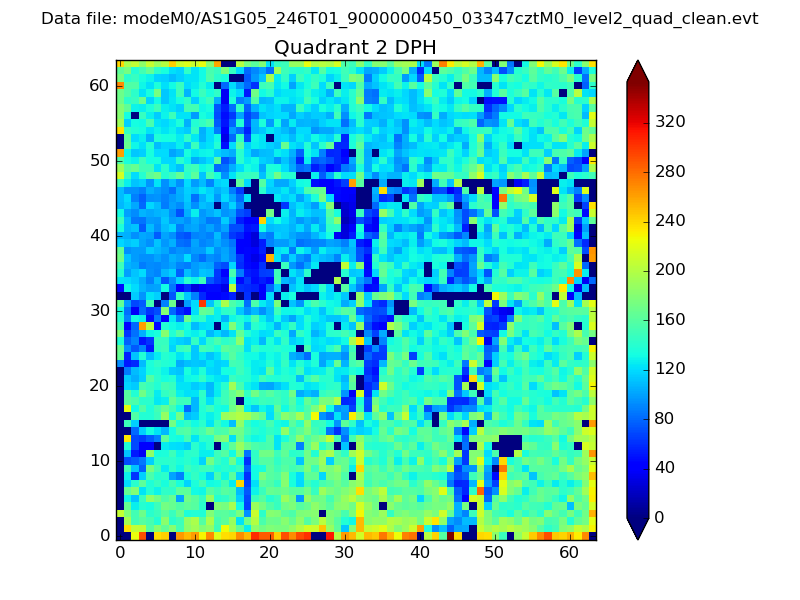 |
Quadrant C |
| Plot type | Count rate plots | Images |
|---|---|---|
| Comparison with Poisson distribution Blue bars denote a histogram of data divided into 1 sec bins. Red curve is a Poisson curve with rate = median count rate of data. |
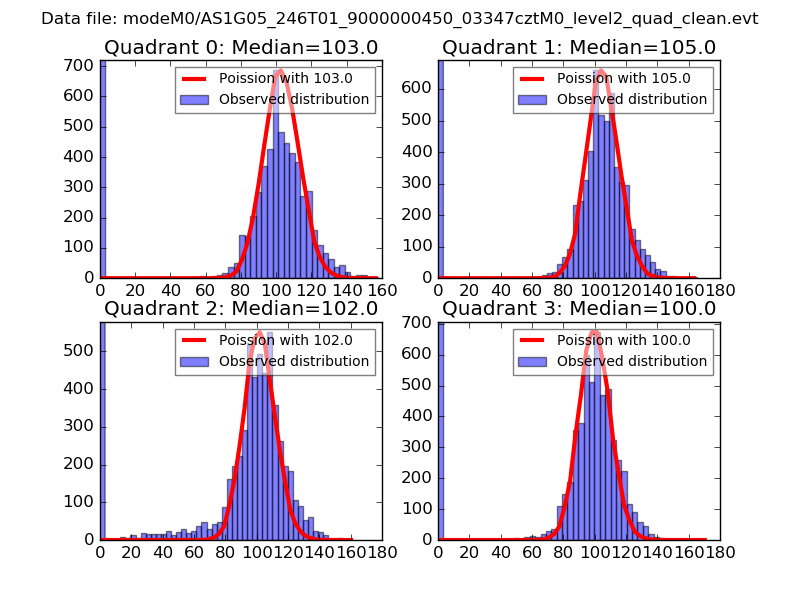 |
 |
| Quadrant-wise count rates Data is divided into 100 sec bins |
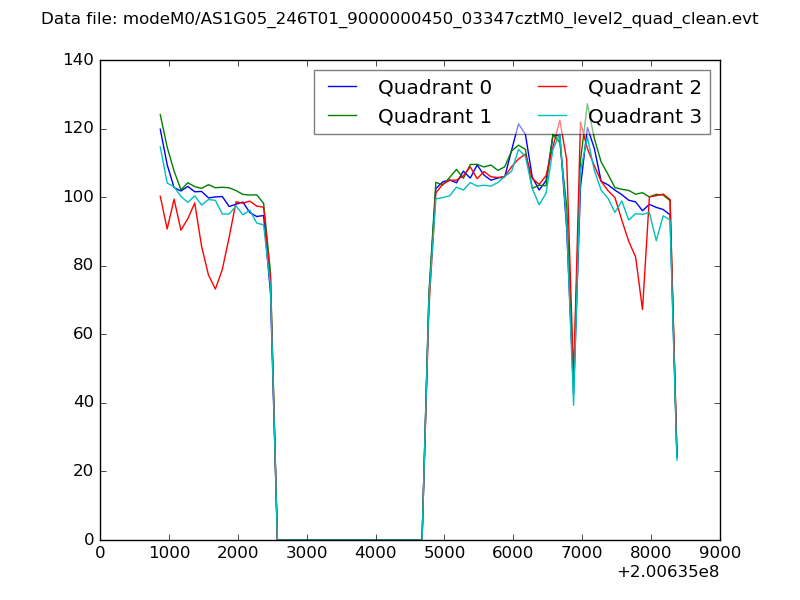 |
|
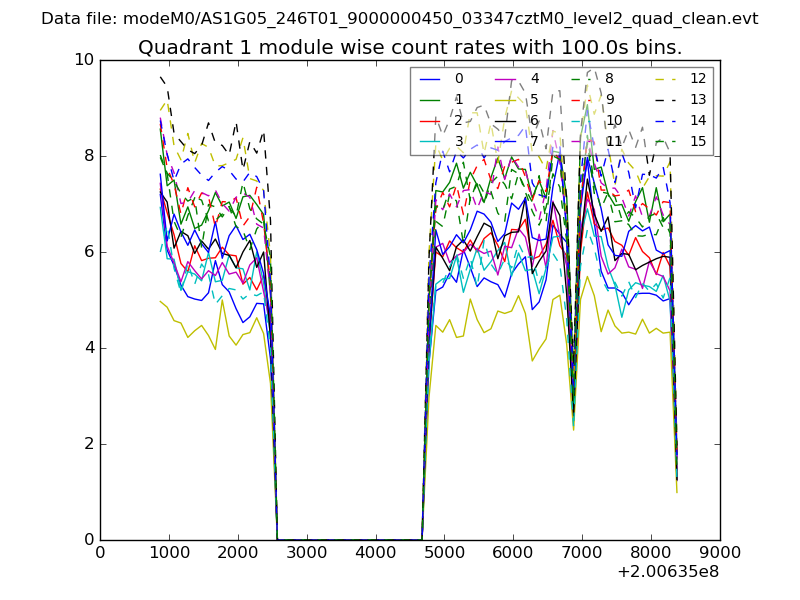
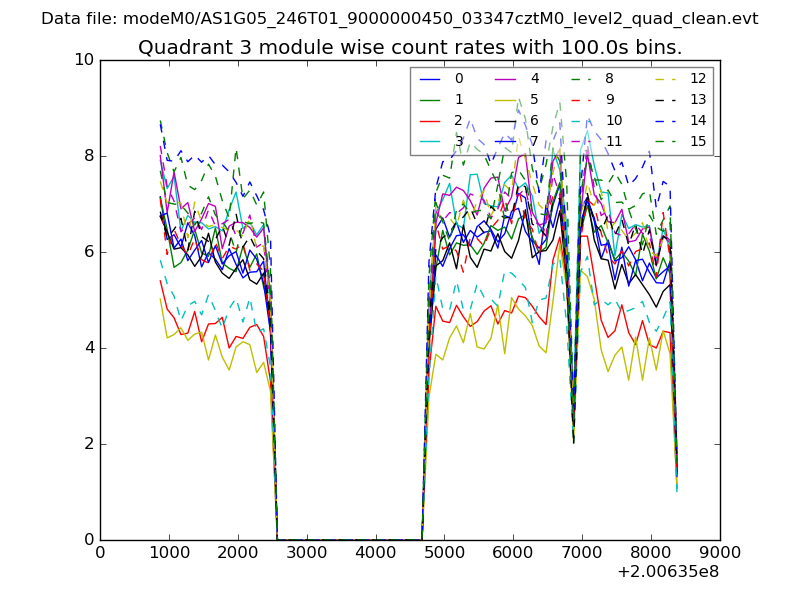
| Module-wise count rates for Quadrant A Data is divided into 100 sec bins |
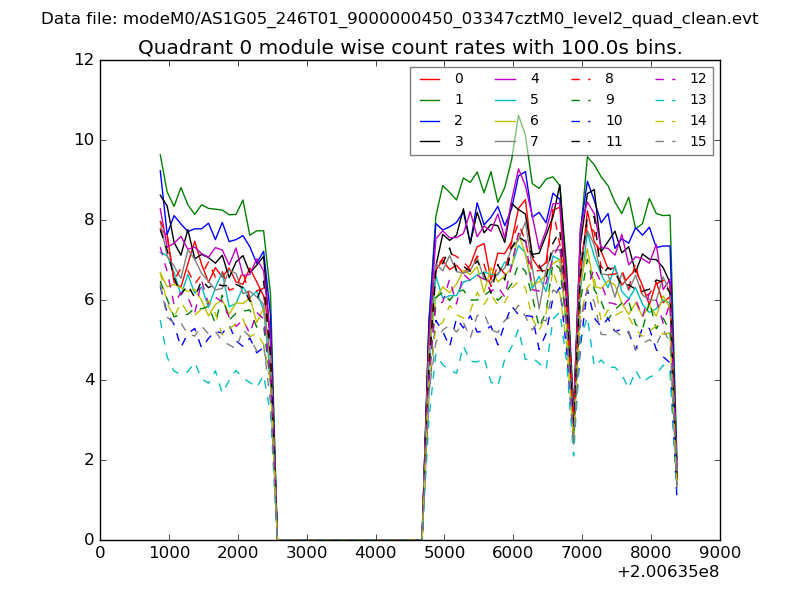 |
 |
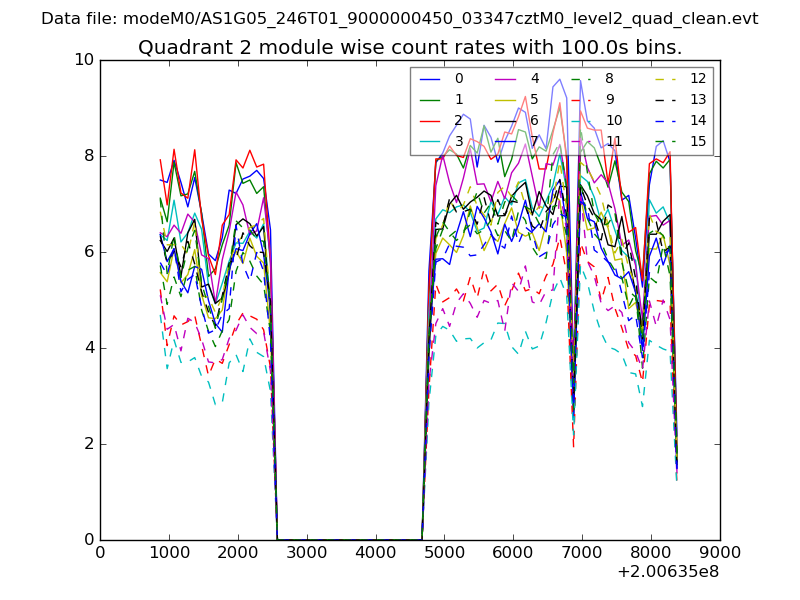
| Module-wise count rates for Quadrant B Data is divided into 100 sec bins |
 |
 |
| Module-wise count rates for Quadrant C Data is divided into 100 sec bins |
 |
 |
| Module-wise count rates for Quadrant D Data is divided into 100 sec bins |
 |
 |
| Parameter | Plot |
|---|---|
| CZT HV Monitor | 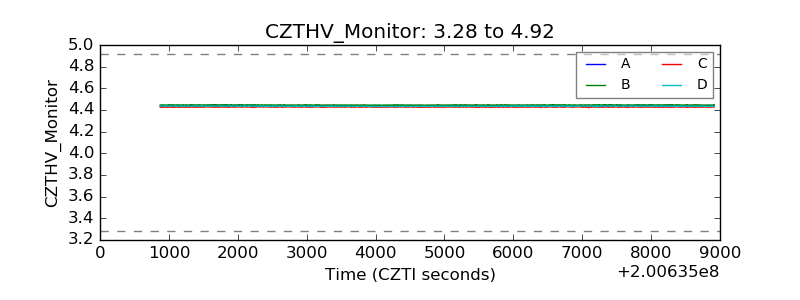 |
| D_VDD | 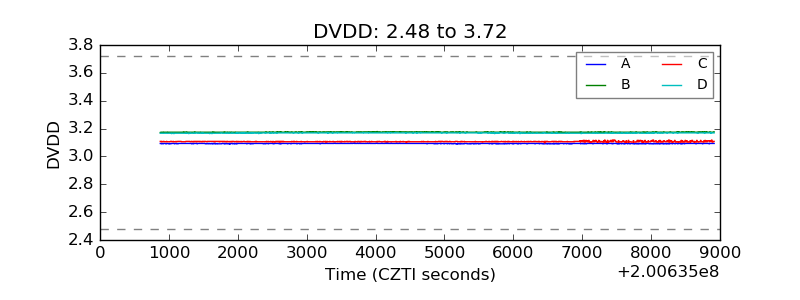 |
| Temperature 1 | 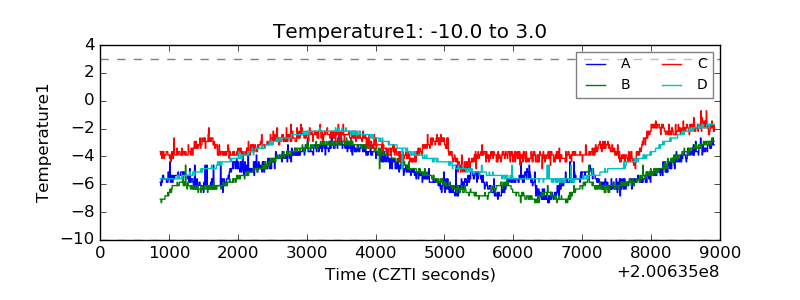 |
| Veto HV Monitor | 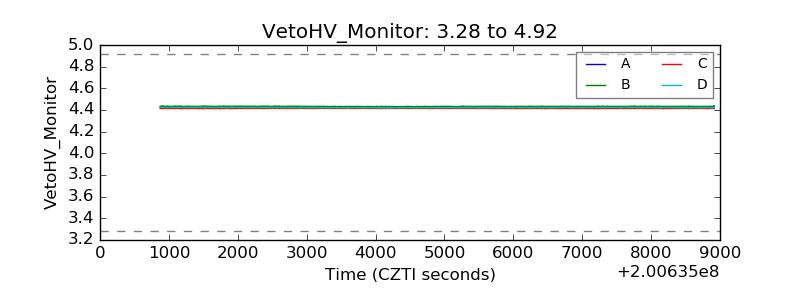 |
| Veto LLD | 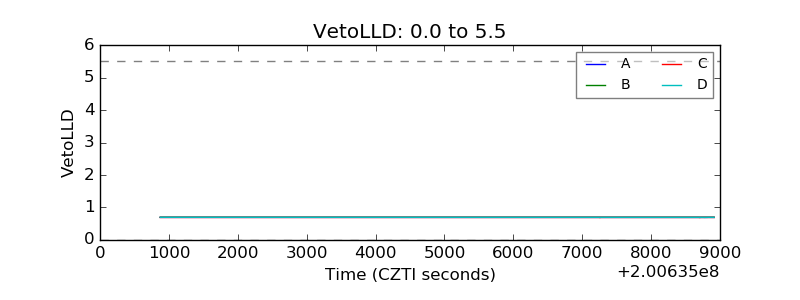 |
| Alpha Counter | 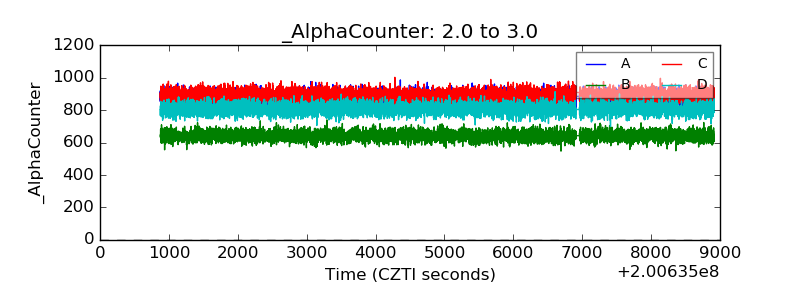 |
| _CPM_Rate | 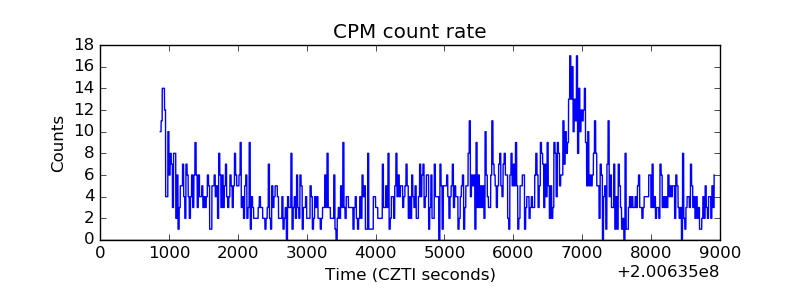 |
| CZT Counter | 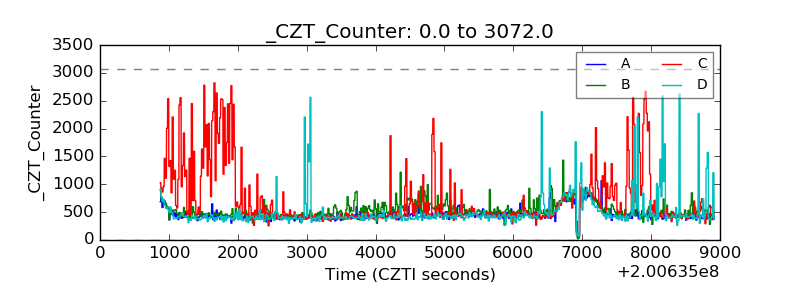 |
| +2.5 Volts monitor | 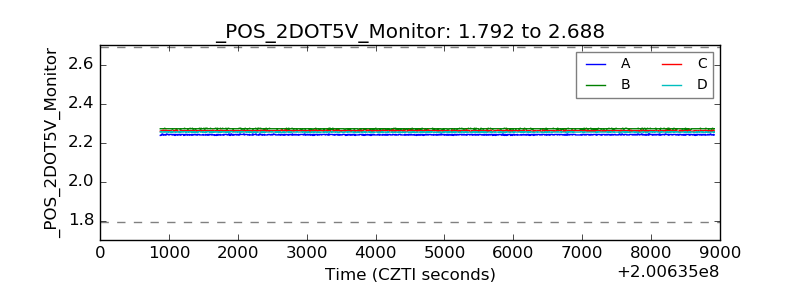 |
| +5 Volts monitor | 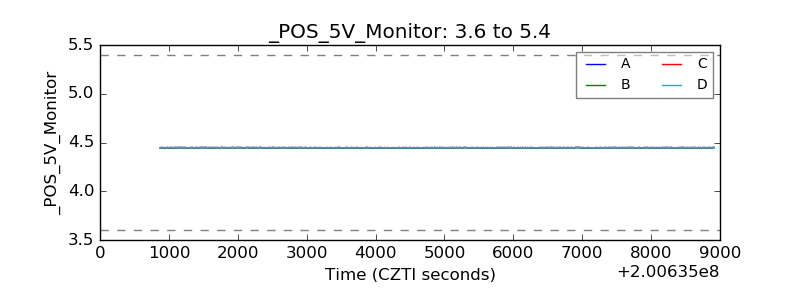 |
| _ROLL_ROT | 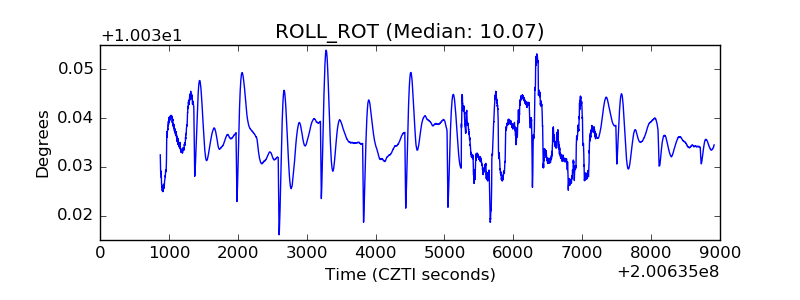 |
| _Roll_DEC | 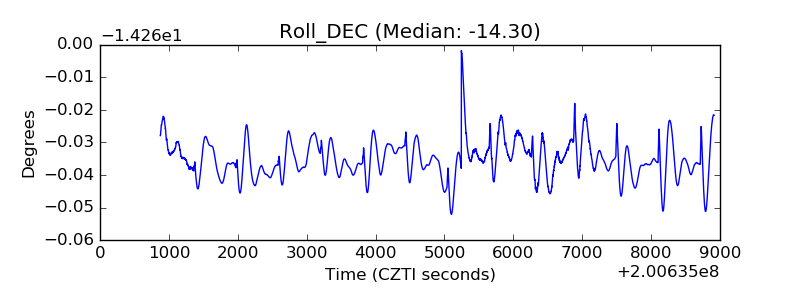 |
| _Roll_RA | 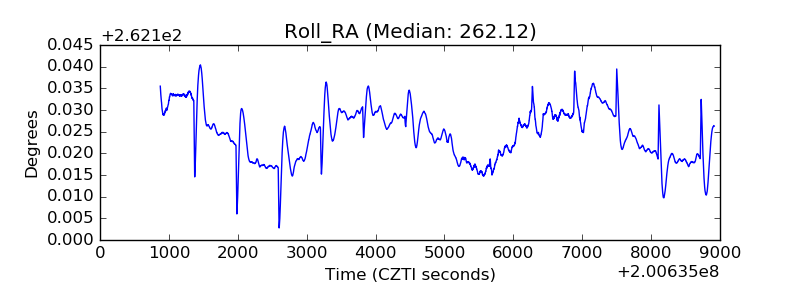 |
| Veto Counter | 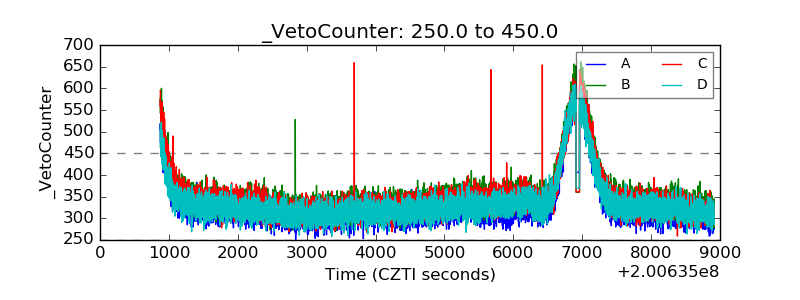 |