| Param | Original file | Final file |
|---|---|---|
| Filename | modeM0/AS1G05_246T01_9000000450_03348cztM0_level2.evt | modeM0/AS1G05_246T01_9000000450_03348cztM0_level2_quad_clean.evt |
| Size (bytes) | 530,233,920 | 74,937,600 |
| Size | 505.7 MB | 71.5 MB |
| Events in quadrant A | 3,402,439 | 439,420 |
| Events in quadrant B | 4,115,899 | 450,929 |
| Events in quadrant C | 4,290,425 | 440,143 |
| Events in quadrant D | 3,751,880 | 428,296 |
| Mode M0 | |||
|---|---|---|---|
| Quadrant | BADHDUFLAG | Total packets | Discarded packets |
| A | 0 | 15373 | 1 |
| B | 0 | 16845 | 0 |
| C | 0 | 17816 | 0 |
| D | 0 | 16687 | 0 |
| Mode SS | |||
|---|---|---|---|
| Quadrant | BADHDUFLAG | Total packets | Discarded packets |
| A | 0 | 146 | 0 |
| B | 0 | 146 | 0 |
| C | 0 | 146 | 0 |
| D | 0 | 146 | 0 |
| Quadrant | Total seconds | Saturated seconds | Saturation percentage |
|---|---|---|---|
| A | 7326 | 263 | 3.589954% |
| B | 7326 | 240 | 3.276003% |
| C | 7326 | 346 | 4.722905% |
| D | 7326 | 258 | 3.521704% |
Noise dominated data is calculated using 1-second bins in cleaned event files. If a bin has >2000 counts, and if more than 50% of those come from <1% of pixels, then it is considered to be noise-dominated and hence unusable.
| Quadrant | # 1 sec bins | Bins with >0 counts | Bins with >2000 counts | High rate bins dominated by noise | Noise dominated (total time) | Noise dominated (detector-on time) | Marked lightcurve |
|---|---|---|---|---|---|---|---|
| A | 7326 | 7326 | 5 | 5 | 0.07% | 0.07% | 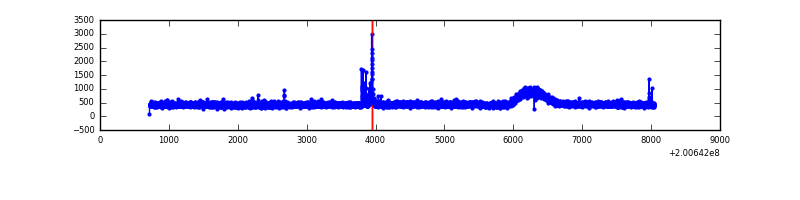 |
| B | 7326 | 7326 | 1 | 1 | 0.01% | 0.01% | 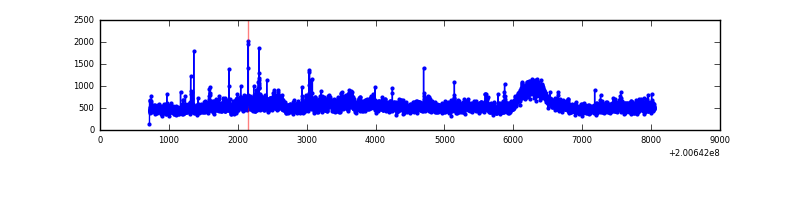 |
| C | 7326 | 7326 | 153 | 153 | 2.09% | 2.09% | 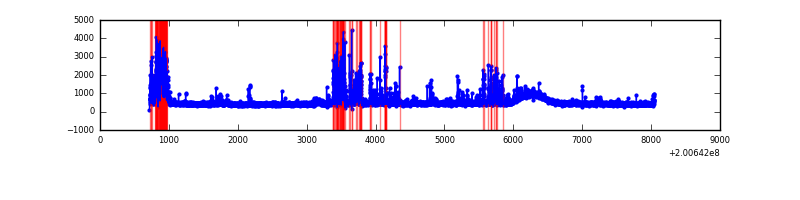 |
| D | 7326 | 7326 | 83 | 83 | 1.13% | 1.13% | 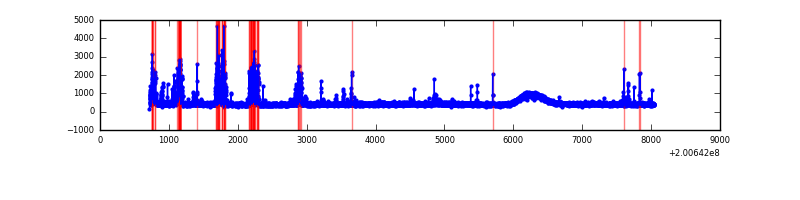 |
Top three noisy pixels from each quadrant. If the there are fewer than three noisy pixels in the level2.evt file, extra rows are filled as -1
| Pixel properties | Quadrant properties | ||||||
|---|---|---|---|---|---|---|---|
| Quadrant | DetID | PixID | Counts | Sigma | Mean | Median | Sigma |
| A | 0 | 50 | 49258 | 268.21 | 866 | 844 | 180.5 |
| A | 0 | 118 | 10297 | 52.37 | 866 | 844 | 180.5 |
| A | 0 | 226 | 9689 | 49.0 | 866 | 844 | 180.5 |
| B | 15 | 204 | 514572 | 2936.03 | 876 | 853 | 175.0 |
| B | 14 | 167 | 89795 | 508.33 | 876 | 853 | 175.0 |
| B | 3 | 0 | 66799 | 376.9 | 876 | 853 | 175.0 |
| C | 14 | 223 | 673964 | 3401.44 | 838 | 839 | 197.9 |
| C | 5 | 250 | 159043 | 799.44 | 838 | 839 | 197.9 |
| C | 1 | 16 | 93698 | 469.24 | 838 | 839 | 197.9 |
| D | 13 | 223 | 539593 | 2600.2 | 843 | 817 | 207.2 |
| D | 5 | 233 | 12504 | 56.4 | 843 | 817 | 207.2 |
| D | 13 | 239 | 12432 | 56.06 | 843 | 817 | 207.2 |
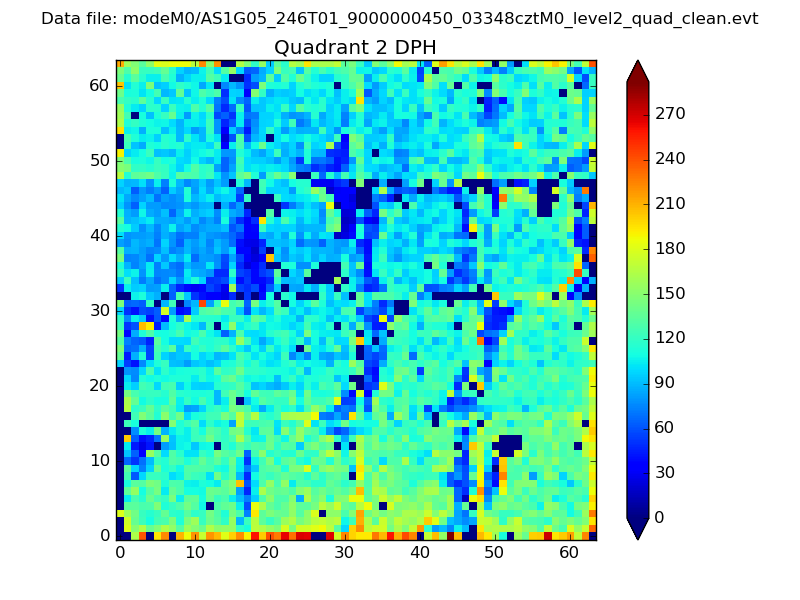
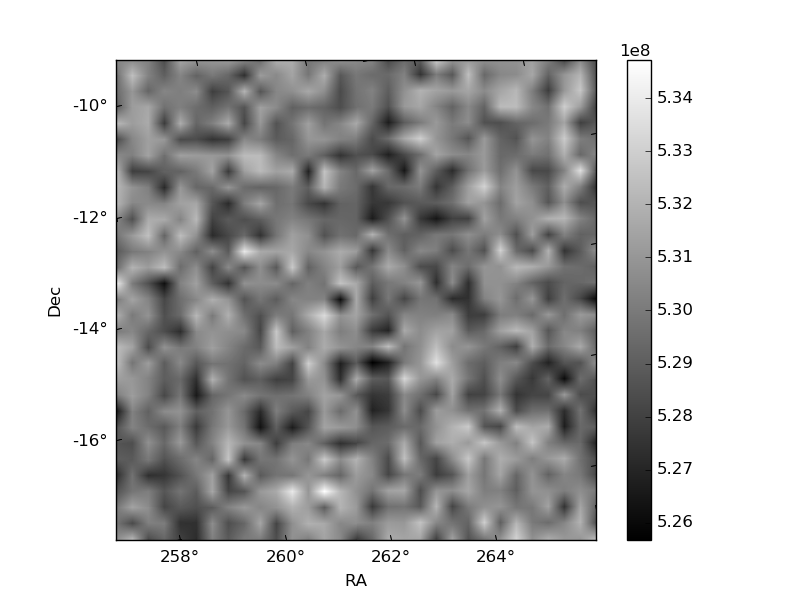
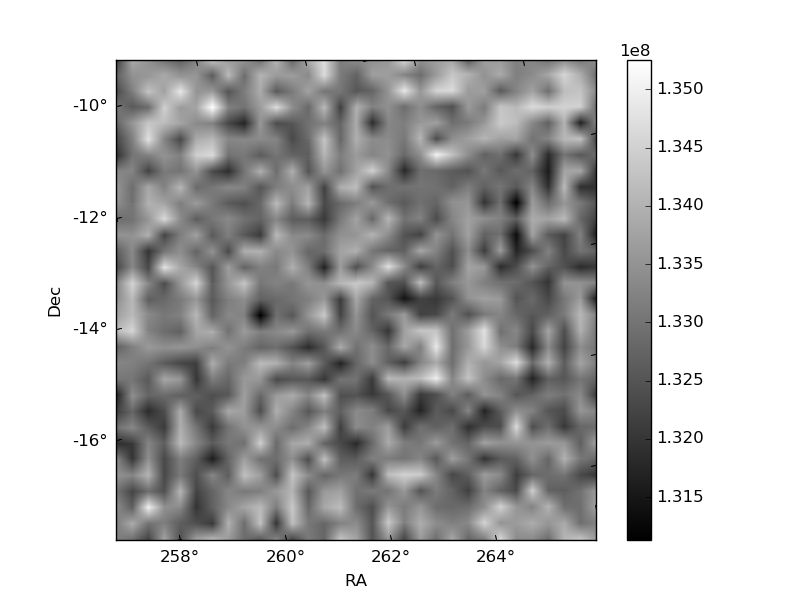
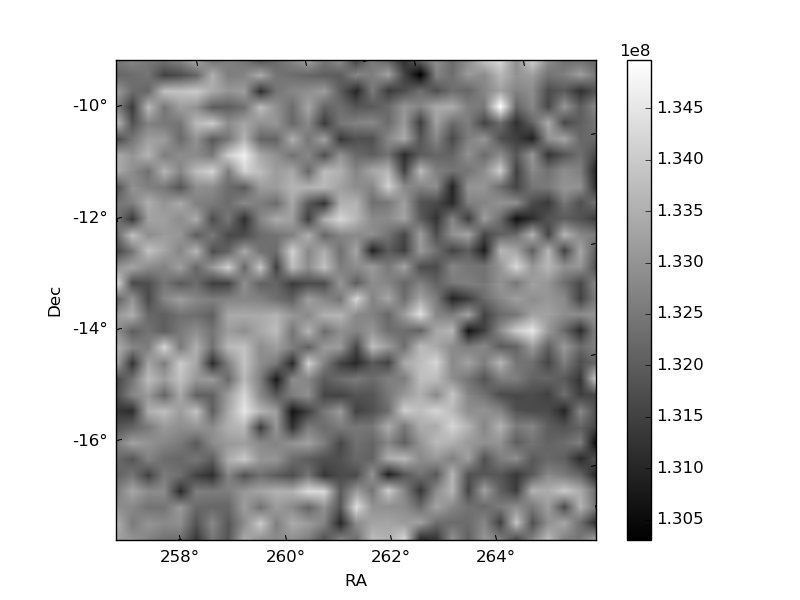
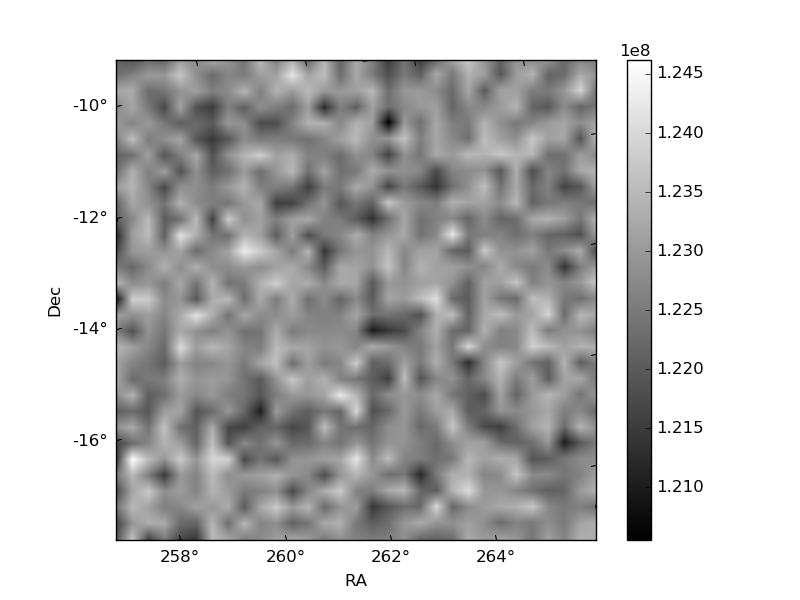
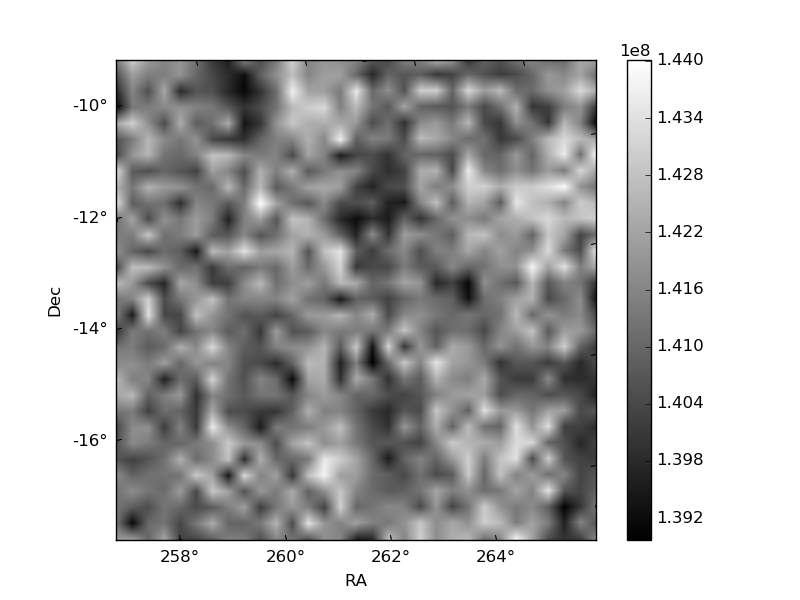
Histogram calculated using DETX and DETY for each event in the final _common_clean file
| Quadrant A | 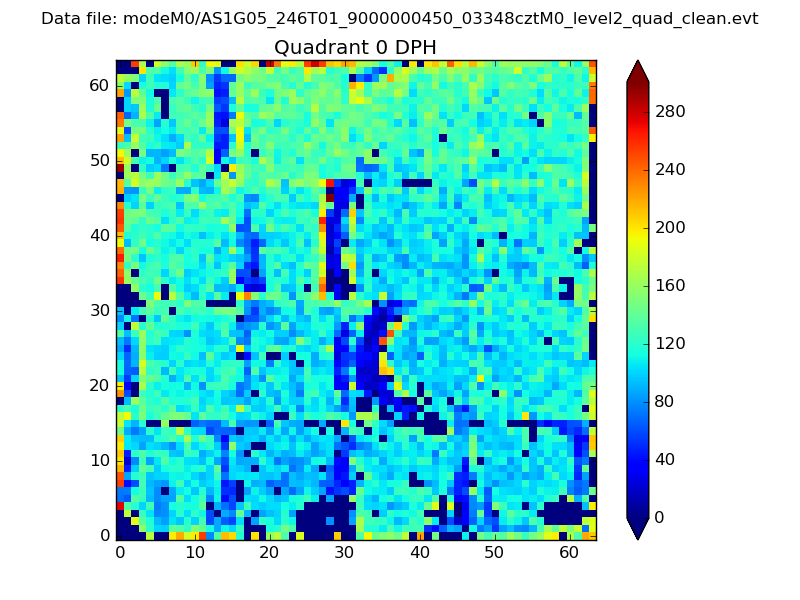 |
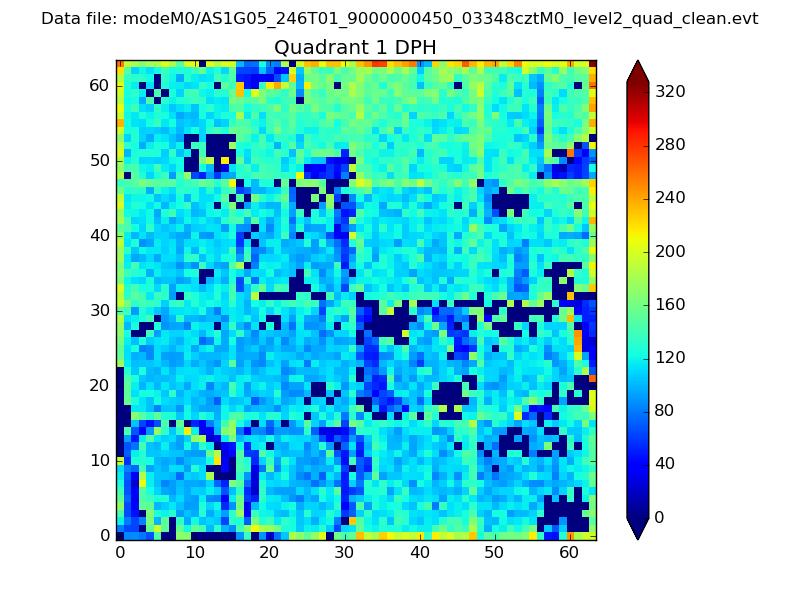 |
Quadrant B |
|---|---|---|---|
| Quadrant D | 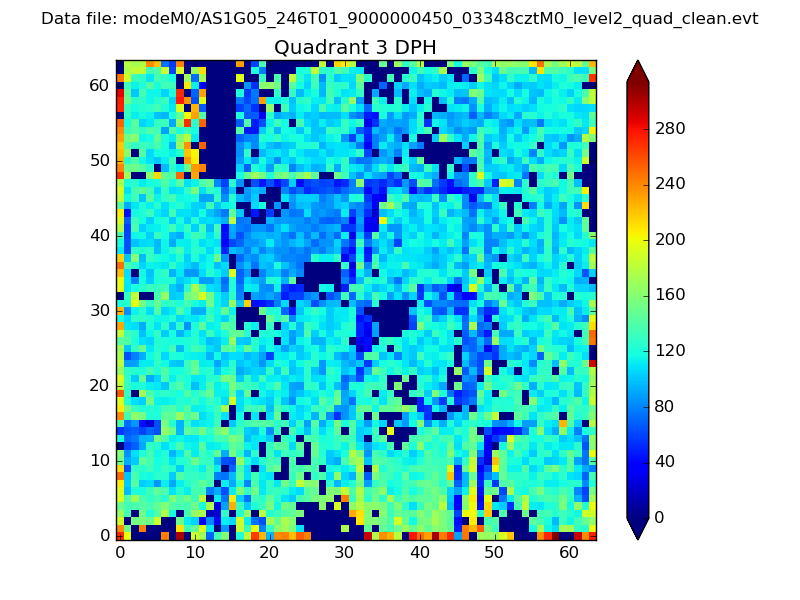 |
 |
Quadrant C |
| Plot type | Count rate plots | Images |
|---|---|---|
| Comparison with Poisson distribution Blue bars denote a histogram of data divided into 1 sec bins. Red curve is a Poisson curve with rate = median count rate of data. |
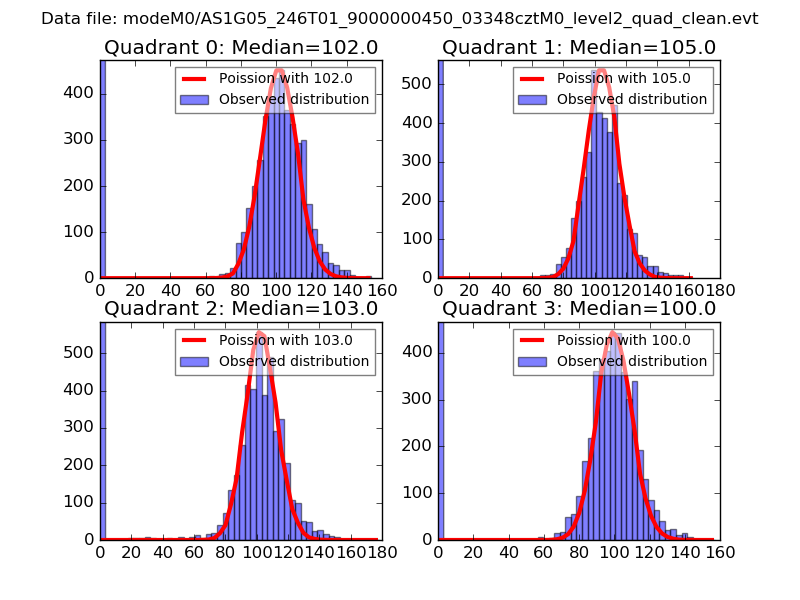 |
 |
| Quadrant-wise count rates Data is divided into 100 sec bins |
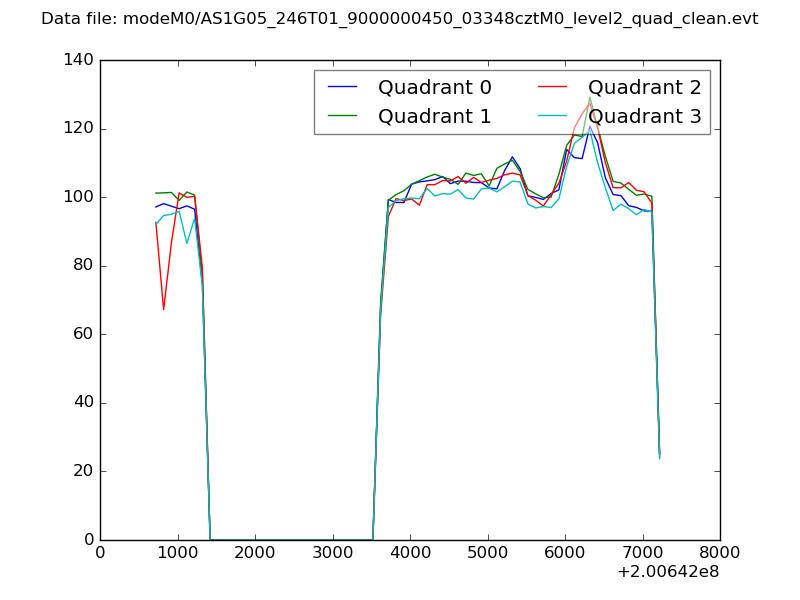 |
|
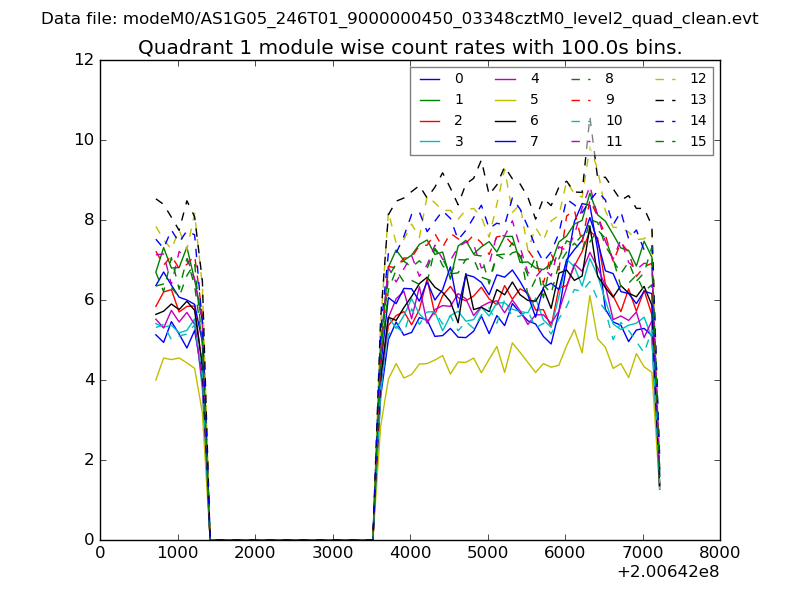
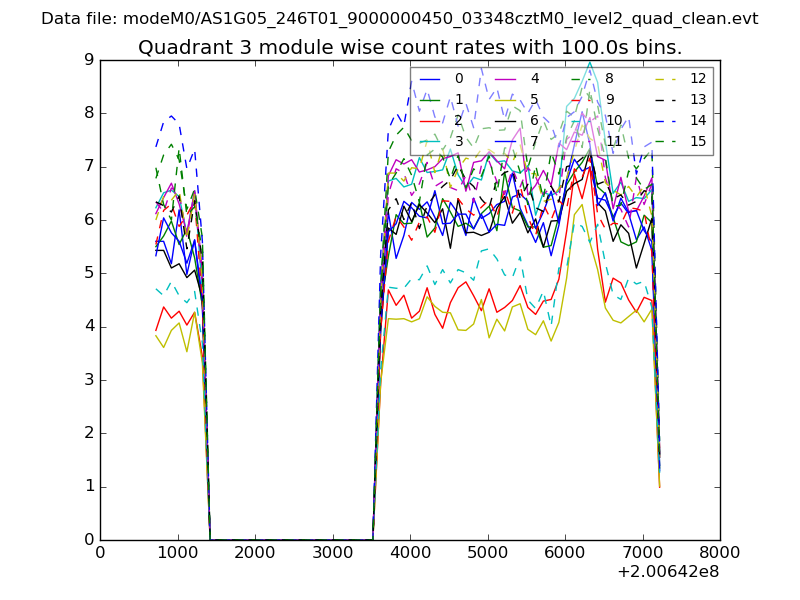
| Module-wise count rates for Quadrant A Data is divided into 100 sec bins |
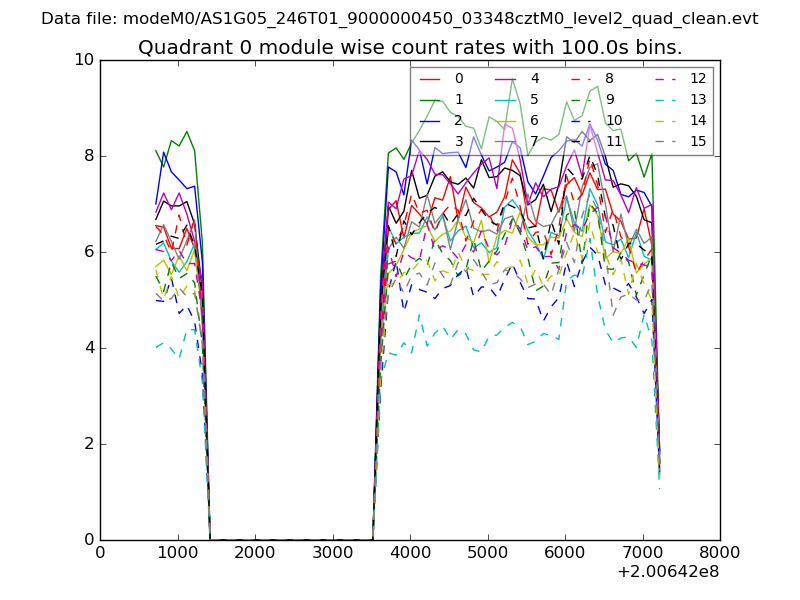 |
 |
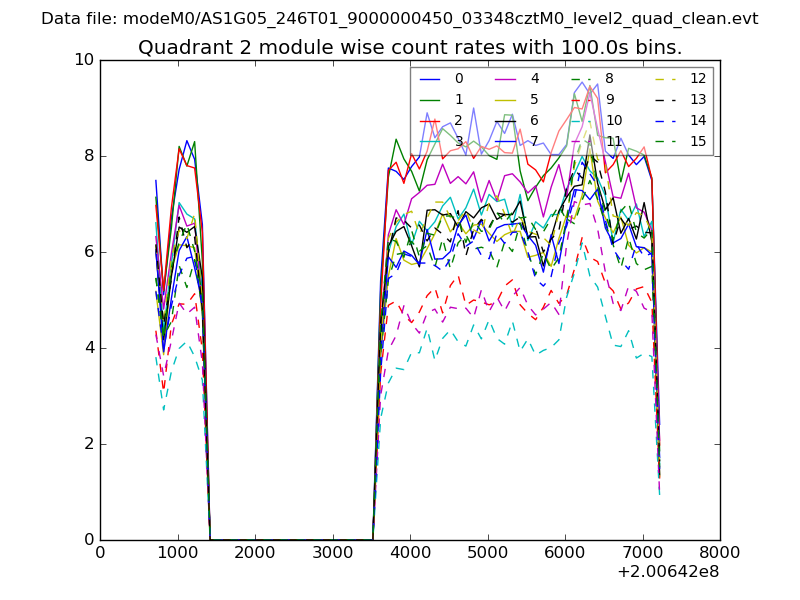
| Module-wise count rates for Quadrant B Data is divided into 100 sec bins |
 |
 |
| Module-wise count rates for Quadrant C Data is divided into 100 sec bins |
 |
 |
| Module-wise count rates for Quadrant D Data is divided into 100 sec bins |
 |
 |
| Parameter | Plot |
|---|---|
| CZT HV Monitor | 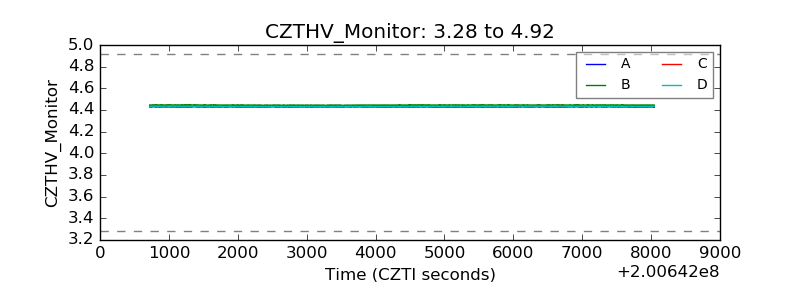 |
| D_VDD | 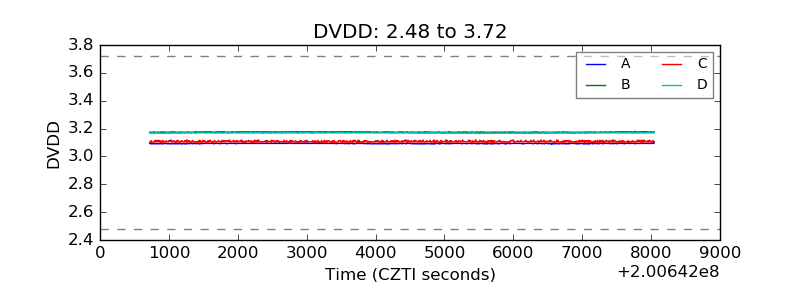 |
| Temperature 1 | 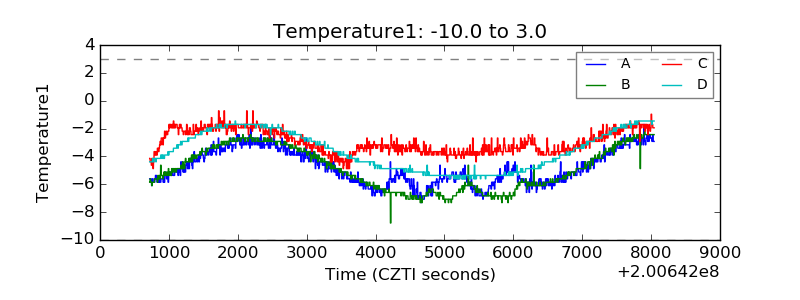 |
| Veto HV Monitor | 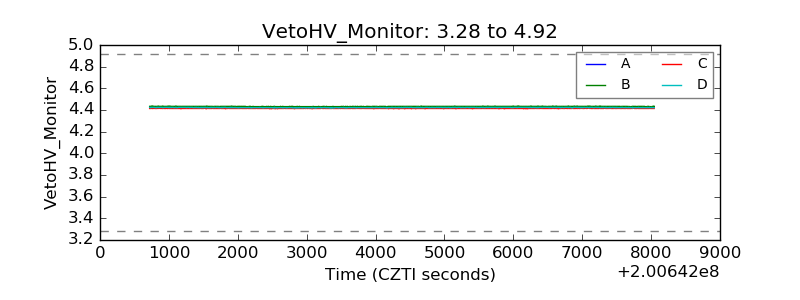 |
| Veto LLD | 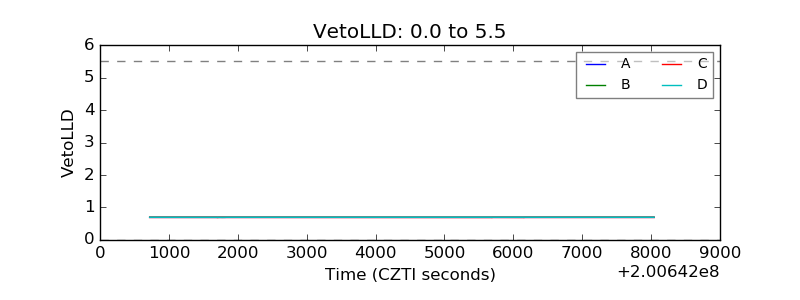 |
| Alpha Counter | 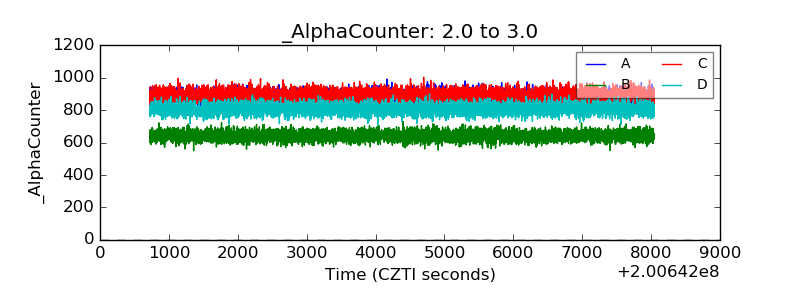 |
| _CPM_Rate | 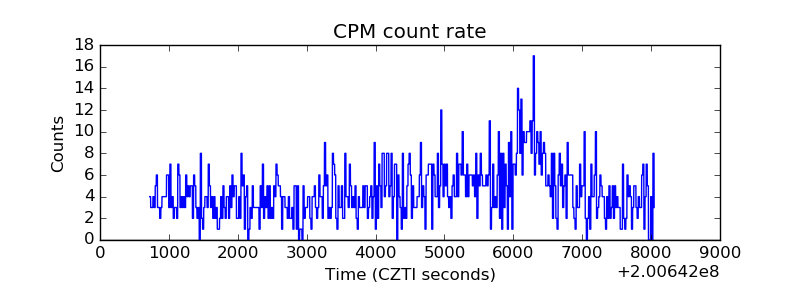 |
| CZT Counter | 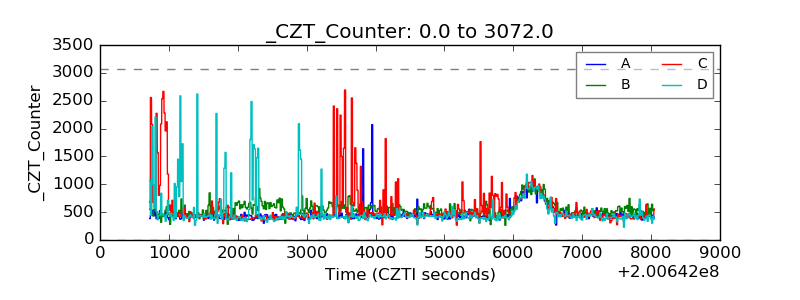 |
| +2.5 Volts monitor |  |
| +5 Volts monitor |  |
| _ROLL_ROT | 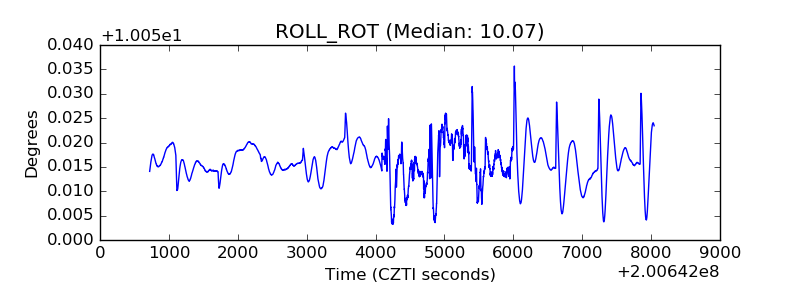 |
| _Roll_DEC | 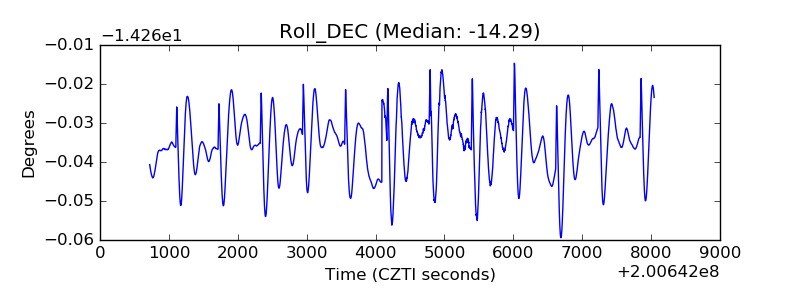 |
| _Roll_RA | 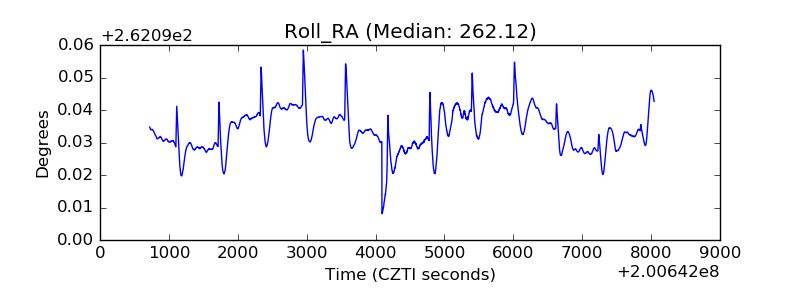 |
| Veto Counter | 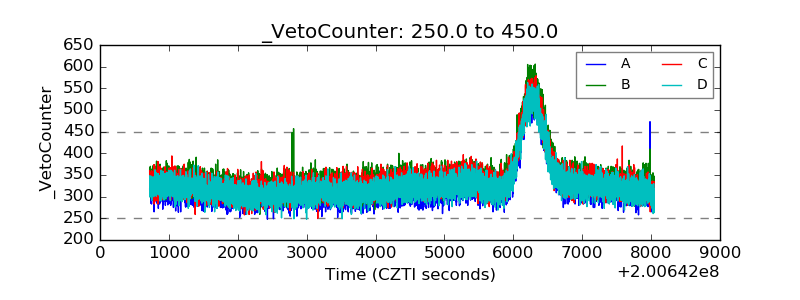 |