| Param | Original file | Final file |
|---|---|---|
| Filename | modeM0/AS1G05_246T01_9000000450_03349cztM0_level2.evt | modeM0/AS1G05_246T01_9000000450_03349cztM0_level2_quad_clean.evt |
| Size (bytes) | 1,511,052,480 | 202,708,800 |
| Size | 1.4 GB | 193.3 MB |
| Events in quadrant A | 9,818,878 | 1,168,900 |
| Events in quadrant B | 11,802,951 | 1,194,982 |
| Events in quadrant C | 12,485,888 | 1,161,067 |
| Events in quadrant D | 10,208,330 | 1,140,167 |
| Mode M0 | |||
|---|---|---|---|
| Quadrant | BADHDUFLAG | Total packets | Discarded packets |
| A | 0 | 44473 | 4 |
| B | 0 | 48699 | 3 |
| C | 0 | 51987 | 3 |
| D | 0 | 46630 | 6 |
| Mode SS | |||
|---|---|---|---|
| Quadrant | BADHDUFLAG | Total packets | Discarded packets |
| A | 0 | 434 | 0 |
| B | 0 | 434 | 0 |
| C | 0 | 434 | 0 |
| D | 0 | 434 | 0 |
| Mode M9 | |||
|---|---|---|---|
| Quadrant | BADHDUFLAG | Total packets | Discarded packets |
| A | 0 | 9 | 0 |
| B | 0 | 9 | 0 |
| C | 0 | 9 | 0 |
| D | 0 | 9 | 0 |
| Quadrant | Total seconds | Saturated seconds | Saturation percentage |
|---|---|---|---|
| A | 21378 | 734 | 3.433436% |
| B | 21378 | 753 | 3.522313% |
| C | 21378 | 1125 | 5.262419% |
| D | 21377 | 731 | 3.419563% |
Noise dominated data is calculated using 1-second bins in cleaned event files. If a bin has >2000 counts, and if more than 50% of those come from <1% of pixels, then it is considered to be noise-dominated and hence unusable.
| Quadrant | # 1 sec bins | Bins with >0 counts | Bins with >2000 counts | High rate bins dominated by noise | Noise dominated (total time) | Noise dominated (detector-on time) | Marked lightcurve |
|---|---|---|---|---|---|---|---|
| A | 25101 | 21382 | 4 | 4 | 0.02% | 0.02% | 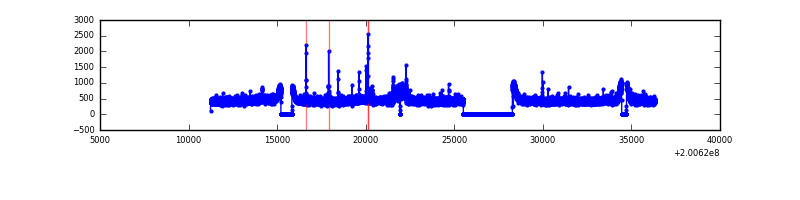 |
| B | 25101 | 21382 | 39 | 39 | 0.16% | 0.18% | 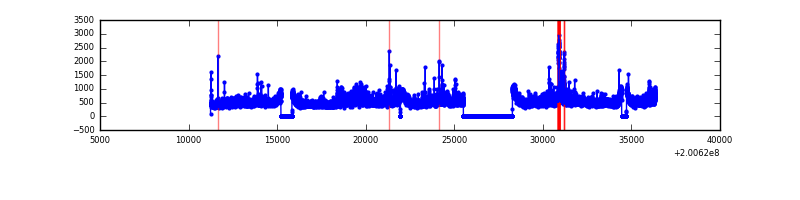 |
| C | 25101 | 21382 | 485 | 485 | 1.93% | 2.27% | 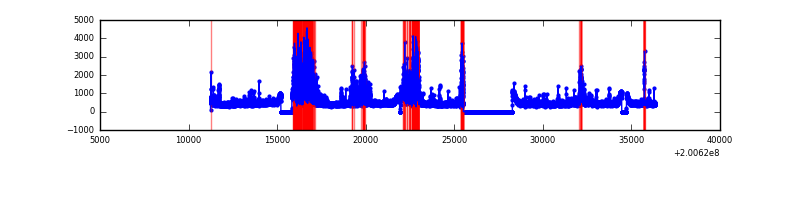 |
| D | 25101 | 21381 | 134 | 134 | 0.53% | 0.63% | 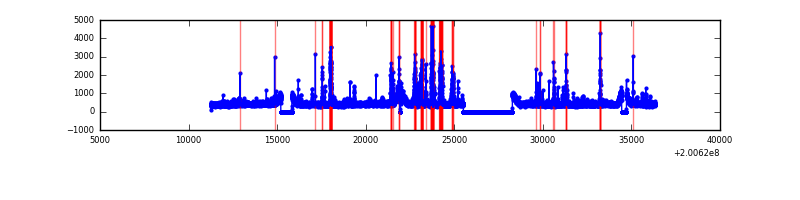 |
Top three noisy pixels from each quadrant. If the there are fewer than three noisy pixels in the level2.evt file, extra rows are filled as -1
| Pixel properties | Quadrant properties | ||||||
|---|---|---|---|---|---|---|---|
| Quadrant | DetID | PixID | Counts | Sigma | Mean | Median | Sigma |
| A | 14 | 249 | 53885 | 99.63 | 2517 | 2458 | 516.2 |
| A | 0 | 50 | 41796 | 76.21 | 2517 | 2458 | 516.2 |
| A | 0 | 226 | 27750 | 49.0 | 2517 | 2458 | 516.2 |
| B | 15 | 204 | 1343248 | 2695.82 | 2547 | 2482 | 497.3 |
| B | 14 | 167 | 196091 | 389.28 | 2547 | 2482 | 497.3 |
| B | 0 | 229 | 178469 | 353.85 | 2547 | 2482 | 497.3 |
| C | 8 | 208 | 1752987 | 3073.39 | 2435 | 2448 | 569.6 |
| C | 14 | 223 | 734053 | 1284.46 | 2435 | 2448 | 569.6 |
| C | 9 | 54 | 162758 | 281.45 | 2435 | 2448 | 569.6 |
| D | 13 | 223 | 826010 | 1381.2 | 2454 | 2376 | 596.3 |
| D | 4 | 160 | 42544 | 67.36 | 2454 | 2376 | 596.3 |
| D | 2 | 206 | 31993 | 49.67 | 2454 | 2376 | 596.3 |
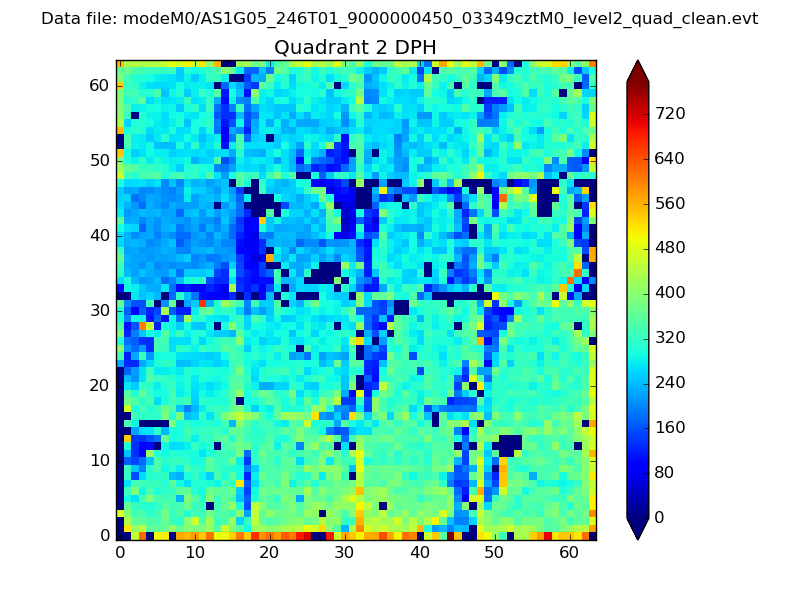
Histogram calculated using DETX and DETY for each event in the final _common_clean file
| Quadrant A | 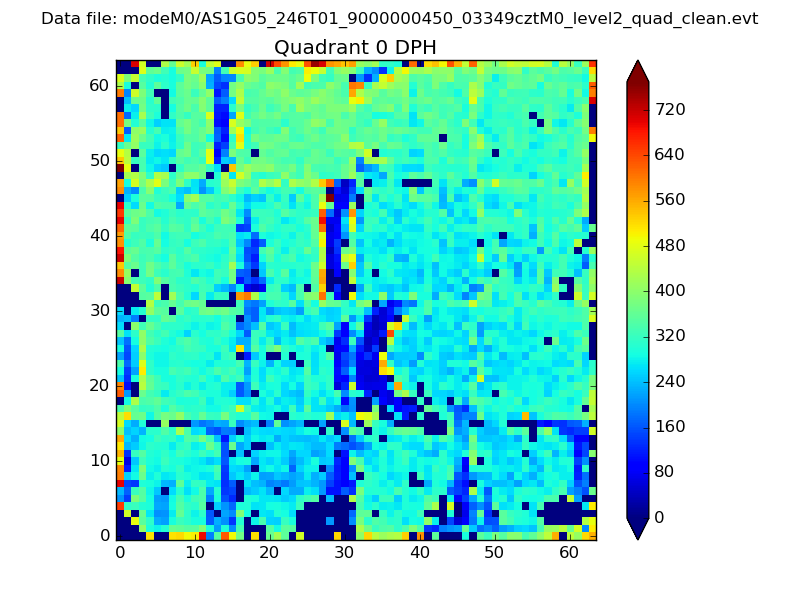 |
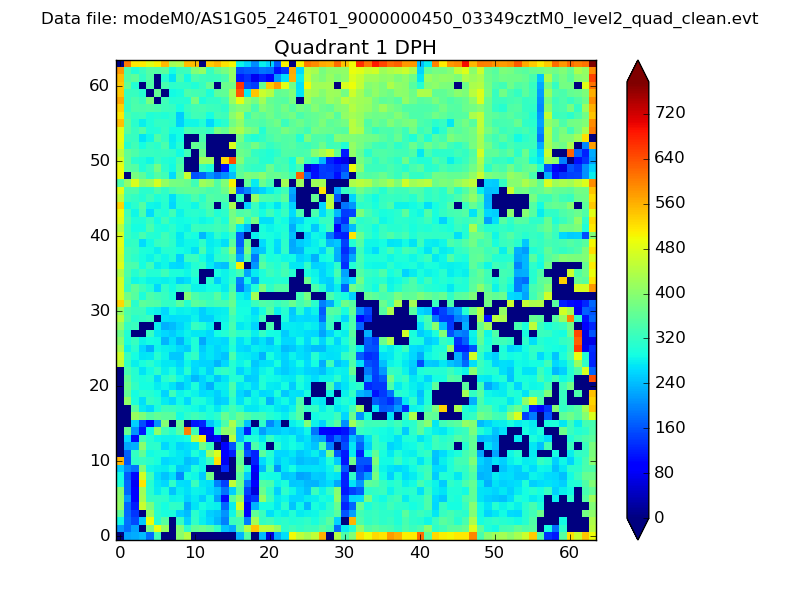 |
Quadrant B |
|---|---|---|---|
| Quadrant D | 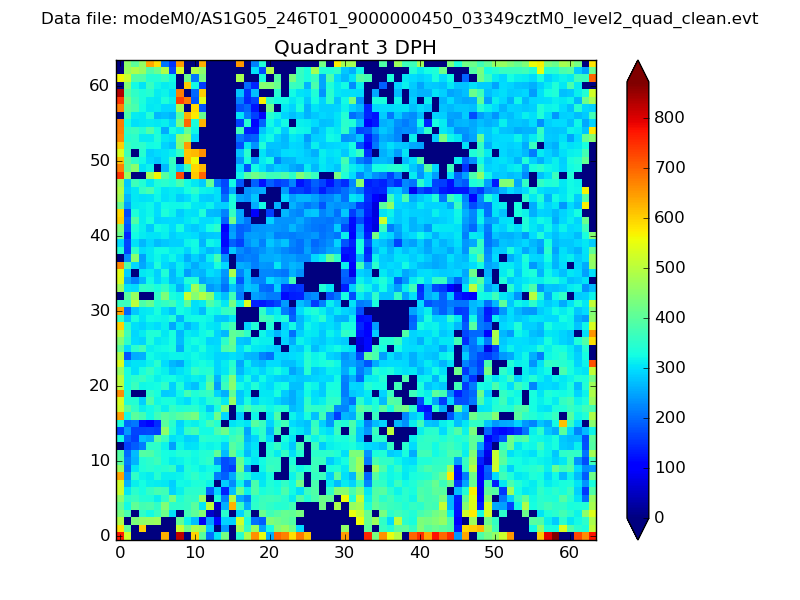 |
 |
Quadrant C |
| Plot type | Count rate plots | Images |
|---|---|---|
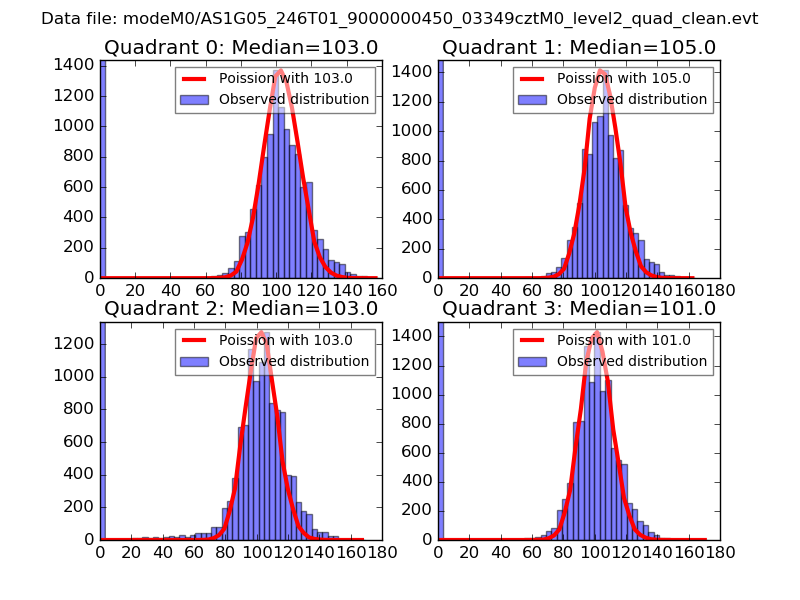
| Comparison with Poisson distribution Blue bars denote a histogram of data divided into 1 sec bins. Red curve is a Poisson curve with rate = median count rate of data. |
 |
 |
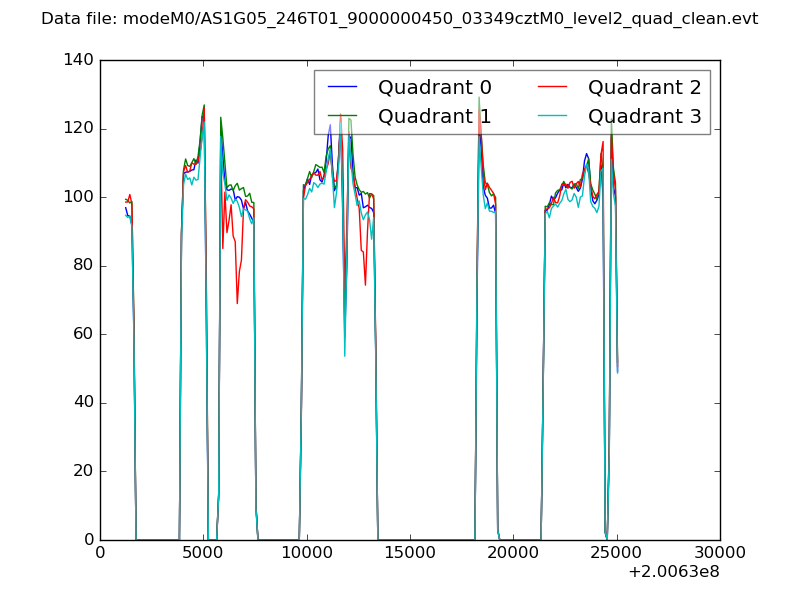
| Quadrant-wise count rates Data is divided into 100 sec bins |
 |
|
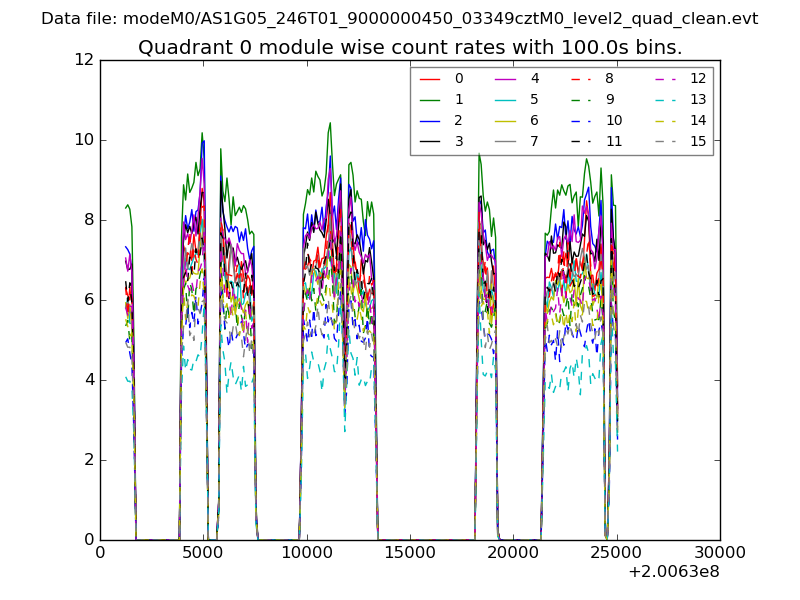
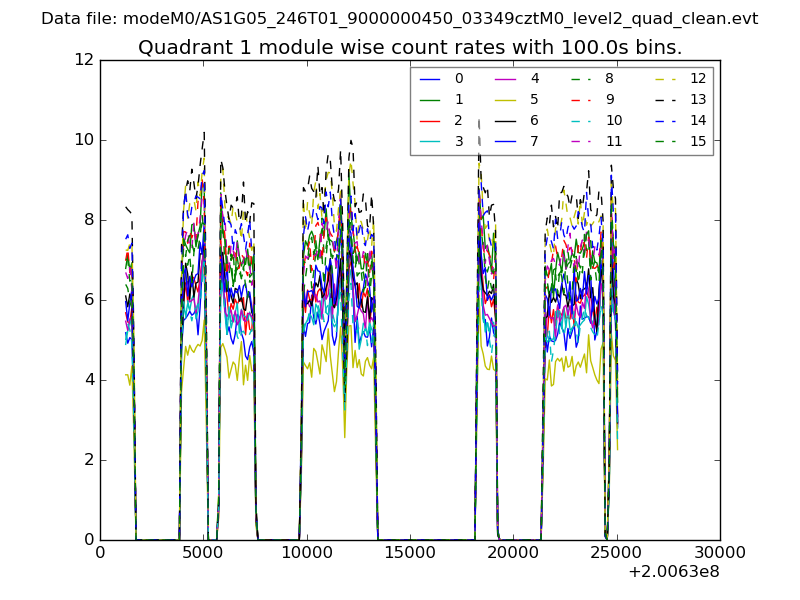
| Module-wise count rates for Quadrant A Data is divided into 100 sec bins |
 |
 |
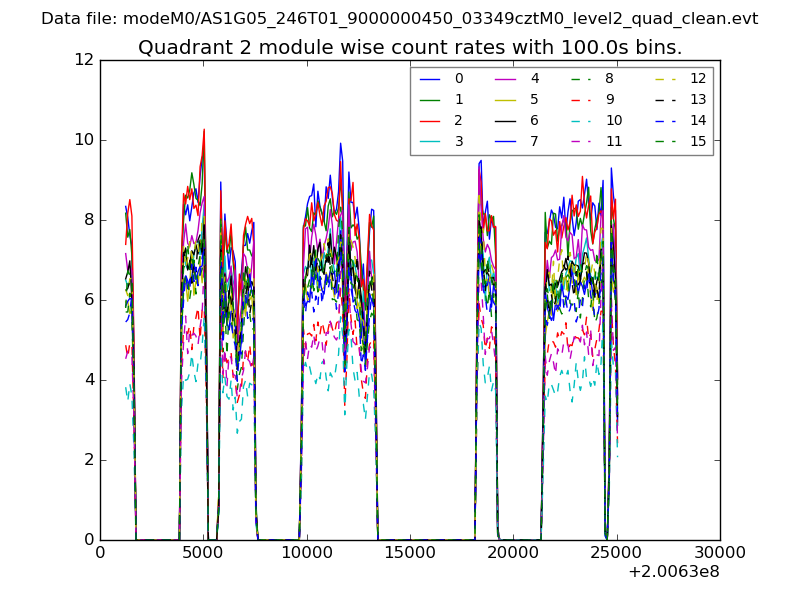
| Module-wise count rates for Quadrant B Data is divided into 100 sec bins |
 |
 |
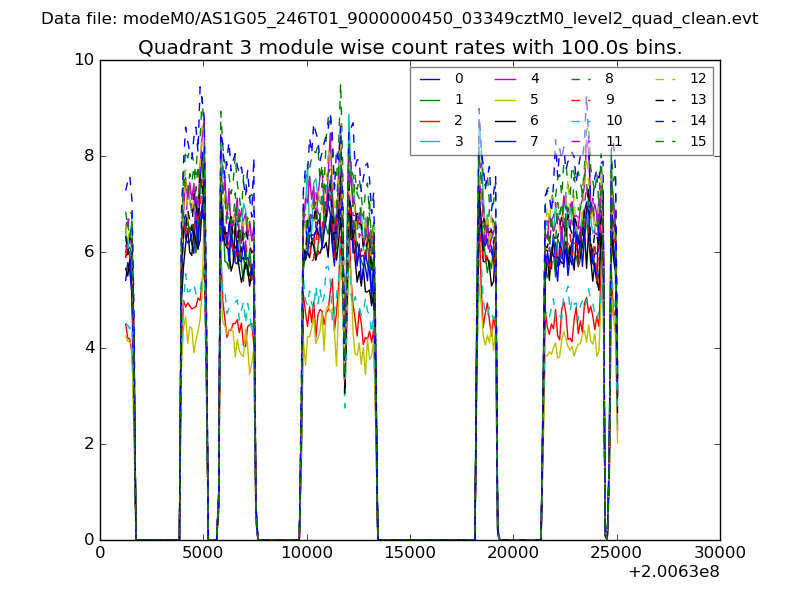
| Module-wise count rates for Quadrant C Data is divided into 100 sec bins |
 |
 |
| Module-wise count rates for Quadrant D Data is divided into 100 sec bins |
 |
 |
| Parameter | Plot |
|---|---|
| CZT HV Monitor | 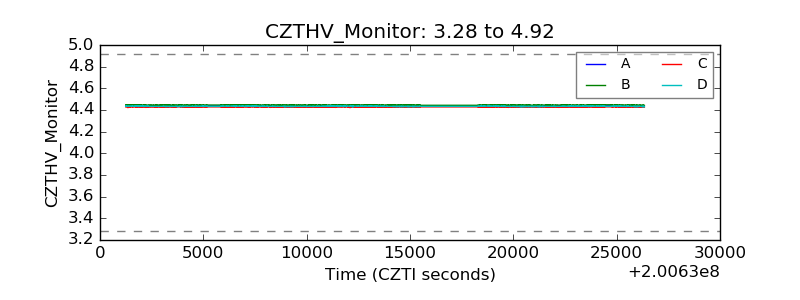 |
| D_VDD | 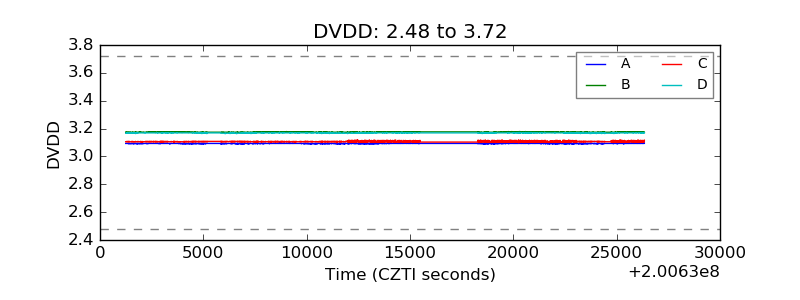 |
| Temperature 1 | 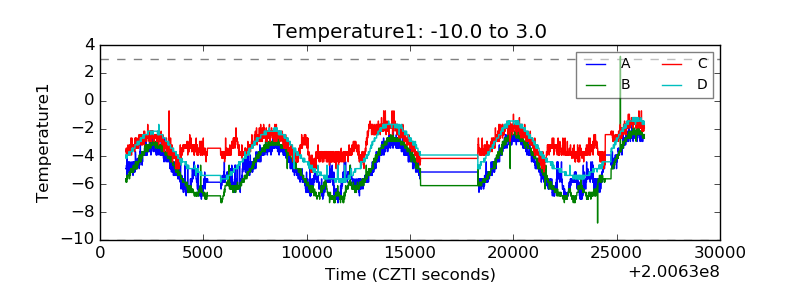 |
| Veto HV Monitor | 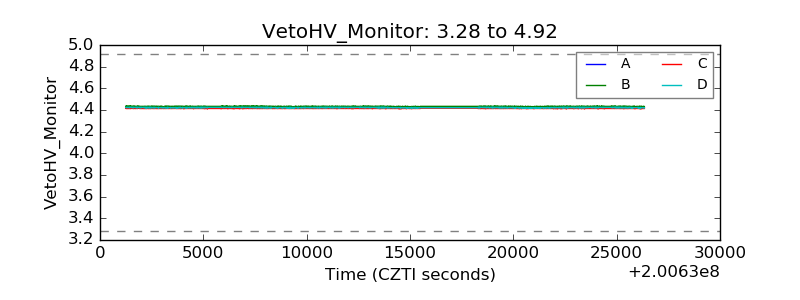 |
| Veto LLD | 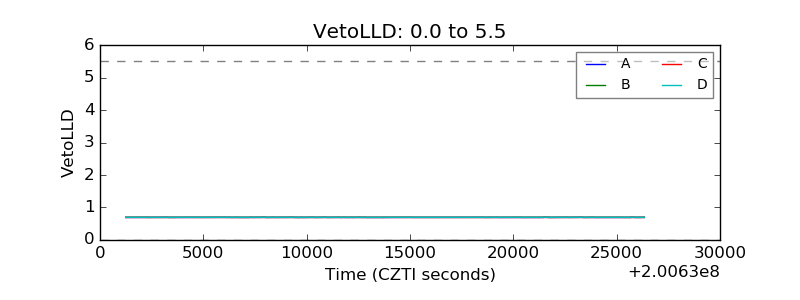 |
| Alpha Counter | 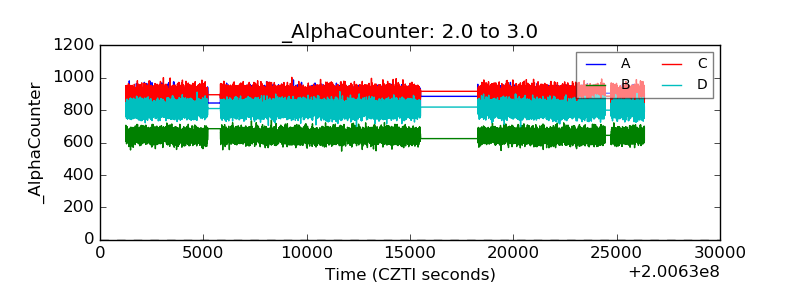 |
| _CPM_Rate | 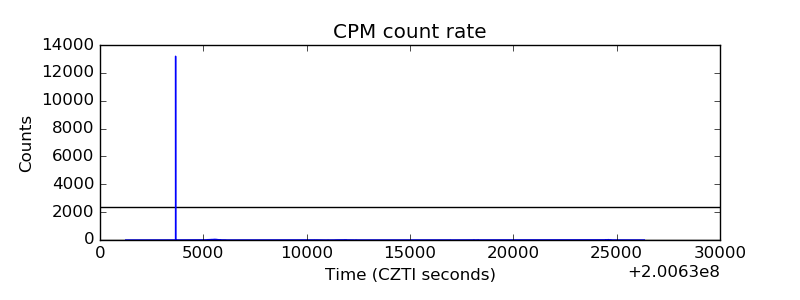 |
| CZT Counter | 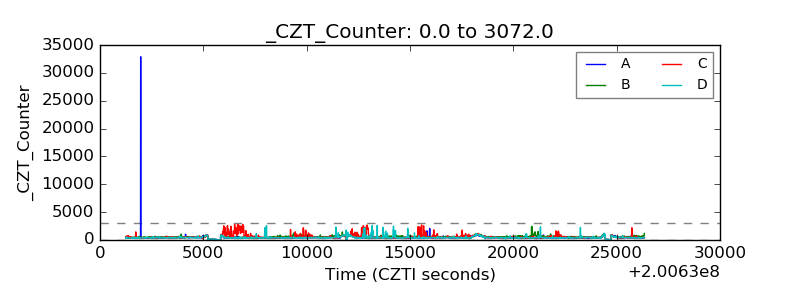 |
| +2.5 Volts monitor | 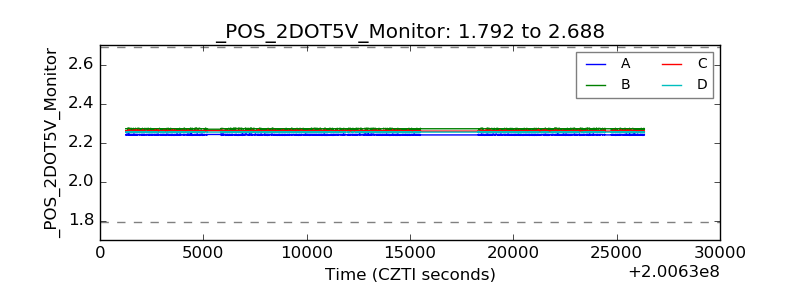 |
| +5 Volts monitor | 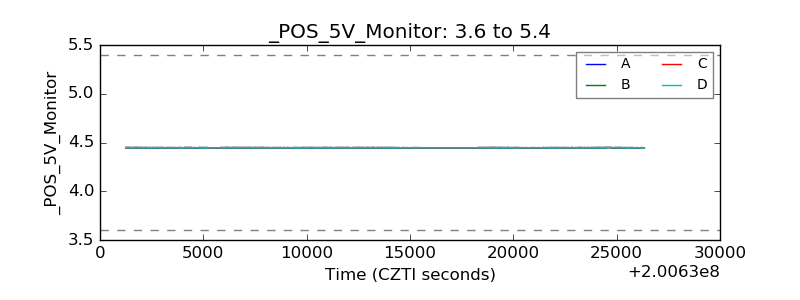 |
| _ROLL_ROT | 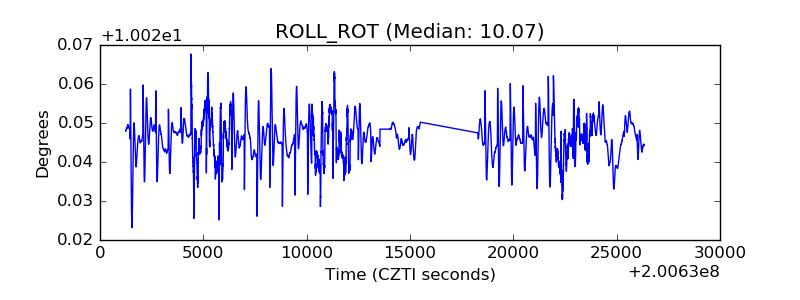 |
| _Roll_DEC | 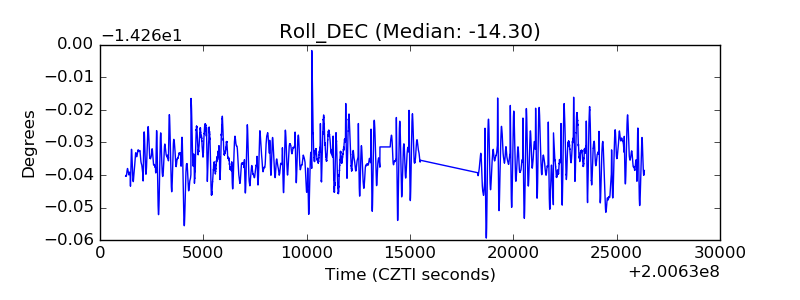 |
| _Roll_RA | 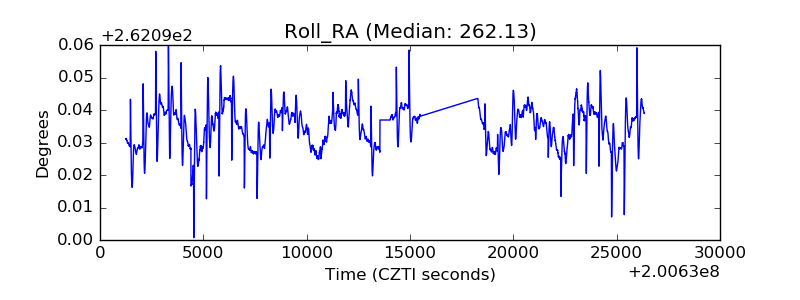 |
| Veto Counter | 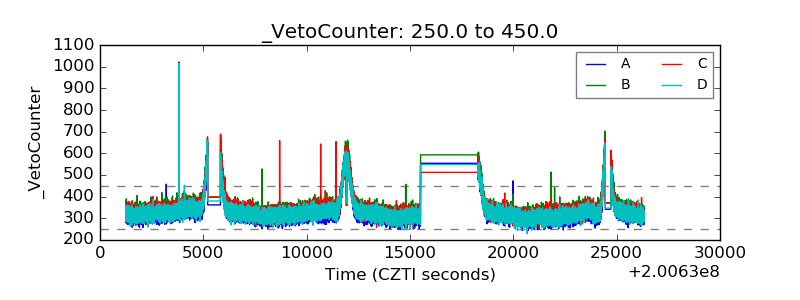 |