| Param | Original file | Final file |
|---|---|---|
| Filename | modeM0/AS1G05_112T01_9000000452_03352cztM0_level2.evt | modeM0/AS1G05_112T01_9000000452_03352cztM0_level2_quad_clean.evt |
| Size (bytes) | 551,741,760 | 81,768,960 |
| Size | 526.2 MB | 78.0 MB |
| Events in quadrant A | 3,670,927 | 493,923 |
| Events in quadrant B | 4,272,982 | 486,888 |
| Events in quadrant C | 4,301,747 | 475,535 |
| Events in quadrant D | 3,925,495 | 468,221 |
| Mode M9 | |||
|---|---|---|---|
| Quadrant | BADHDUFLAG | Total packets | Discarded packets |
| A | 0 | 15 | 0 |
| B | 0 | 15 | 0 |
| C | 0 | 15 | 0 |
| D | 0 | 15 | 0 |
| Mode SS | |||
|---|---|---|---|
| Quadrant | BADHDUFLAG | Total packets | Discarded packets |
| A | 0 | 162 | 0 |
| B | 0 | 162 | 0 |
| C | 0 | 162 | 0 |
| D | 0 | 162 | 0 |
| Mode M0 | |||
|---|---|---|---|
| Quadrant | BADHDUFLAG | Total packets | Discarded packets |
| A | 0 | 16374 | 3 |
| B | 0 | 17887 | 2 |
| C | 0 | 18141 | 2 |
| D | 0 | 17483 | 2 |
| Quadrant | Total seconds | Saturated seconds | Saturation percentage |
|---|---|---|---|
| A | 7933 | 118 | 1.487457% |
| B | 7933 | 127 | 1.600908% |
| C | 7933 | 211 | 2.659776% |
| D | 7933 | 153 | 1.928652% |
Noise dominated data is calculated using 1-second bins in cleaned event files. If a bin has >2000 counts, and if more than 50% of those come from <1% of pixels, then it is considered to be noise-dominated and hence unusable.
| Quadrant | # 1 sec bins | Bins with >0 counts | Bins with >2000 counts | High rate bins dominated by noise | Noise dominated (total time) | Noise dominated (detector-on time) | Marked lightcurve |
|---|---|---|---|---|---|---|---|
| A | 9458 | 7935 | 1 | 1 | 0.01% | 0.01% | 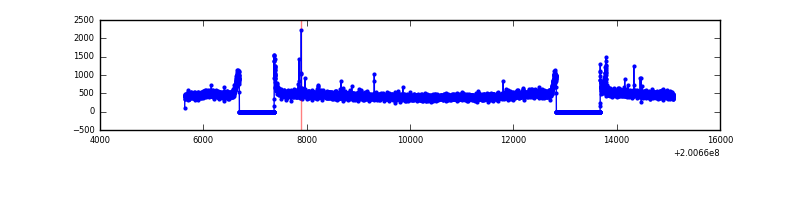 |
| B | 9458 | 7935 | 9 | 9 | 0.10% | 0.11% | 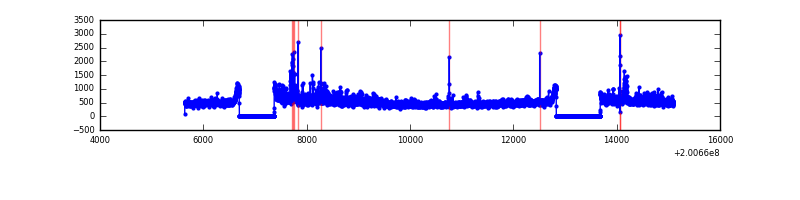 |
| C | 9458 | 7935 | 102 | 102 | 1.08% | 1.29% | 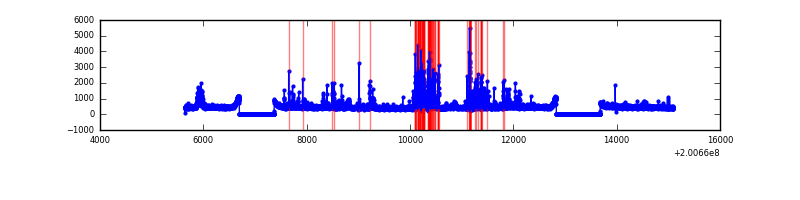 |
| D | 9458 | 7935 | 68 | 68 | 0.72% | 0.86% | 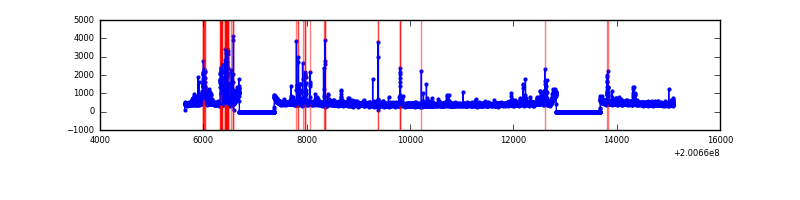 |
Top three noisy pixels from each quadrant. If the there are fewer than three noisy pixels in the level2.evt file, extra rows are filled as -1
| Pixel properties | Quadrant properties | ||||||
|---|---|---|---|---|---|---|---|
| Quadrant | DetID | PixID | Counts | Sigma | Mean | Median | Sigma |
| A | 11 | 11 | 21121 | 104.31 | 938 | 916 | 193.7 |
| A | 14 | 249 | 14457 | 69.91 | 938 | 916 | 193.7 |
| A | 15 | 174 | 13227 | 63.56 | 938 | 916 | 193.7 |
| B | 15 | 204 | 438550 | 2360.81 | 946 | 923 | 185.4 |
| B | 0 | 229 | 66846 | 355.63 | 946 | 923 | 185.4 |
| B | 14 | 167 | 43459 | 229.46 | 946 | 923 | 185.4 |
| C | 14 | 223 | 467777 | 2175.38 | 906 | 909 | 214.6 |
| C | 12 | 175 | 110539 | 510.82 | 906 | 909 | 214.6 |
| C | 6 | 80 | 107705 | 497.62 | 906 | 909 | 214.6 |
| D | 13 | 223 | 364278 | 1658.26 | 904 | 878 | 219.1 |
| D | 5 | 233 | 40332 | 180.04 | 904 | 878 | 219.1 |
| D | 14 | 34 | 28561 | 126.32 | 904 | 878 | 219.1 |
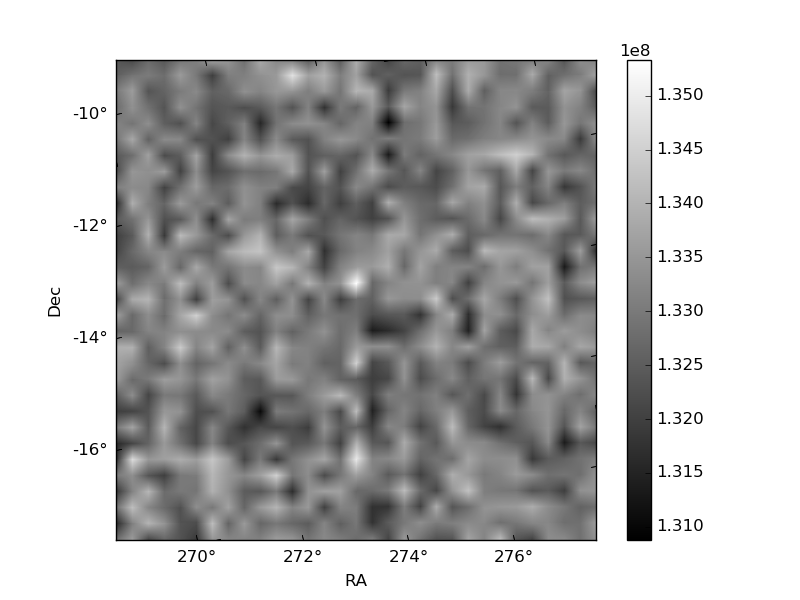
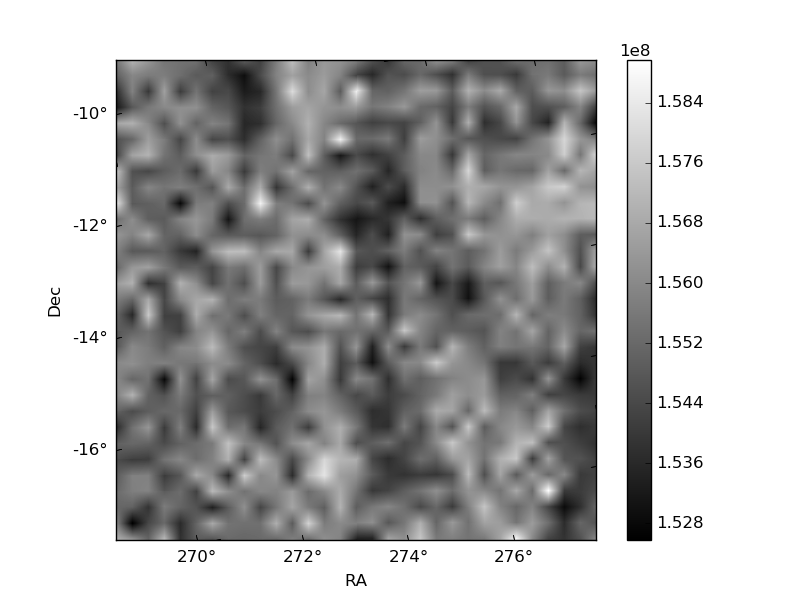
Histogram calculated using DETX and DETY for each event in the final _common_clean file
| Quadrant A | 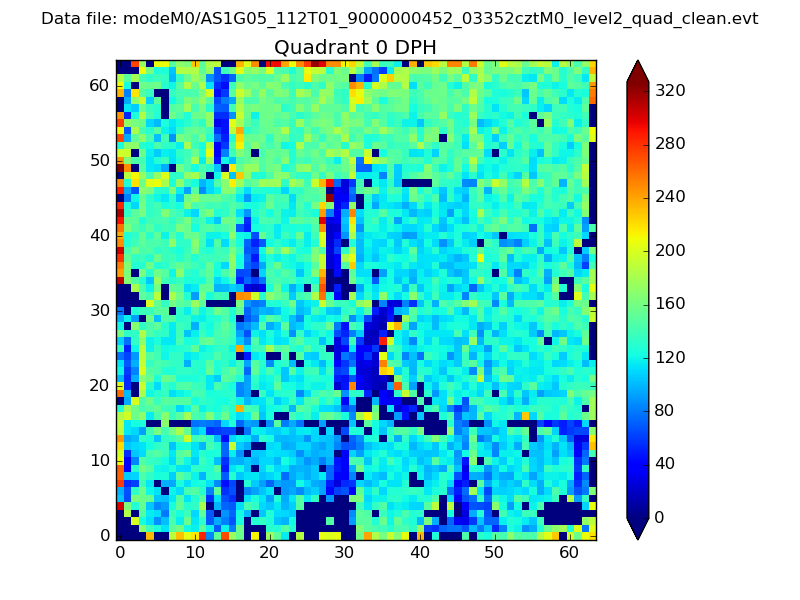 |
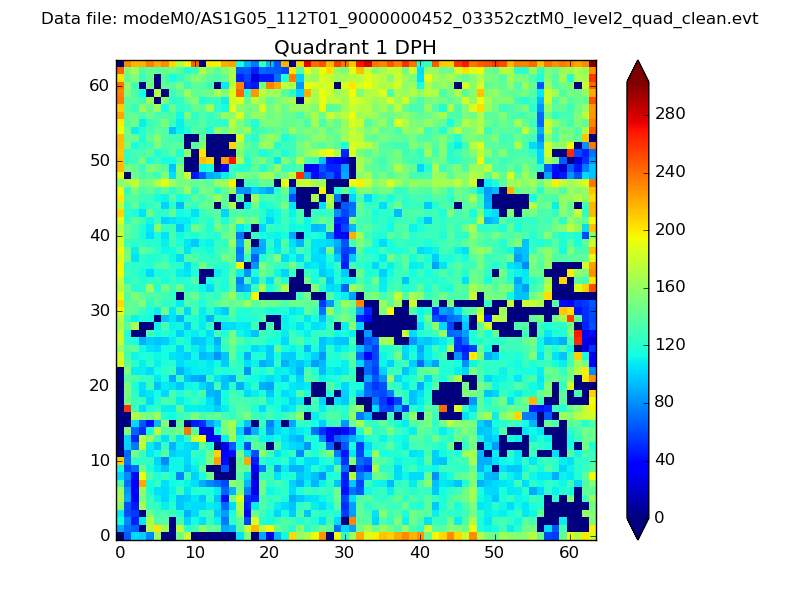 |
Quadrant B |
|---|---|---|---|
| Quadrant D |  |
 |
Quadrant C |
| Plot type | Count rate plots | Images |
|---|---|---|
| Comparison with Poisson distribution Blue bars denote a histogram of data divided into 1 sec bins. Red curve is a Poisson curve with rate = median count rate of data. |
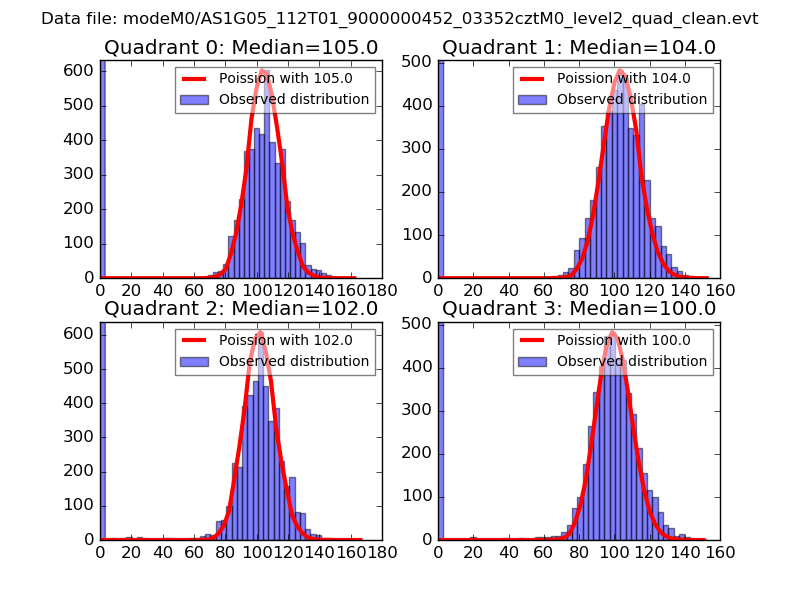 |
 |
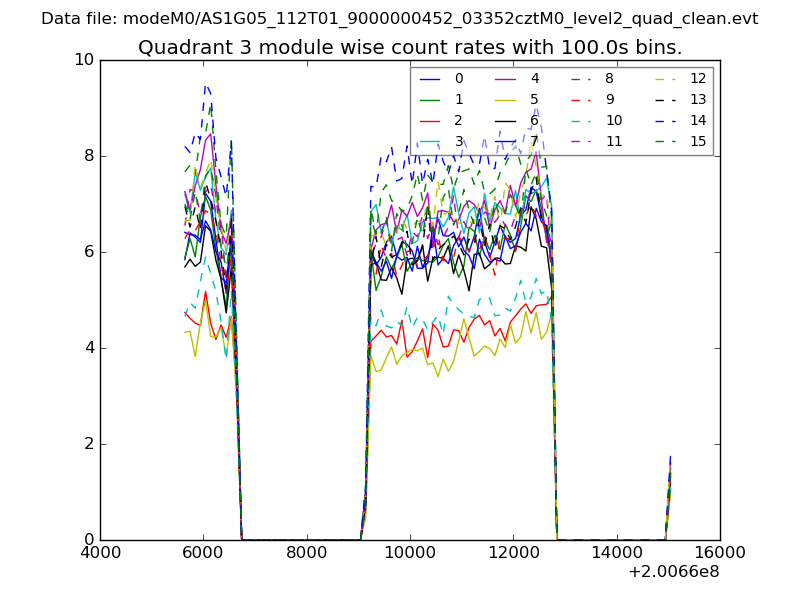
| Quadrant-wise count rates Data is divided into 100 sec bins |
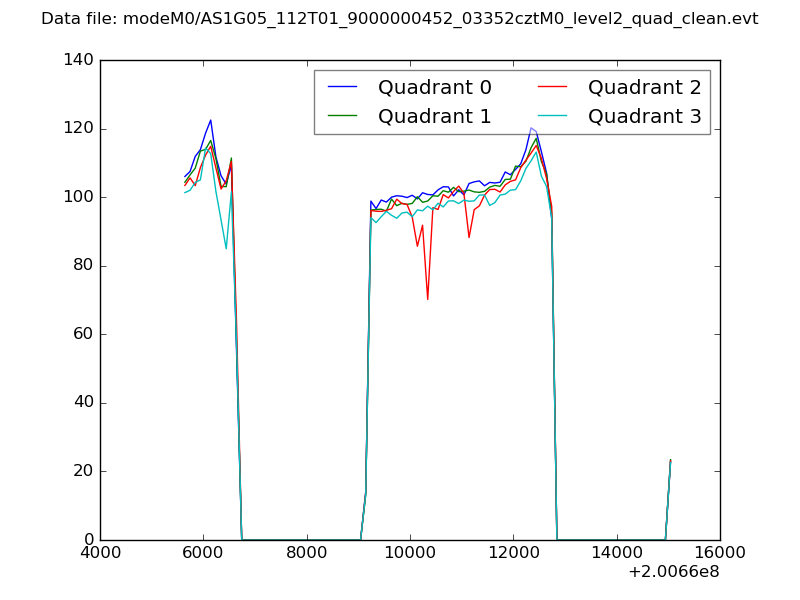 |
|
| Module-wise count rates for Quadrant A Data is divided into 100 sec bins |
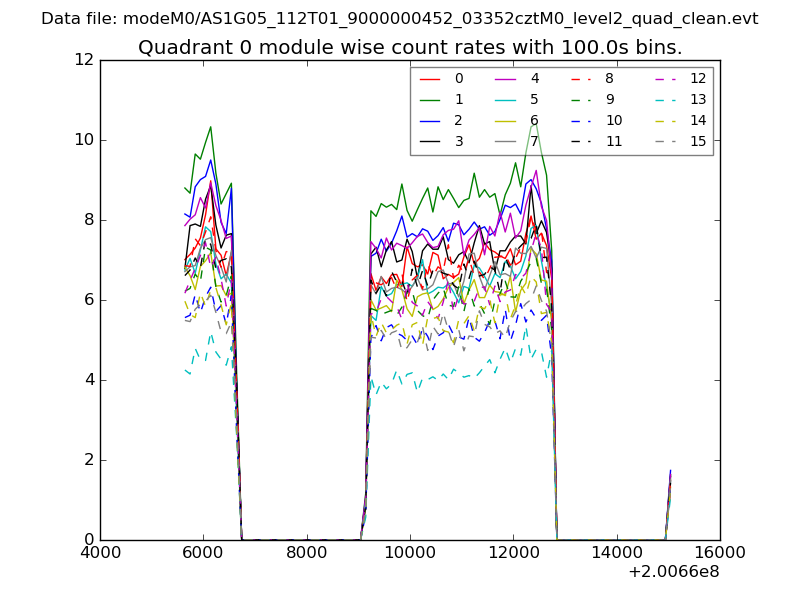 |
 |
| Module-wise count rates for Quadrant B Data is divided into 100 sec bins |
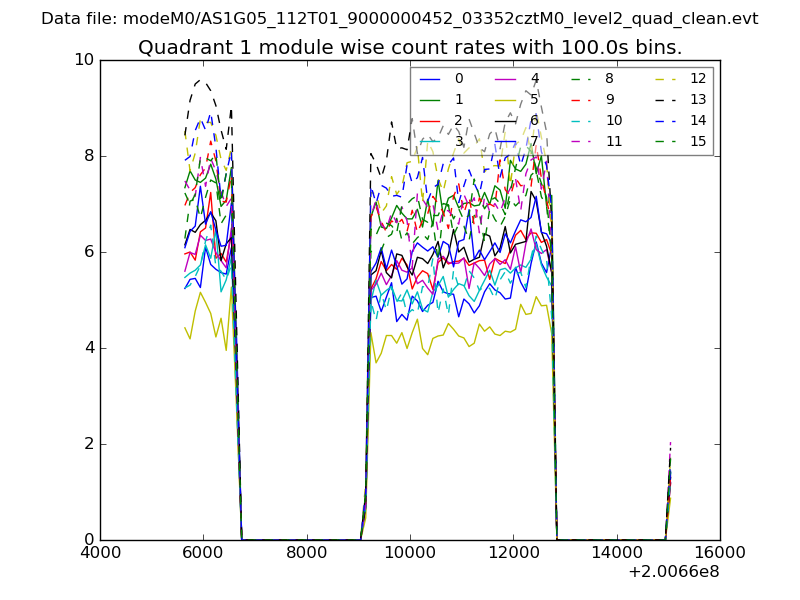 |
 |
| Module-wise count rates for Quadrant C Data is divided into 100 sec bins |
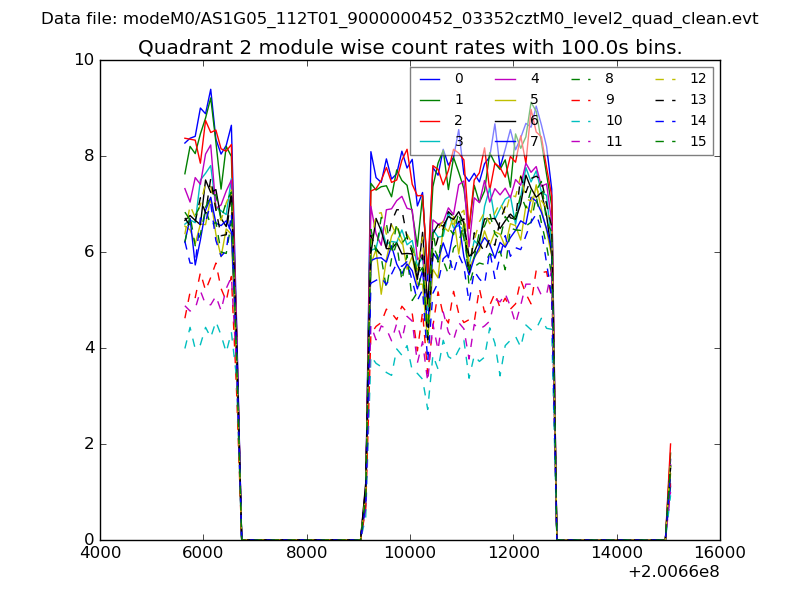 |
 |
| Module-wise count rates for Quadrant D Data is divided into 100 sec bins |
 |
 |
| Parameter | Plot |
|---|---|
| CZT HV Monitor | 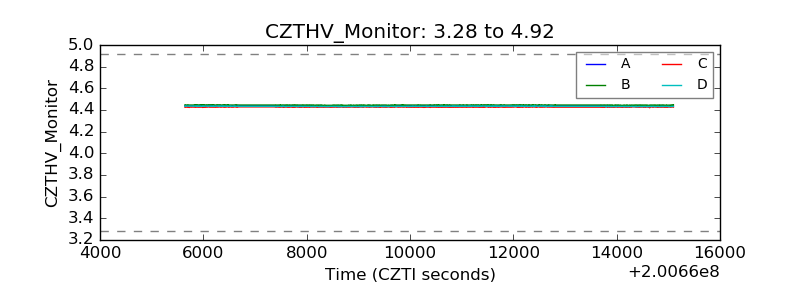 |
| D_VDD | 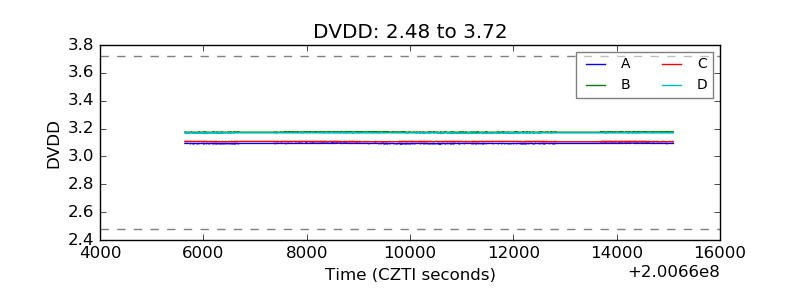 |
| Temperature 1 | 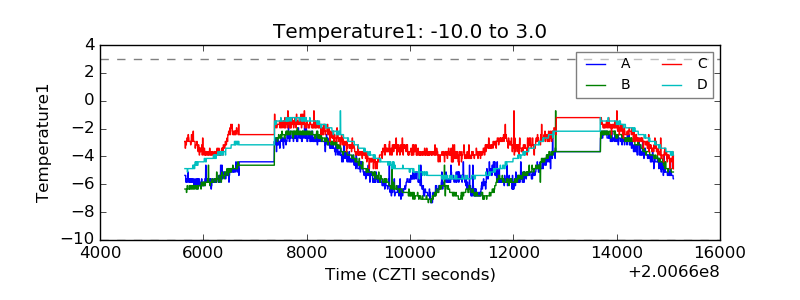 |
| Veto HV Monitor | 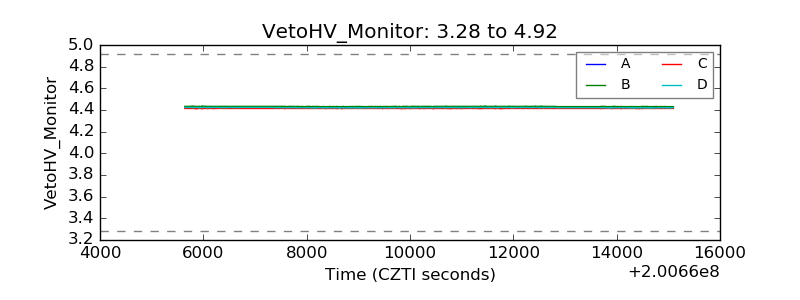 |
| Veto LLD | 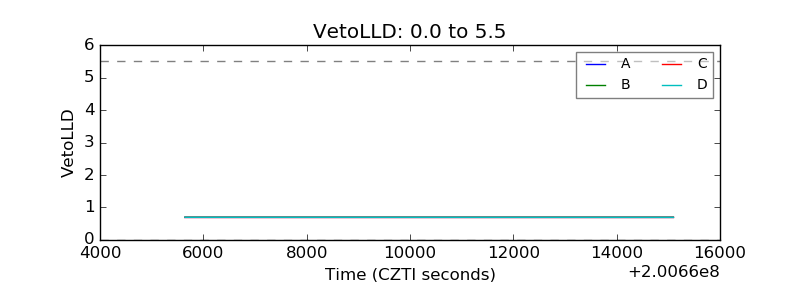 |
| Alpha Counter | 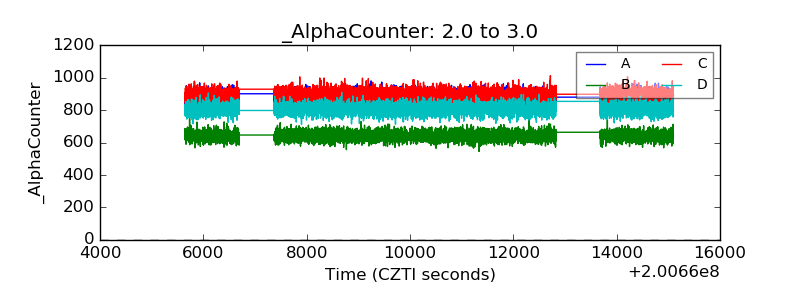 |
| _CPM_Rate | 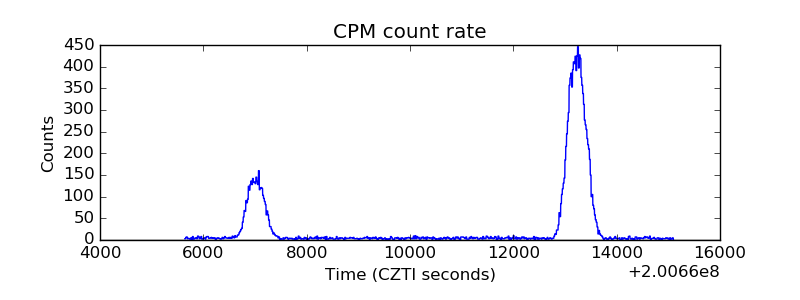 |
| CZT Counter |  |
| +2.5 Volts monitor |  |
| +5 Volts monitor |  |
| _ROLL_ROT | 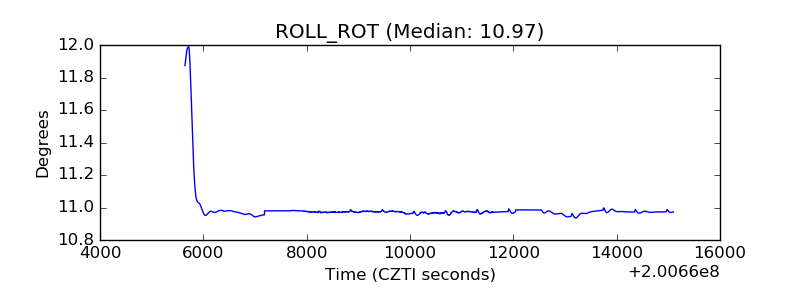 |
| _Roll_DEC | 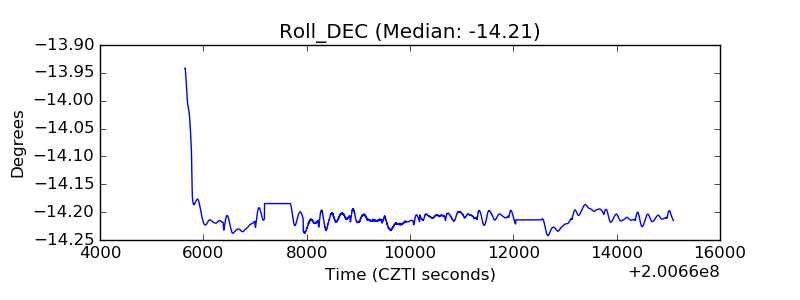 |
| _Roll_RA | 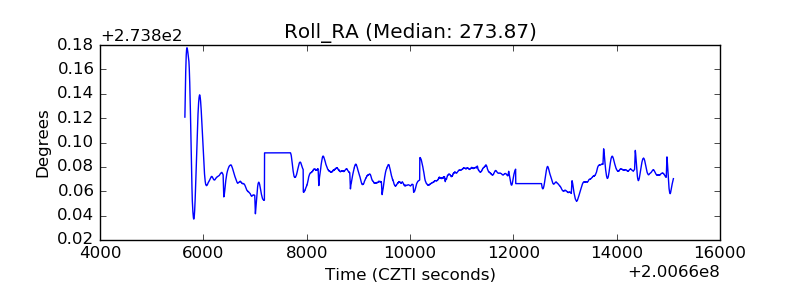 |
| Veto Counter | 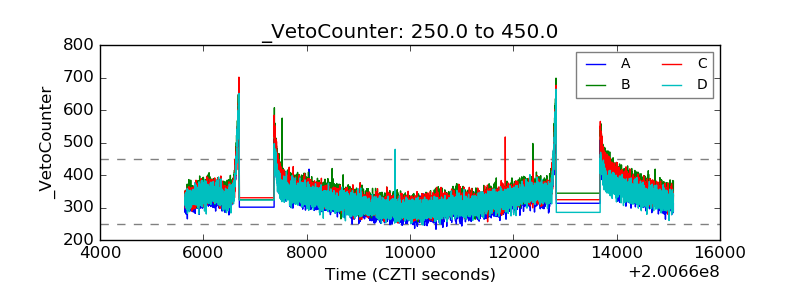 |