| Param | Original file | Final file |
|---|---|---|
| Filename | modeM0/AS1G05_112T01_9000000452_03353cztM0_level2.evt | modeM0/AS1G05_112T01_9000000452_03353cztM0_level2_quad_clean.evt |
| Size (bytes) | 474,393,600 | 74,531,520 |
| Size | 452.4 MB | 71.1 MB |
| Events in quadrant A | 3,244,774 | 453,133 |
| Events in quadrant B | 3,621,541 | 449,641 |
| Events in quadrant C | 3,278,470 | 446,361 |
| Events in quadrant D | 3,747,475 | 420,797 |
| Mode M9 | |||
|---|---|---|---|
| Quadrant | BADHDUFLAG | Total packets | Discarded packets |
| A | 0 | 18 | 0 |
| B | 0 | 18 | 0 |
| C | 0 | 18 | 0 |
| D | 0 | 18 | 0 |
| Mode SS | |||
|---|---|---|---|
| Quadrant | BADHDUFLAG | Total packets | Discarded packets |
| A | 0 | 144 | 0 |
| B | 0 | 144 | 0 |
| C | 0 | 144 | 0 |
| D | 0 | 144 | 0 |
| Mode M0 | |||
|---|---|---|---|
| Quadrant | BADHDUFLAG | Total packets | Discarded packets |
| A | 0 | 14429 | 3 |
| B | 0 | 15360 | 2 |
| C | 0 | 14538 | 2 |
| D | 0 | 16147 | 2 |
| Quadrant | Total seconds | Saturated seconds | Saturation percentage |
|---|---|---|---|
| A | 6986 | 90 | 1.288291% |
| B | 6986 | 113 | 1.617521% |
| C | 6986 | 72 | 1.030633% |
| D | 6986 | 258 | 3.693100% |
Noise dominated data is calculated using 1-second bins in cleaned event files. If a bin has >2000 counts, and if more than 50% of those come from <1% of pixels, then it is considered to be noise-dominated and hence unusable.
| Quadrant | # 1 sec bins | Bins with >0 counts | Bins with >2000 counts | High rate bins dominated by noise | Noise dominated (total time) | Noise dominated (detector-on time) | Marked lightcurve |
|---|---|---|---|---|---|---|---|
| A | 8851 | 6988 | 0 | 0 | 0.00% | 0.00% | 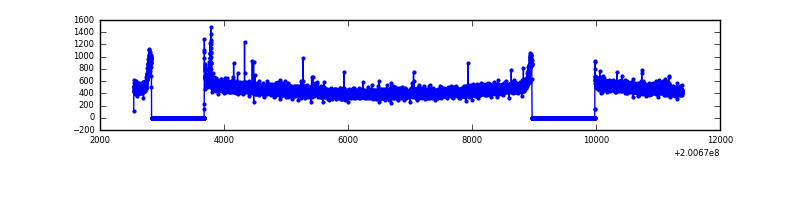 |
| B | 8851 | 6988 | 15 | 15 | 0.17% | 0.21% | 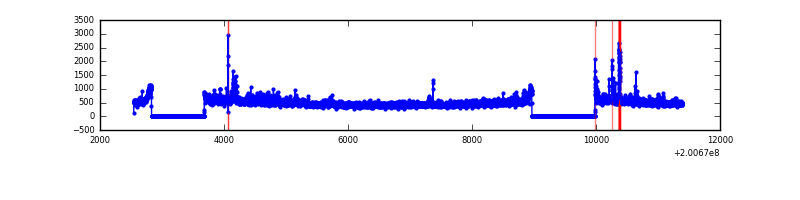 |
| C | 8851 | 6988 | 4 | 4 | 0.05% | 0.06% | 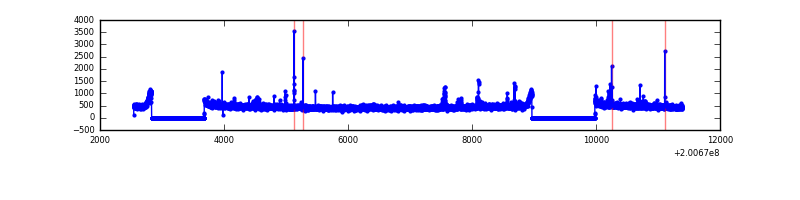 |
| D | 8851 | 6988 | 158 | 158 | 1.79% | 2.26% | 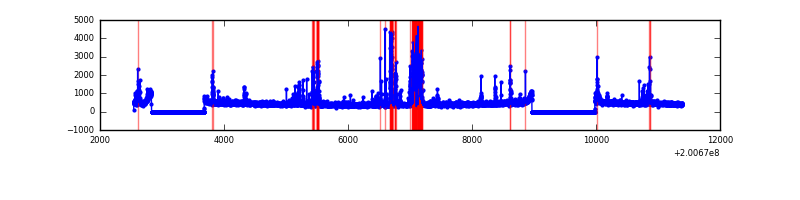 |
Top three noisy pixels from each quadrant. If the there are fewer than three noisy pixels in the level2.evt file, extra rows are filled as -1
| Pixel properties | Quadrant properties | ||||||
|---|---|---|---|---|---|---|---|
| Quadrant | DetID | PixID | Counts | Sigma | Mean | Median | Sigma |
| A | 15 | 174 | 12945 | 71.41 | 829 | 811 | 169.9 |
| A | 11 | 11 | 10474 | 56.87 | 829 | 811 | 169.9 |
| A | 0 | 226 | 9352 | 50.27 | 829 | 811 | 169.9 |
| B | 15 | 204 | 212904 | 1299.18 | 839 | 818 | 163.2 |
| B | 0 | 229 | 67156 | 406.37 | 839 | 818 | 163.2 |
| B | 4 | 81 | 45575 | 274.17 | 839 | 818 | 163.2 |
| C | 1 | 16 | 53071 | 276.46 | 808 | 813 | 189.0 |
| C | 14 | 223 | 31720 | 163.5 | 808 | 813 | 189.0 |
| C | 15 | 208 | 14689 | 73.41 | 808 | 813 | 189.0 |
| D | 13 | 223 | 472559 | 2460.66 | 794 | 773 | 191.7 |
| D | 5 | 233 | 115106 | 596.32 | 794 | 773 | 191.7 |
| D | 9 | 85 | 98499 | 509.7 | 794 | 773 | 191.7 |
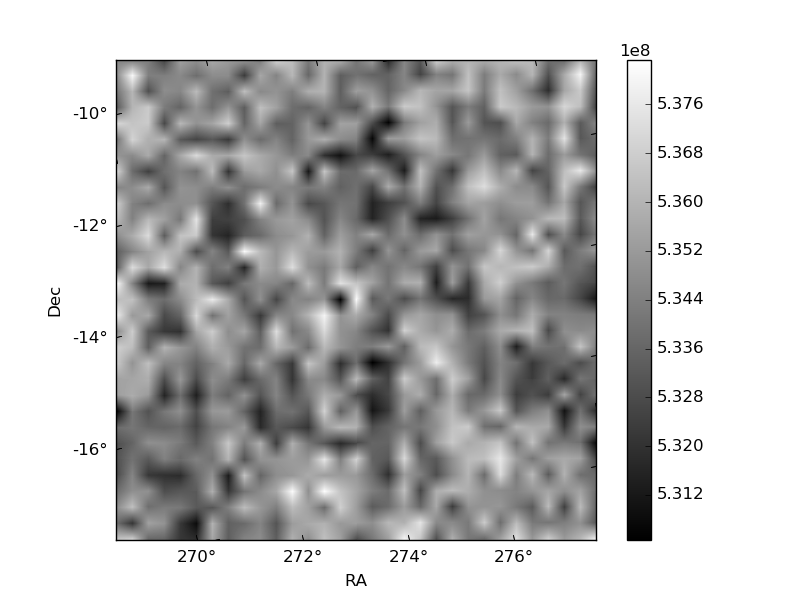
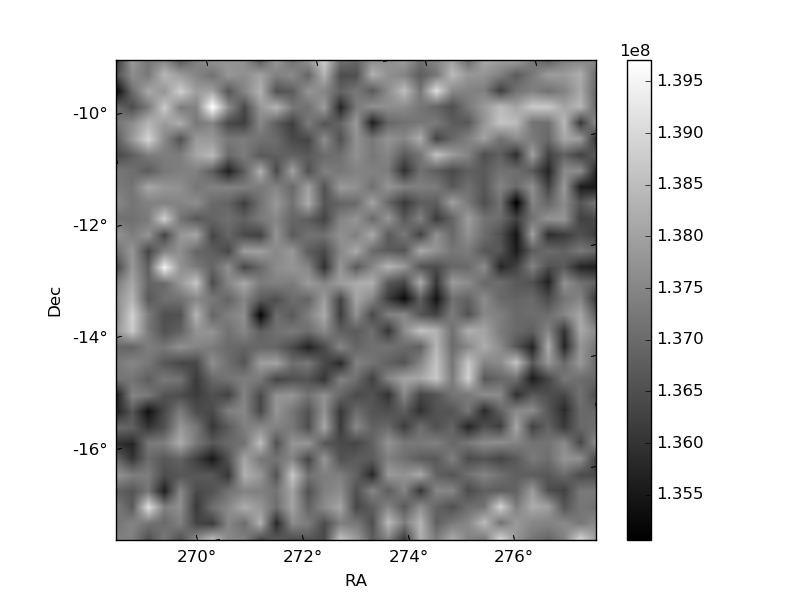
Histogram calculated using DETX and DETY for each event in the final _common_clean file
| Quadrant A | 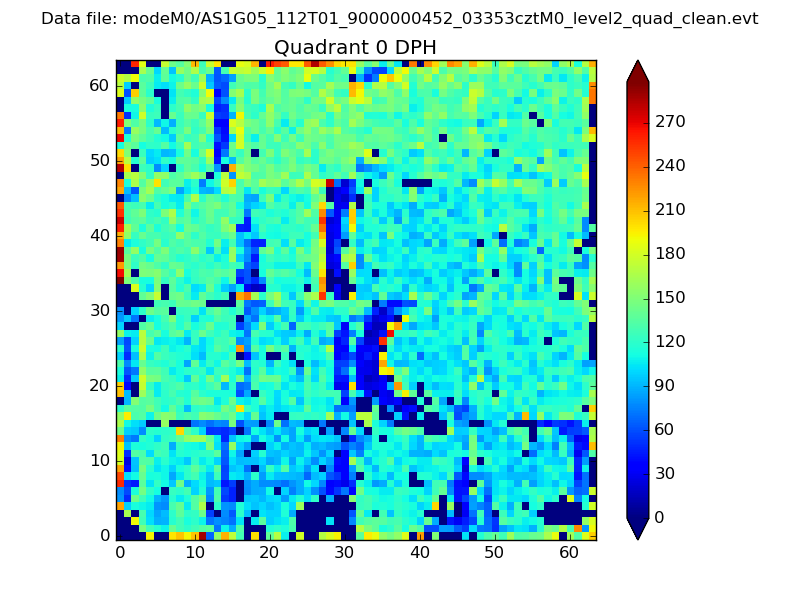 |
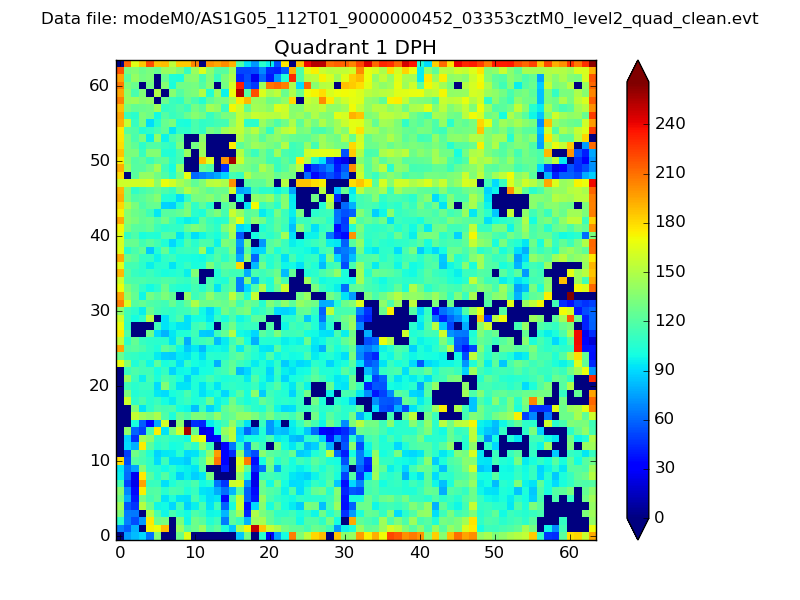 |
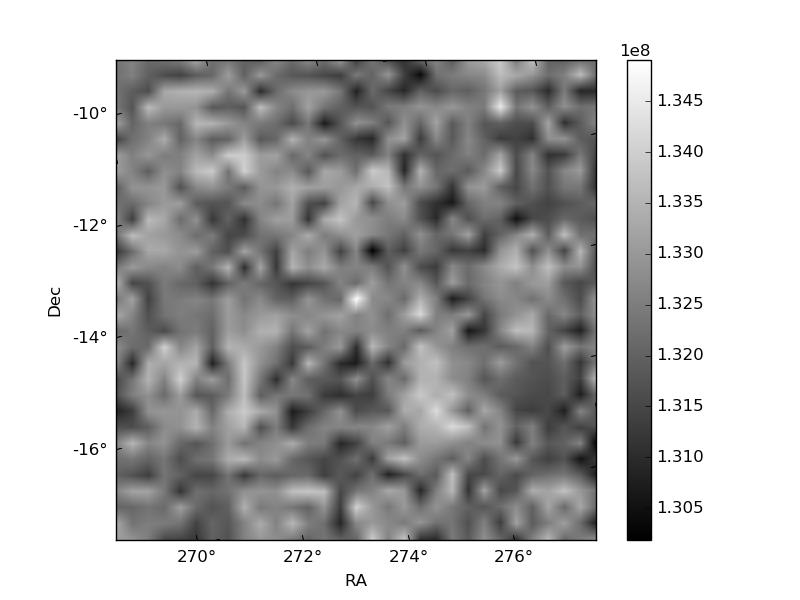
Quadrant B |
|---|---|---|---|
| Quadrant D | 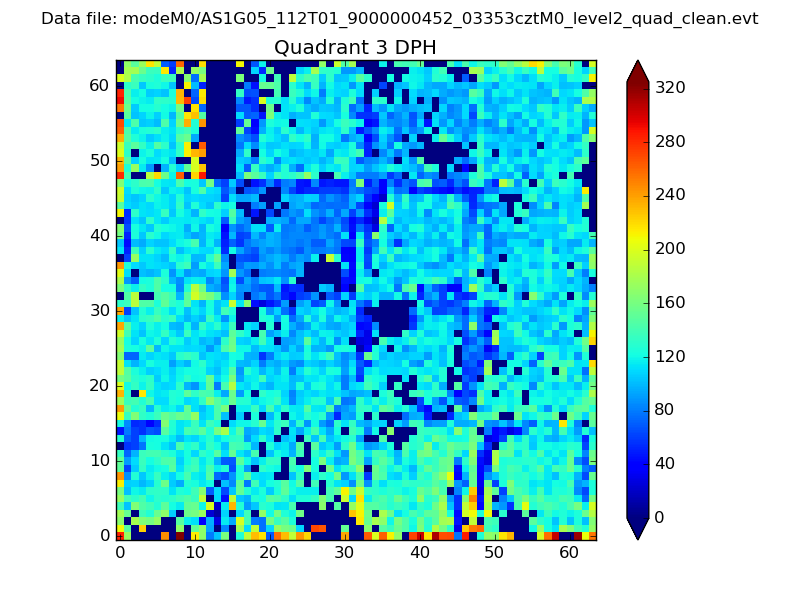 |
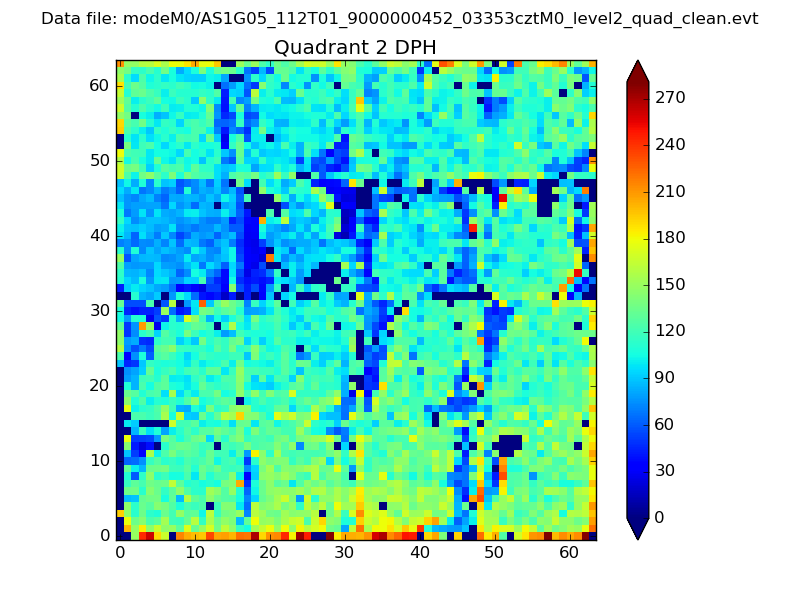 |
Quadrant C |
| Plot type | Count rate plots | Images |
|---|---|---|
| Comparison with Poisson distribution Blue bars denote a histogram of data divided into 1 sec bins. Red curve is a Poisson curve with rate = median count rate of data. |
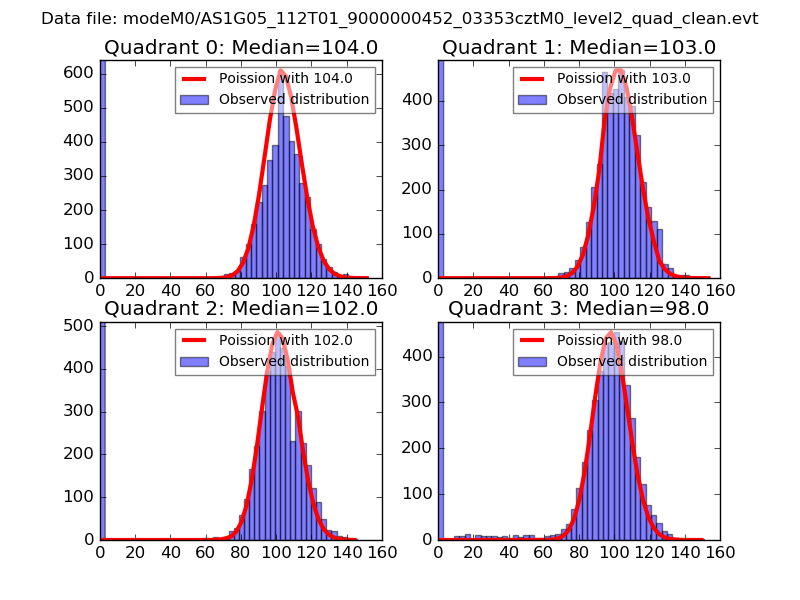 |
 |
| Quadrant-wise count rates Data is divided into 100 sec bins |
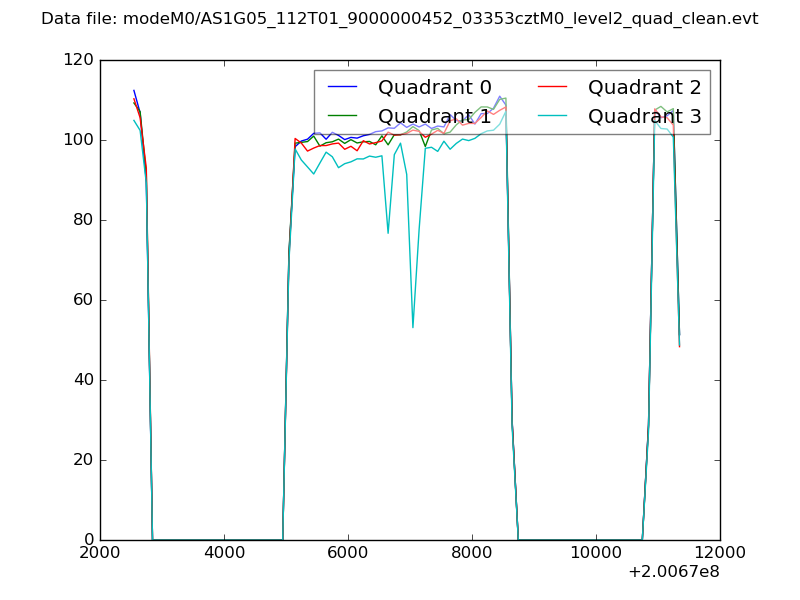 |
|
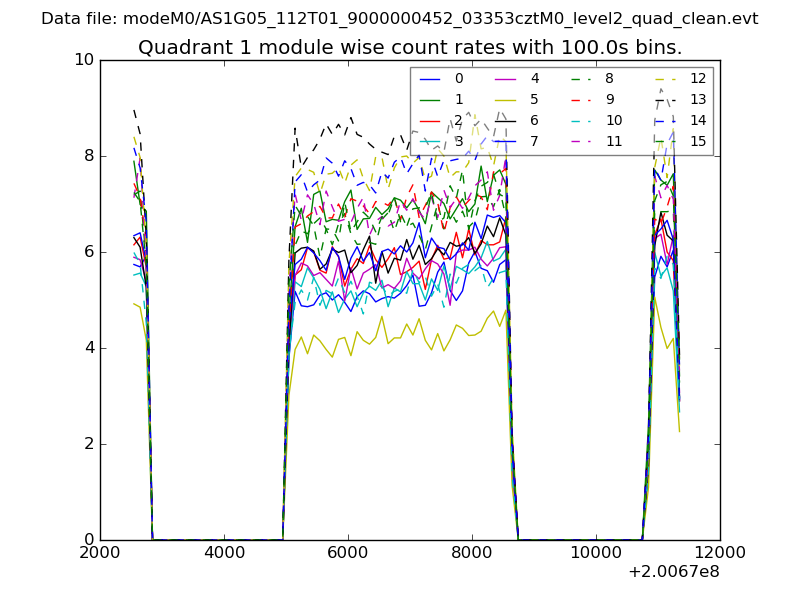
| Module-wise count rates for Quadrant A Data is divided into 100 sec bins |
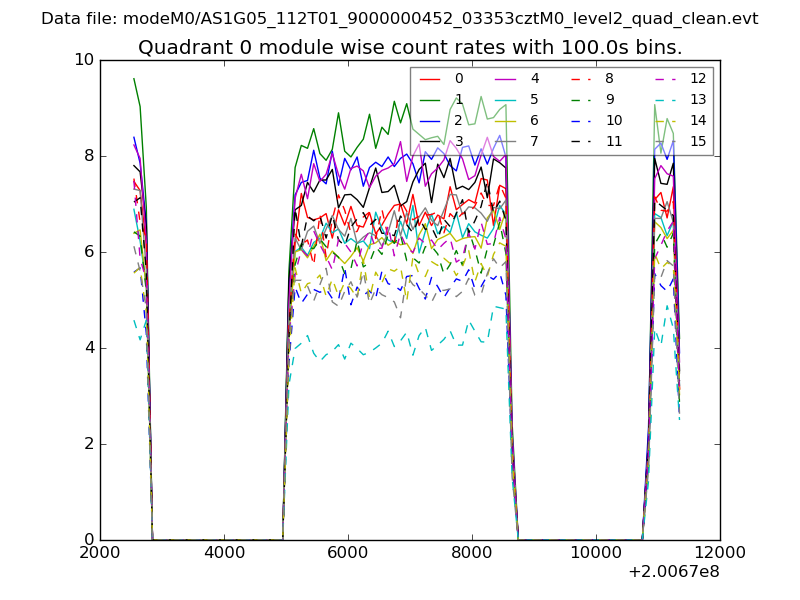 |
 |
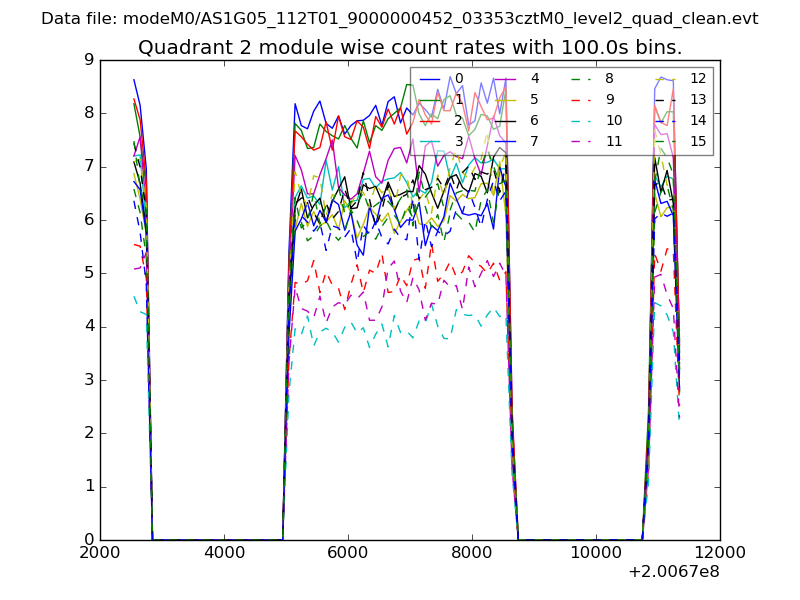
| Module-wise count rates for Quadrant B Data is divided into 100 sec bins |
 |
 |
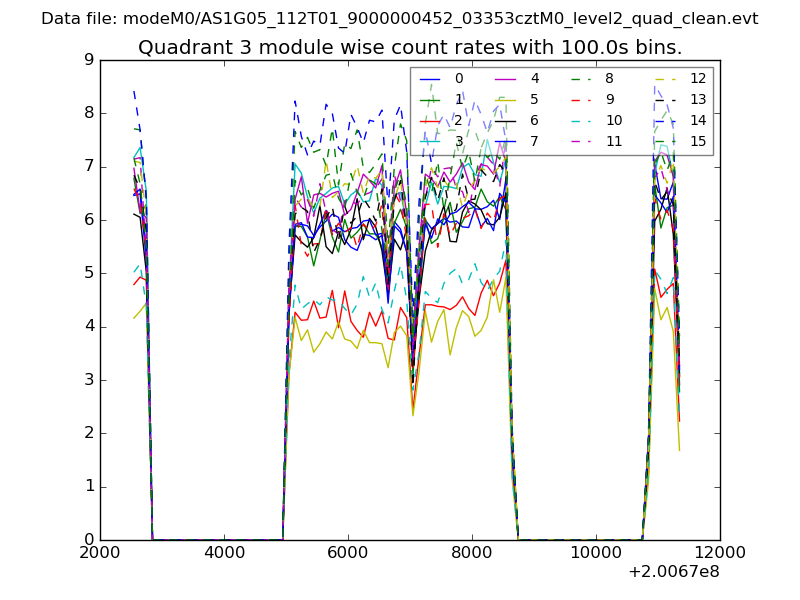
| Module-wise count rates for Quadrant C Data is divided into 100 sec bins |
 |
 |
| Module-wise count rates for Quadrant D Data is divided into 100 sec bins |
 |
 |
| Parameter | Plot |
|---|---|
| CZT HV Monitor | 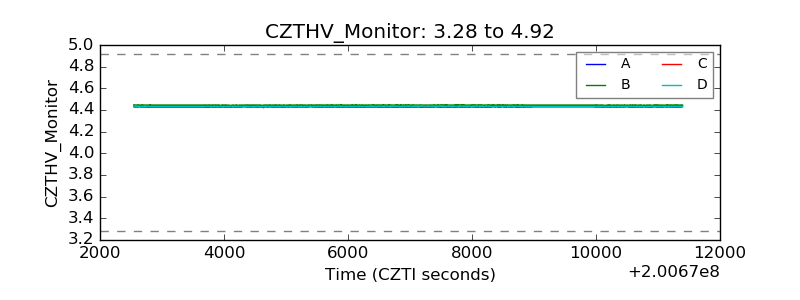 |
| D_VDD | 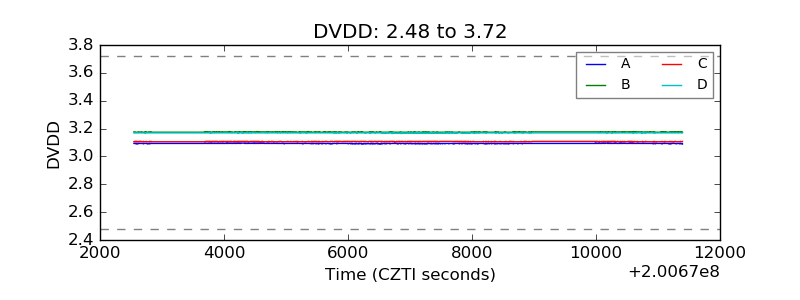 |
| Temperature 1 | 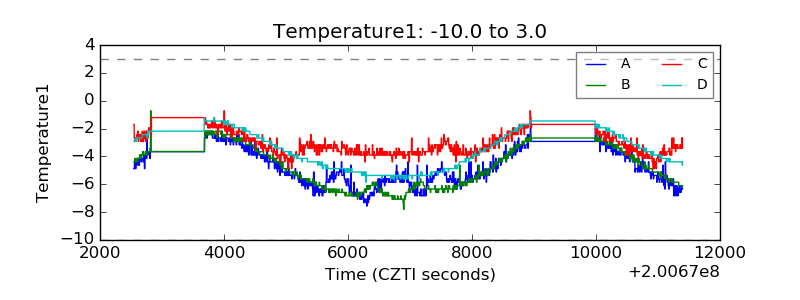 |
| Veto HV Monitor |  |
| Veto LLD | 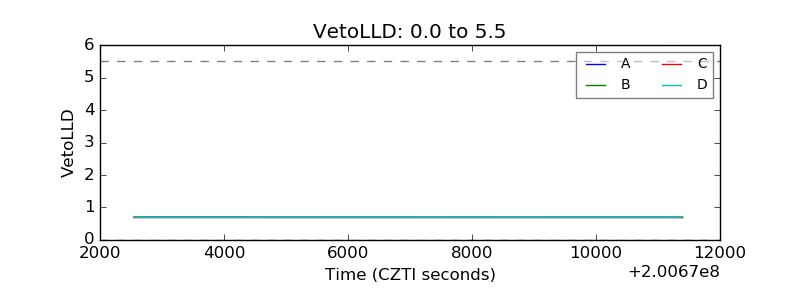 |
| Alpha Counter | 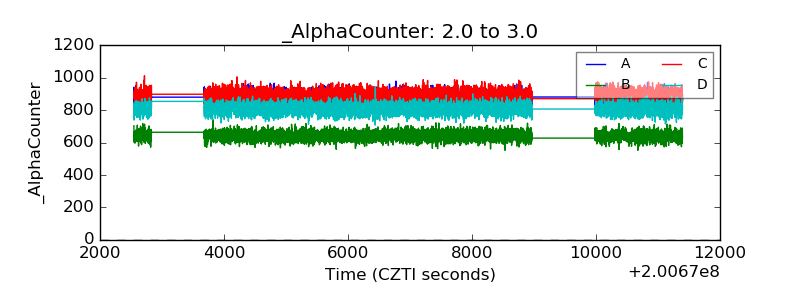 |
| _CPM_Rate | 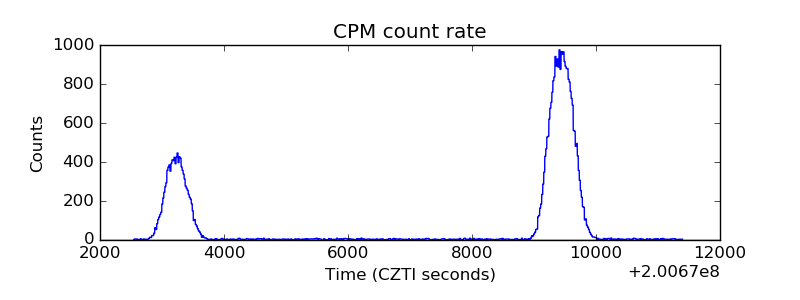 |
| CZT Counter | 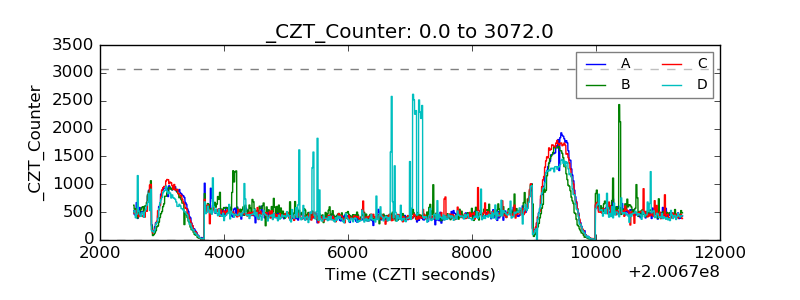 |
| +2.5 Volts monitor |  |
| +5 Volts monitor |  |
| _ROLL_ROT | 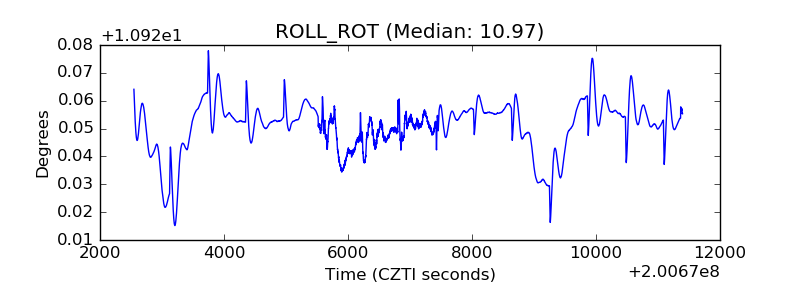 |
| _Roll_DEC | 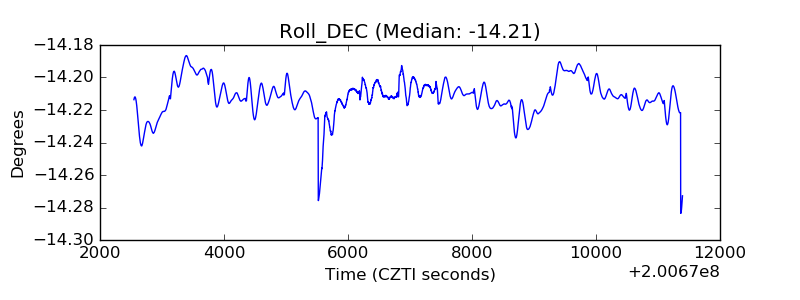 |
| _Roll_RA | 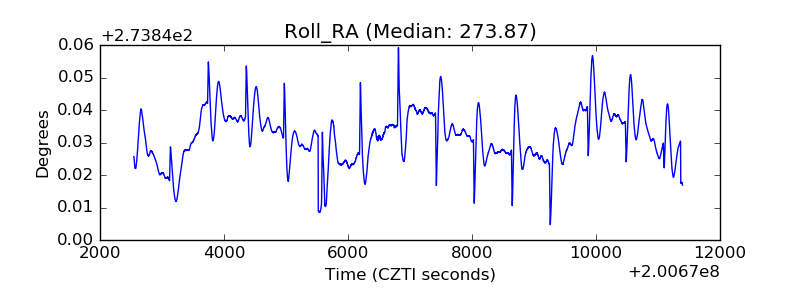 |
| Veto Counter | 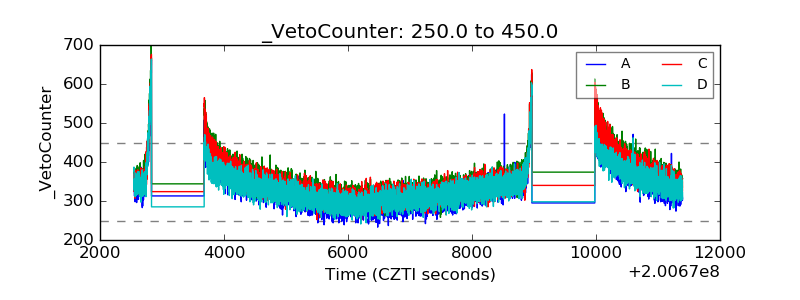 |