| Param | Original file | Final file |
|---|---|---|
| Filename | modeM0/AS1G05_112T01_9000000452_03355cztM0_level2.evt | modeM0/AS1G05_112T01_9000000452_03355cztM0_level2_quad_clean.evt |
| Size (bytes) | 433,483,200 | 76,118,400 |
| Size | 413.4 MB | 72.6 MB |
| Events in quadrant A | 2,993,902 | 469,631 |
| Events in quadrant B | 3,562,877 | 469,458 |
| Events in quadrant C | 3,060,329 | 464,521 |
| Events in quadrant D | 3,069,325 | 448,339 |
| Mode M9 | |||
|---|---|---|---|
| Quadrant | BADHDUFLAG | Total packets | Discarded packets |
| A | 0 | 11 | 0 |
| B | 0 | 11 | 0 |
| C | 0 | 11 | 0 |
| D | 0 | 12 | 0 |
| Mode SS | |||
|---|---|---|---|
| Quadrant | BADHDUFLAG | Total packets | Discarded packets |
| A | 0 | 132 | 0 |
| B | 0 | 132 | 0 |
| C | 0 | 132 | 0 |
| D | 0 | 132 | 0 |
| Mode M0 | |||
|---|---|---|---|
| Quadrant | BADHDUFLAG | Total packets | Discarded packets |
| A | 0 | 13321 | 3 |
| B | 0 | 15002 | 2 |
| C | 0 | 13554 | 2 |
| D | 0 | 13801 | 2 |
| Quadrant | Total seconds | Saturated seconds | Saturation percentage |
|---|---|---|---|
| A | 6492 | 44 | 0.677757% |
| B | 6492 | 121 | 1.863832% |
| C | 6492 | 40 | 0.616143% |
| D | 6492 | 59 | 0.908811% |
Noise dominated data is calculated using 1-second bins in cleaned event files. If a bin has >2000 counts, and if more than 50% of those come from <1% of pixels, then it is considered to be noise-dominated and hence unusable.
| Quadrant | # 1 sec bins | Bins with >0 counts | Bins with >2000 counts | High rate bins dominated by noise | Noise dominated (total time) | Noise dominated (detector-on time) | Marked lightcurve |
|---|---|---|---|---|---|---|---|
| A | 7607 | 6493 | 0 | 0 | 0.00% | 0.00% | 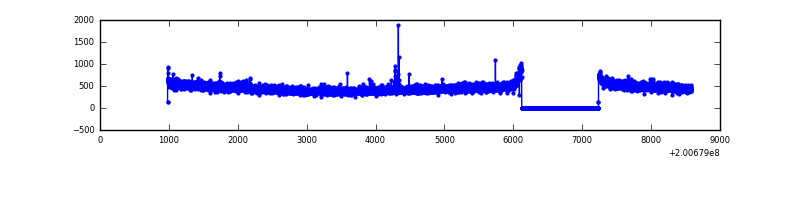 |
| B | 7607 | 6493 | 27 | 27 | 0.35% | 0.42% | 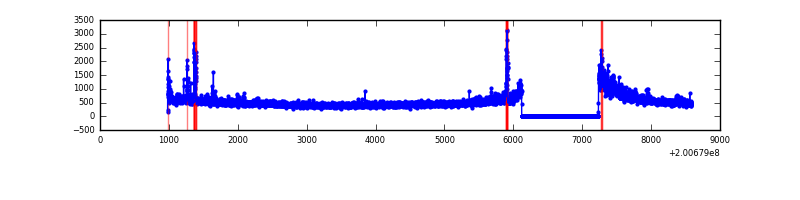 |
| C | 7607 | 6493 | 4 | 4 | 0.05% | 0.06% | 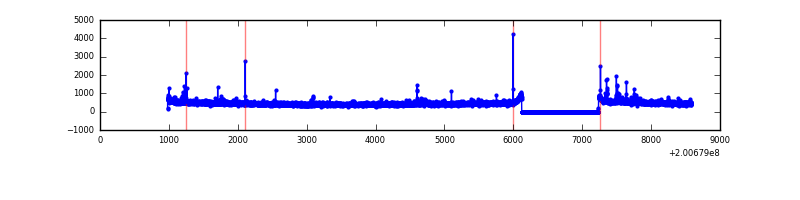 |
| D | 7607 | 6493 | 24 | 24 | 0.32% | 0.37% | 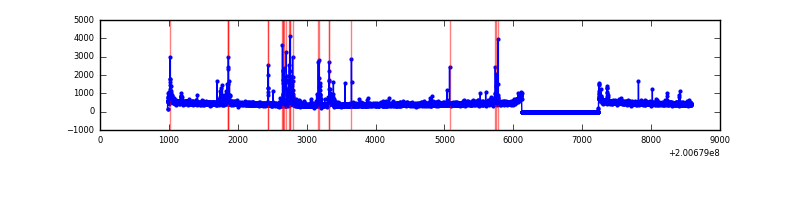 |
Top three noisy pixels from each quadrant. If the there are fewer than three noisy pixels in the level2.evt file, extra rows are filled as -1
| Pixel properties | Quadrant properties | ||||||
|---|---|---|---|---|---|---|---|
| Quadrant | DetID | PixID | Counts | Sigma | Mean | Median | Sigma |
| A | 14 | 249 | 14708 | 88.54 | 770 | 753 | 157.6 |
| A | 0 | 226 | 8469 | 48.96 | 770 | 753 | 157.6 |
| A | 12 | 194 | 8128 | 46.79 | 770 | 753 | 157.6 |
| B | 15 | 204 | 390246 | 2571.78 | 782 | 764 | 151.4 |
| B | 4 | 81 | 41303 | 267.68 | 782 | 764 | 151.4 |
| B | 15 | 85 | 41221 | 267.14 | 782 | 764 | 151.4 |
| C | 1 | 16 | 49170 | 273.27 | 756 | 761 | 177.1 |
| C | 14 | 223 | 24059 | 131.52 | 756 | 761 | 177.1 |
| C | 15 | 208 | 12585 | 66.75 | 756 | 761 | 177.1 |
| D | 13 | 223 | 163609 | 894.06 | 747 | 725 | 182.2 |
| D | 13 | 239 | 20607 | 109.13 | 747 | 725 | 182.2 |
| D | 5 | 233 | 16315 | 85.57 | 747 | 725 | 182.2 |
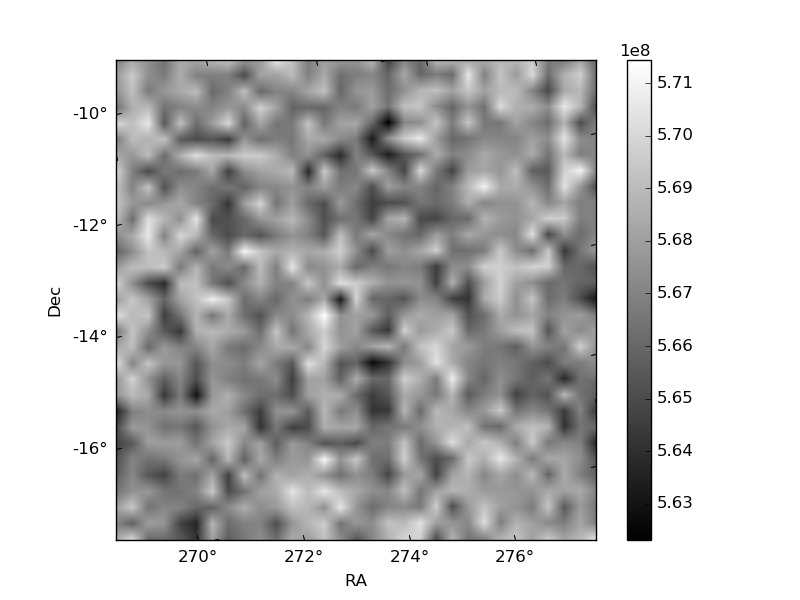
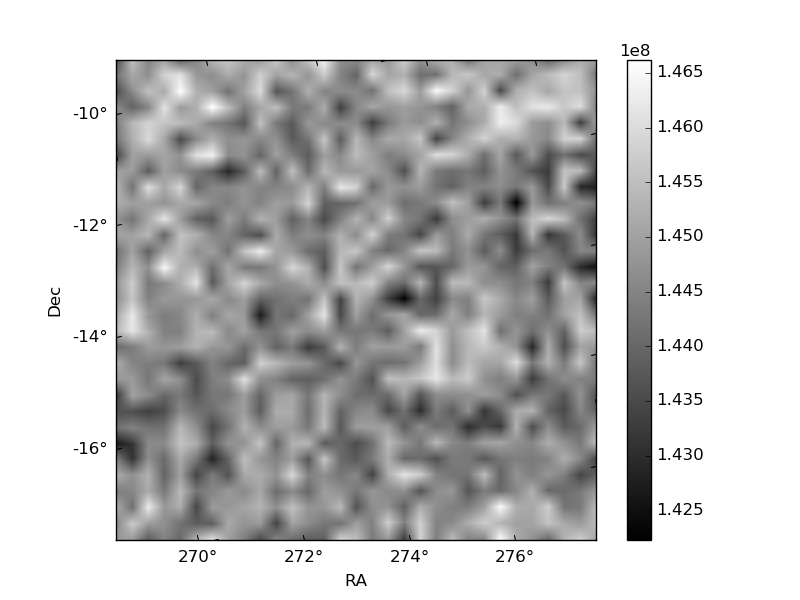
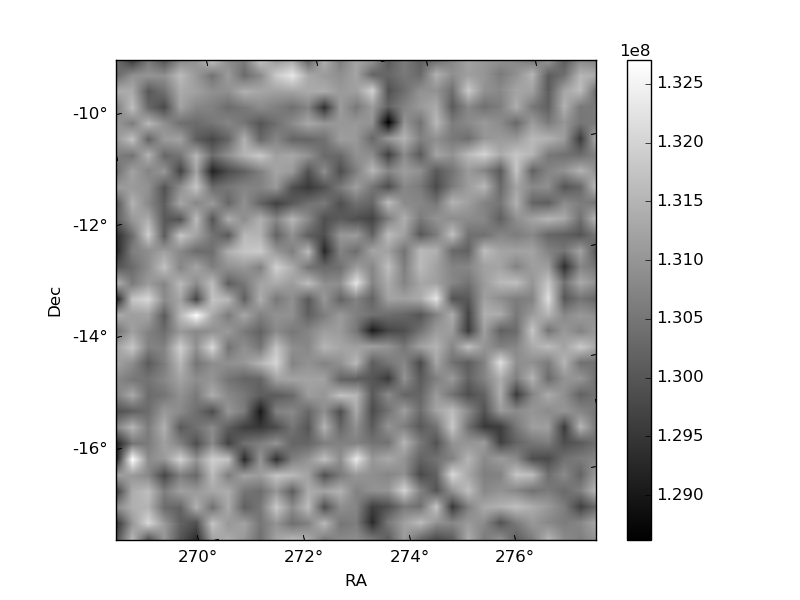
Histogram calculated using DETX and DETY for each event in the final _common_clean file
| Quadrant A | 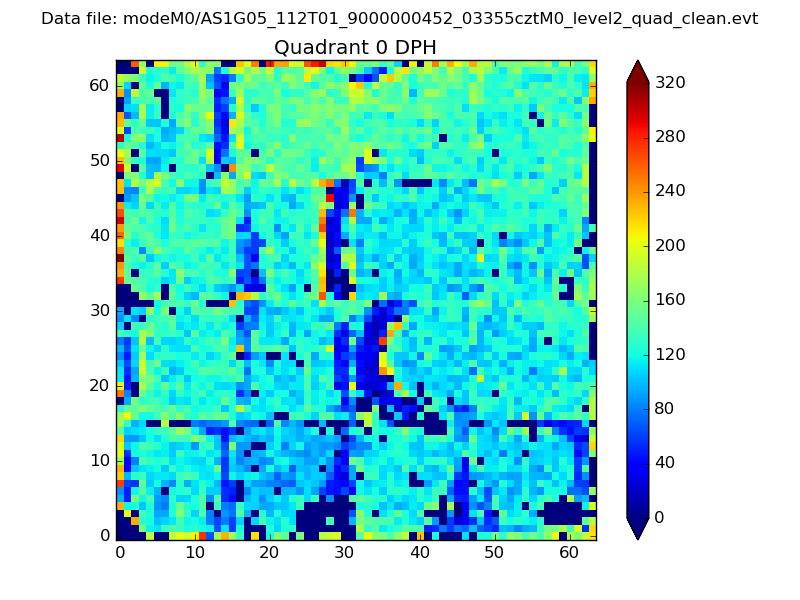 |
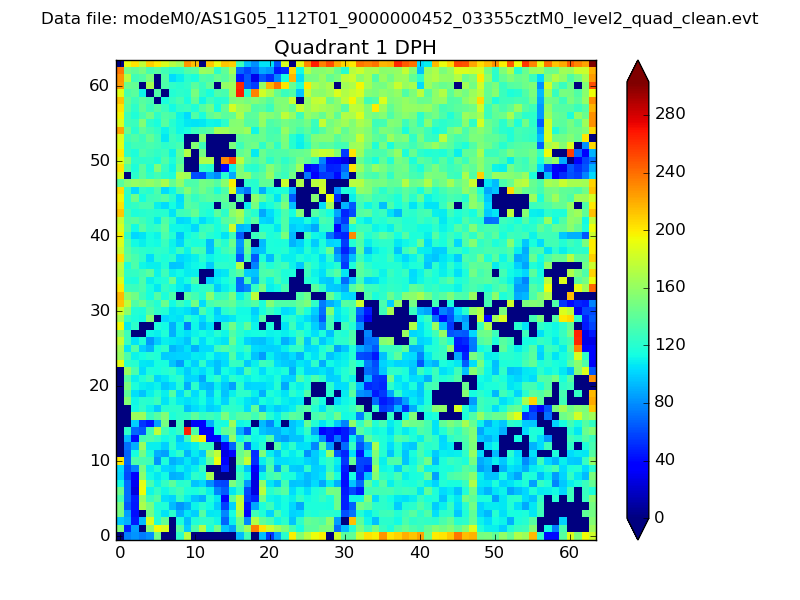 |
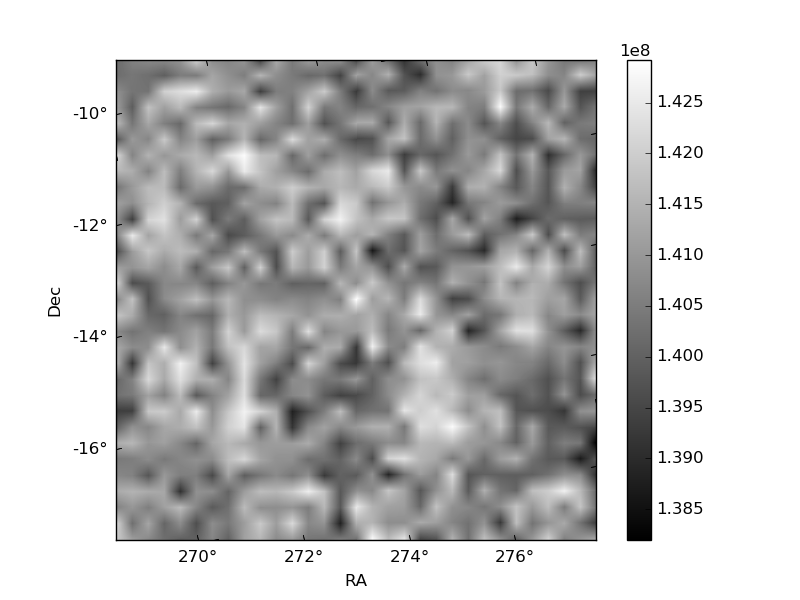
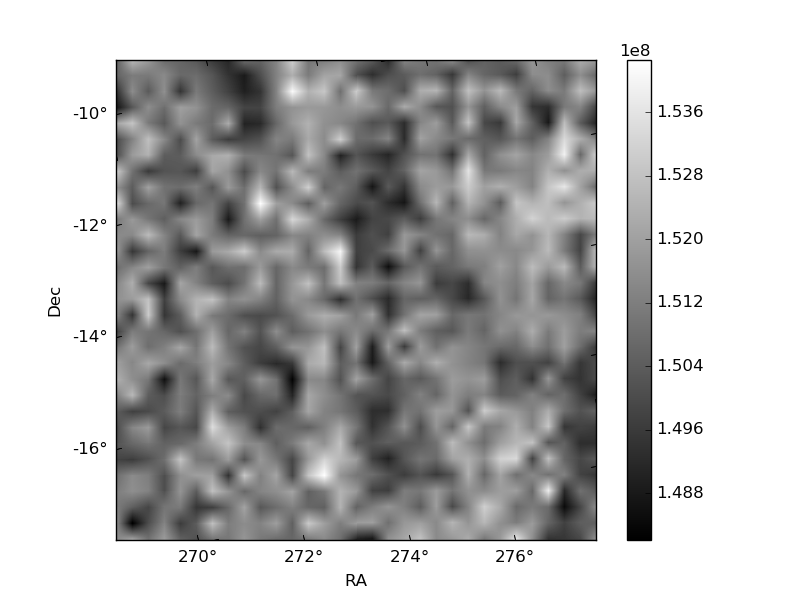
Quadrant B |
|---|---|---|---|
| Quadrant D | 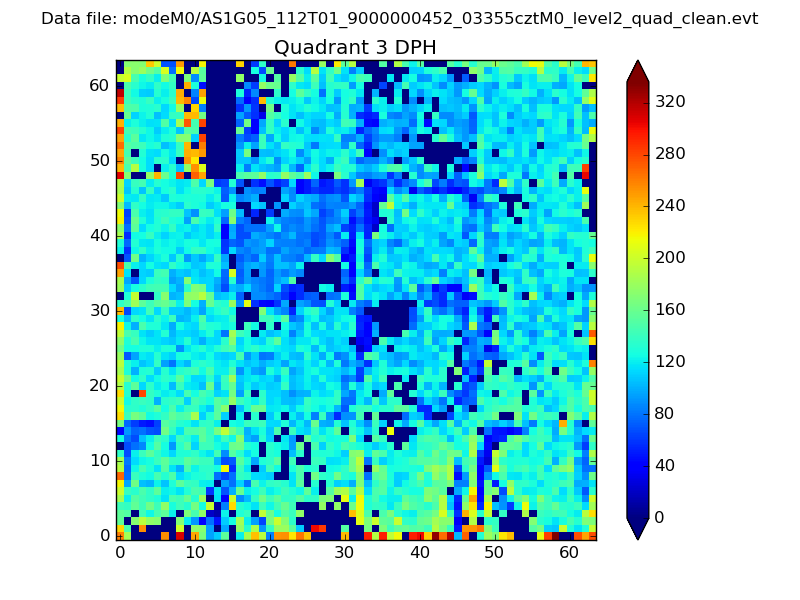 |
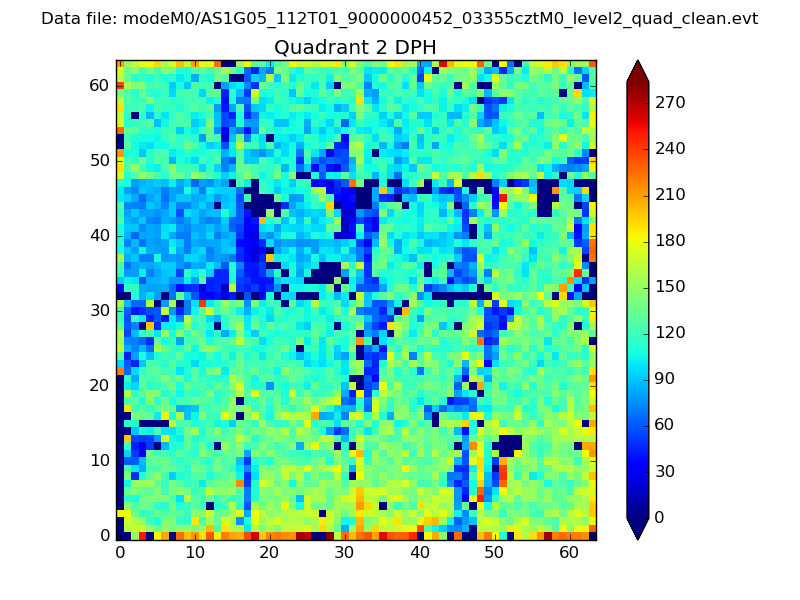 |
Quadrant C |
| Plot type | Count rate plots | Images |
|---|---|---|
| Comparison with Poisson distribution Blue bars denote a histogram of data divided into 1 sec bins. Red curve is a Poisson curve with rate = median count rate of data. |
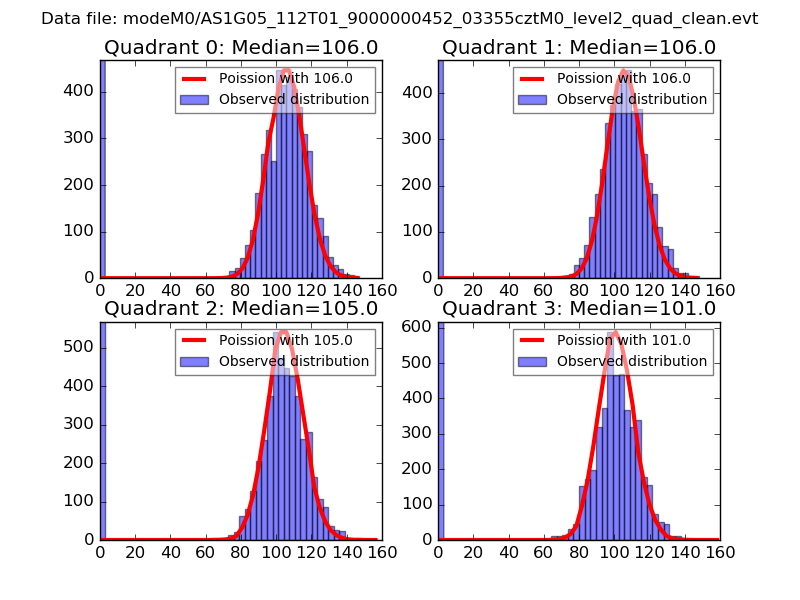 |
 |
| Quadrant-wise count rates Data is divided into 100 sec bins |
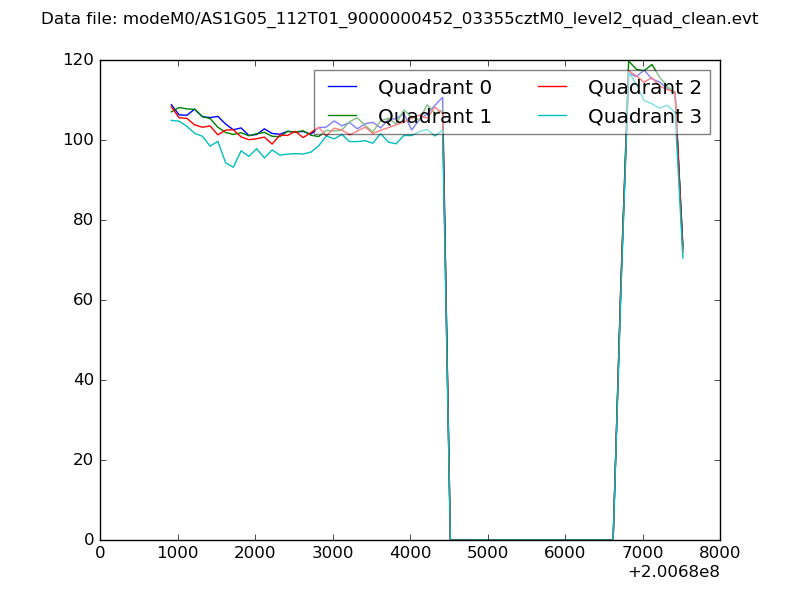 |
|
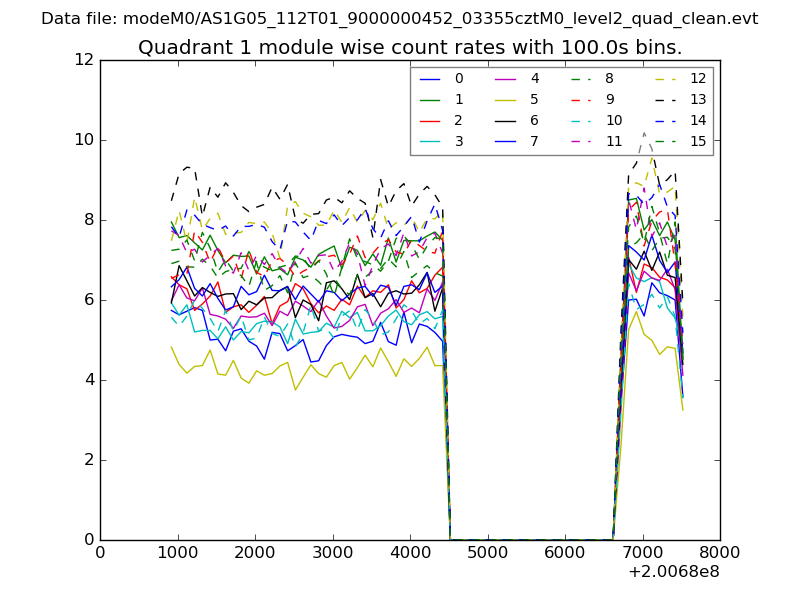
| Module-wise count rates for Quadrant A Data is divided into 100 sec bins |
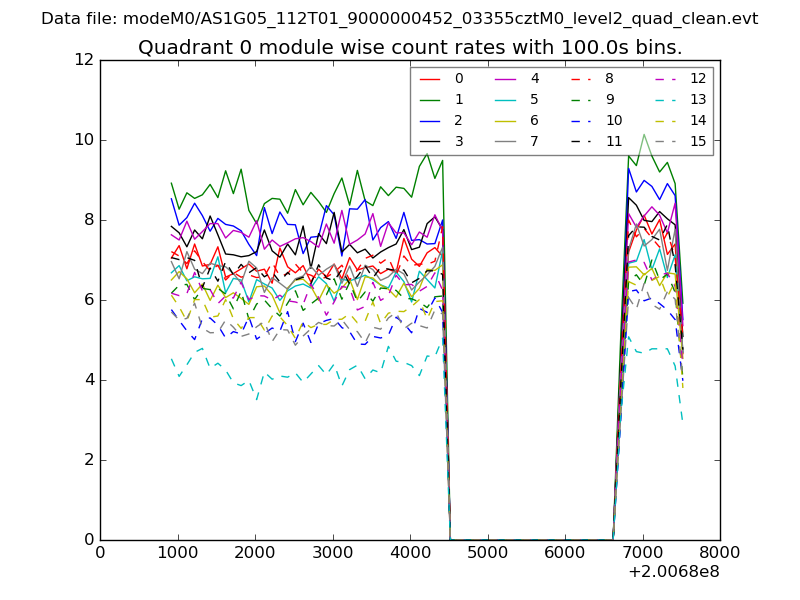 |
 |
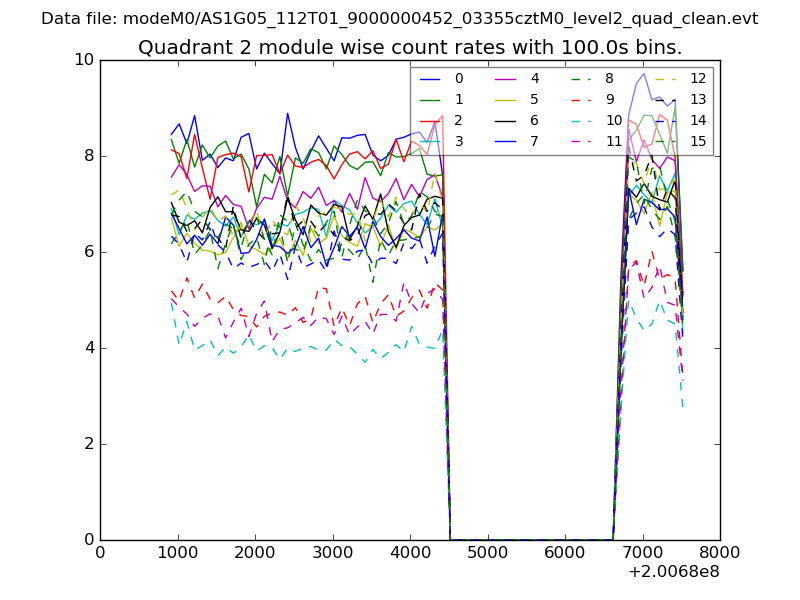
| Module-wise count rates for Quadrant B Data is divided into 100 sec bins |
 |
 |
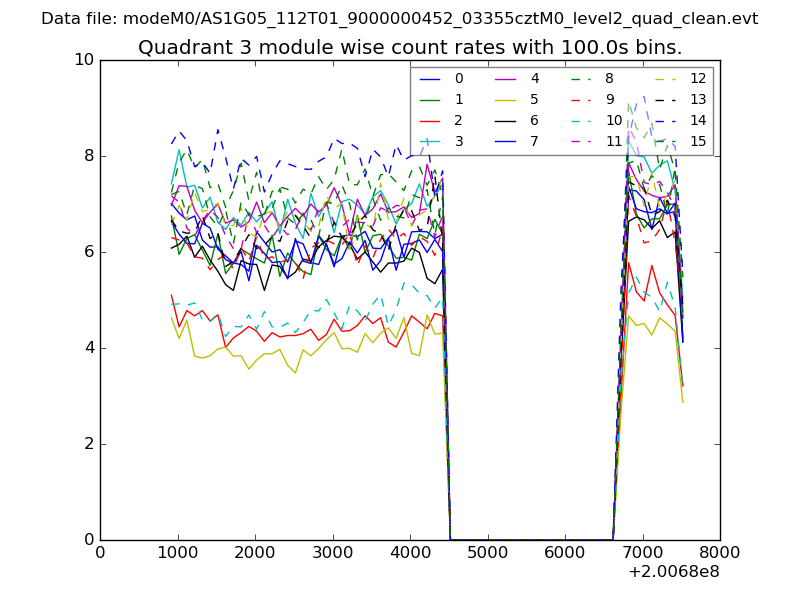
| Module-wise count rates for Quadrant C Data is divided into 100 sec bins |
 |
 |
| Module-wise count rates for Quadrant D Data is divided into 100 sec bins |
 |
 |
| Parameter | Plot |
|---|---|
| CZT HV Monitor | 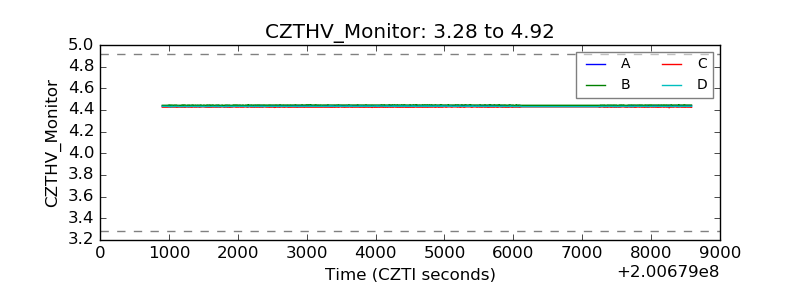 |
| D_VDD | 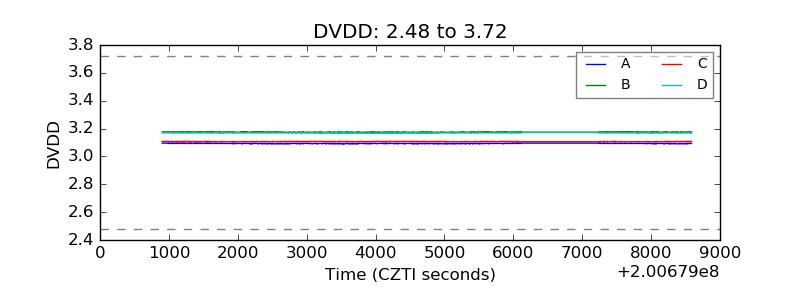 |
| Temperature 1 | 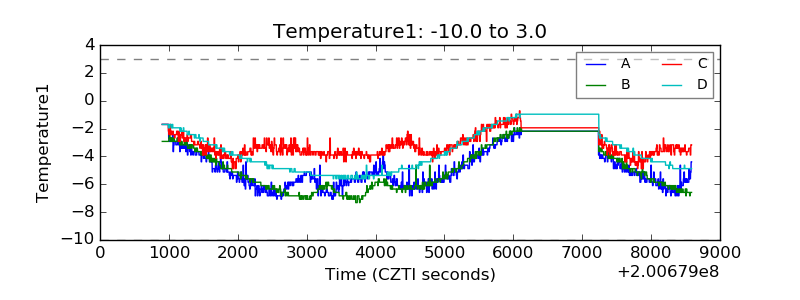 |
| Veto HV Monitor | 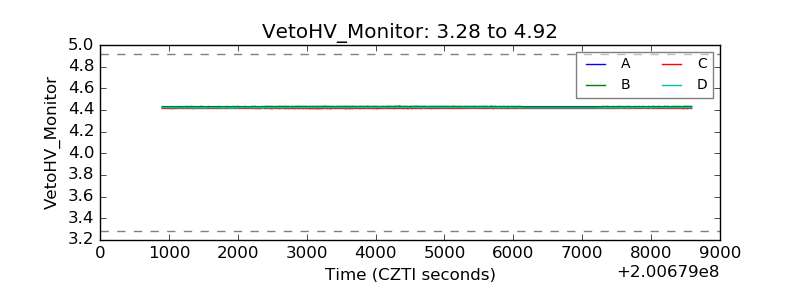 |
| Veto LLD | 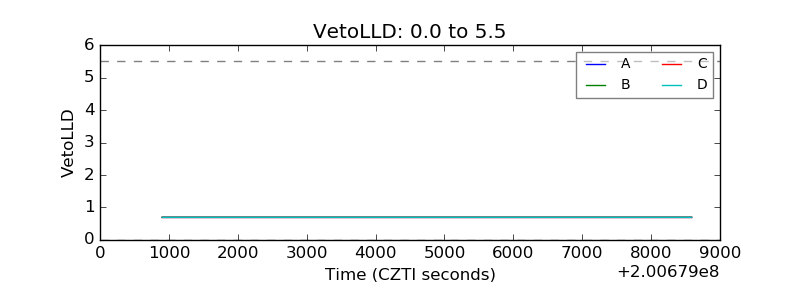 |
| Alpha Counter | 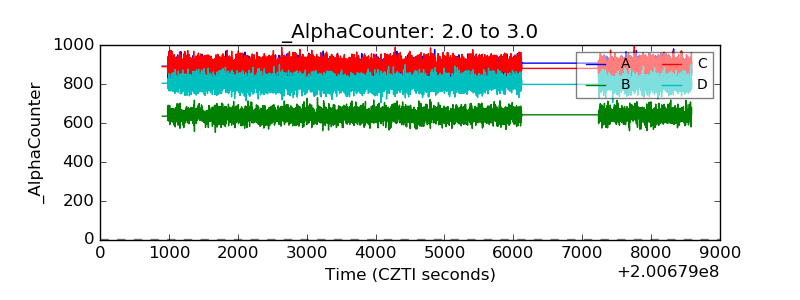 |
| _CPM_Rate | 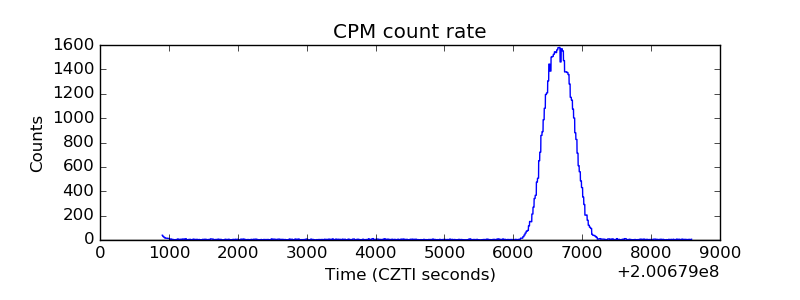 |
| CZT Counter | 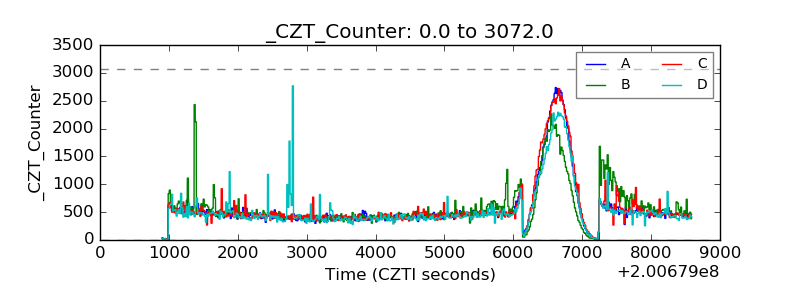 |
| +2.5 Volts monitor |  |
| +5 Volts monitor |  |
| _ROLL_ROT | 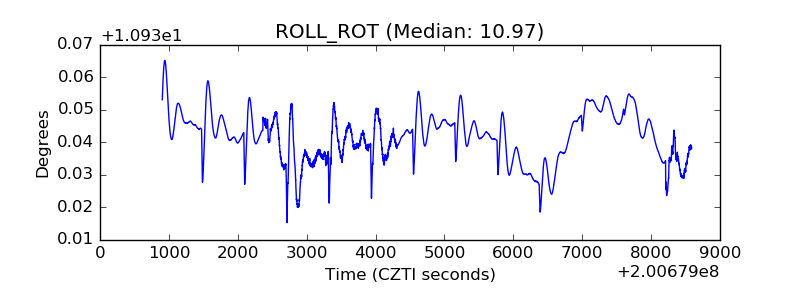 |
| _Roll_DEC | 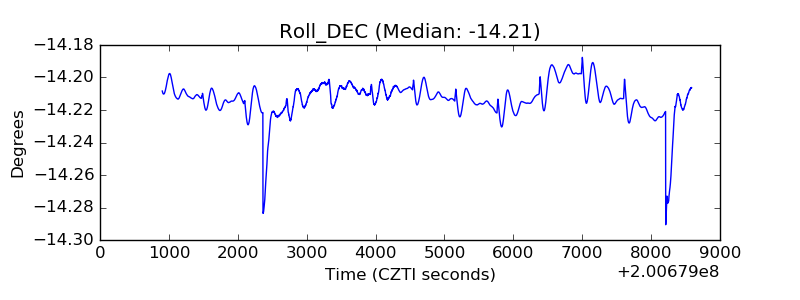 |
| _Roll_RA | 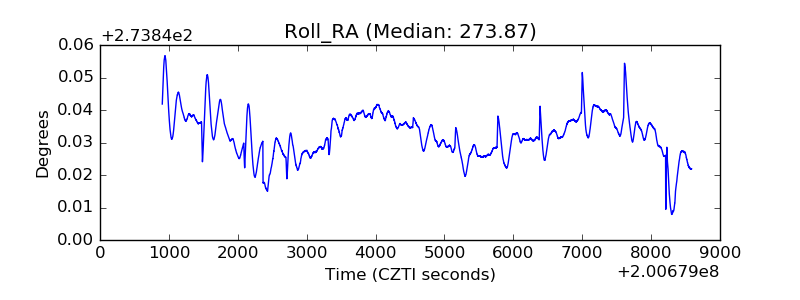 |
| Veto Counter | 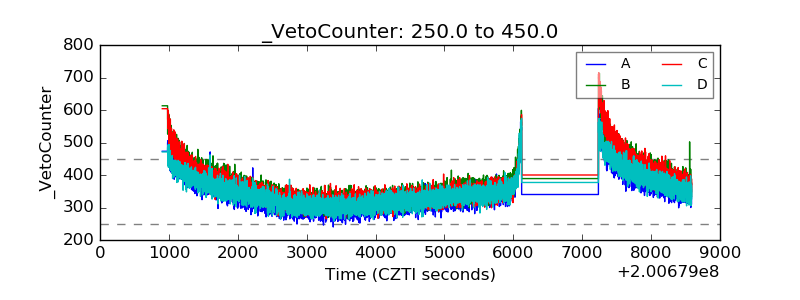 |