| Param | Original file | Final file |
|---|---|---|
| Filename | modeM0/AS1G05_112T01_9000000452_03360cztM0_level2.evt | modeM0/AS1G05_112T01_9000000452_03360cztM0_level2_quad_clean.evt |
| Size (bytes) | 412,971,840 | 70,531,200 |
| Size | 393.8 MB | 67.3 MB |
| Events in quadrant A | 2,988,141 | 426,133 |
| Events in quadrant B | 3,218,787 | 429,477 |
| Events in quadrant C | 3,059,991 | 429,339 |
| Events in quadrant D | 2,809,953 | 409,573 |
| Mode M9 | |||
|---|---|---|---|
| Quadrant | BADHDUFLAG | Total packets | Discarded packets |
| A | 0 | 9 | 0 |
| B | 0 | 9 | 0 |
| C | 0 | 9 | 0 |
| D | 0 | 9 | 0 |
| Mode SS | |||
|---|---|---|---|
| Quadrant | BADHDUFLAG | Total packets | Discarded packets |
| A | 0 | 130 | 0 |
| B | 0 | 130 | 0 |
| C | 0 | 130 | 0 |
| D | 0 | 130 | 0 |
| Mode M0 | |||
|---|---|---|---|
| Quadrant | BADHDUFLAG | Total packets | Discarded packets |
| A | 0 | 13351 | 2 |
| B | 0 | 13837 | 1 |
| C | 0 | 13540 | 1 |
| D | 0 | 13145 | 1 |
| Quadrant | Total seconds | Saturated seconds | Saturation percentage |
|---|---|---|---|
| A | 6313 | 65 | 1.029621% |
| B | 6313 | 51 | 0.807857% |
| C | 6313 | 29 | 0.459370% |
| D | 6313 | 29 | 0.459370% |
Noise dominated data is calculated using 1-second bins in cleaned event files. If a bin has >2000 counts, and if more than 50% of those come from <1% of pixels, then it is considered to be noise-dominated and hence unusable.
| Quadrant | # 1 sec bins | Bins with >0 counts | Bins with >2000 counts | High rate bins dominated by noise | Noise dominated (total time) | Noise dominated (detector-on time) | Marked lightcurve |
|---|---|---|---|---|---|---|---|
| A | 7233 | 6314 | 32 | 32 | 0.44% | 0.51% | 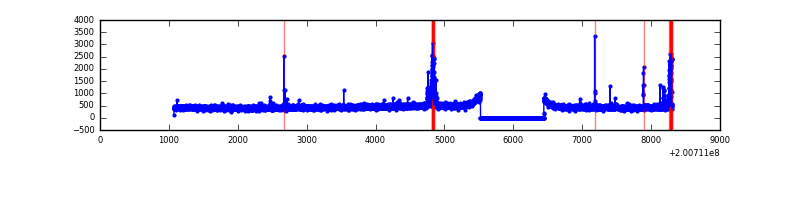 |
| B | 7233 | 6314 | 0 | 0 | 0.00% | 0.00% | 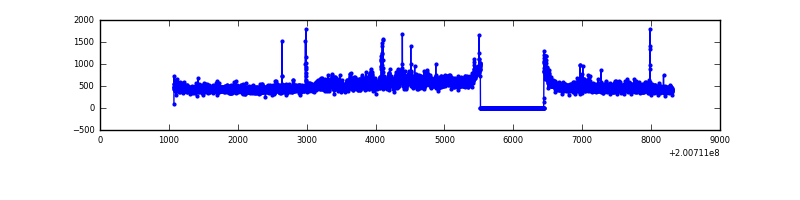 |
| C | 7233 | 6314 | 4 | 4 | 0.06% | 0.06% | 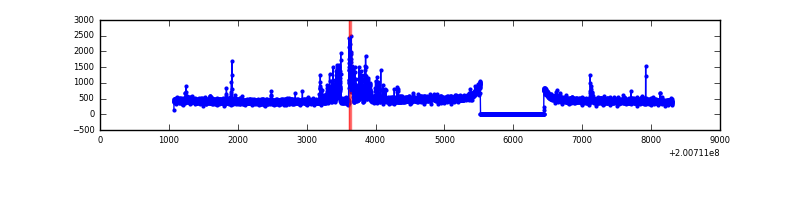 |
| D | 7233 | 6314 | 8 | 8 | 0.11% | 0.13% |  |
Top three noisy pixels from each quadrant. If the there are fewer than three noisy pixels in the level2.evt file, extra rows are filled as -1
| Pixel properties | Quadrant properties | ||||||
|---|---|---|---|---|---|---|---|
| Quadrant | DetID | PixID | Counts | Sigma | Mean | Median | Sigma |
| A | 0 | 50 | 95031 | 630.15 | 725 | 708 | 149.7 |
| A | 14 | 249 | 91175 | 604.39 | 725 | 708 | 149.7 |
| A | 0 | 226 | 7738 | 46.97 | 725 | 708 | 149.7 |
| B | 15 | 204 | 278596 | 1936.47 | 734 | 716 | 143.5 |
| B | 14 | 167 | 50558 | 347.33 | 734 | 716 | 143.5 |
| B | 4 | 81 | 16226 | 108.08 | 734 | 716 | 143.5 |
| C | 1 | 16 | 239207 | 1421.84 | 711 | 716 | 167.7 |
| C | 12 | 4 | 16507 | 94.14 | 711 | 716 | 167.7 |
| C | 14 | 223 | 10676 | 59.38 | 711 | 716 | 167.7 |
| D | 13 | 223 | 68512 | 389.66 | 707 | 684 | 174.1 |
| D | 10 | 34 | 22205 | 123.63 | 707 | 684 | 174.1 |
| D | 13 | 174 | 18223 | 100.76 | 707 | 684 | 174.1 |
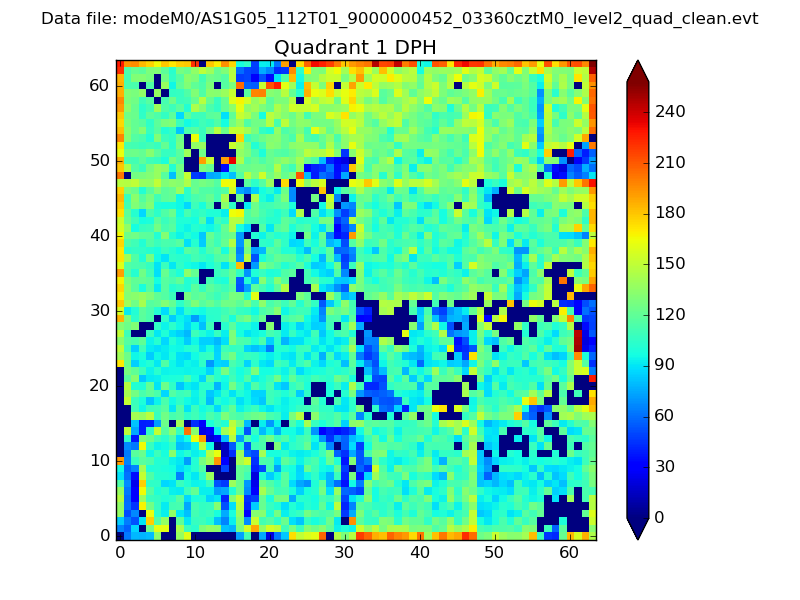
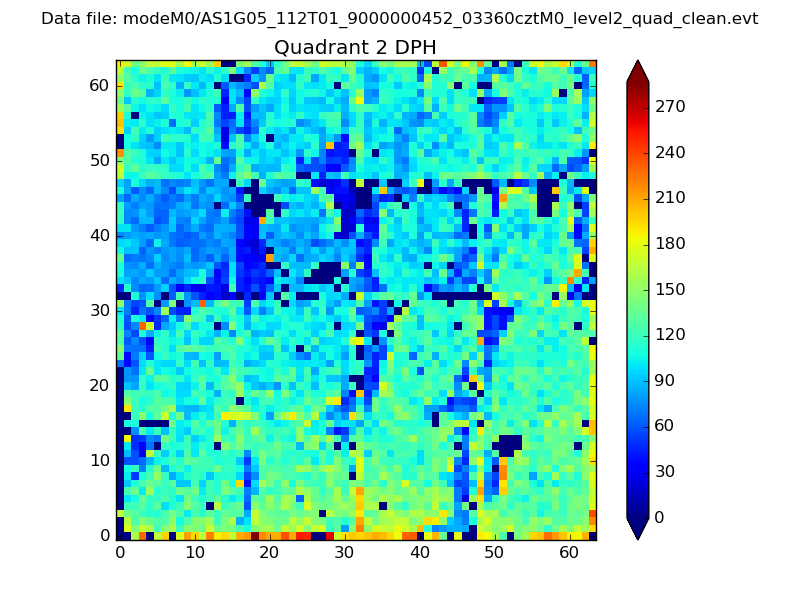
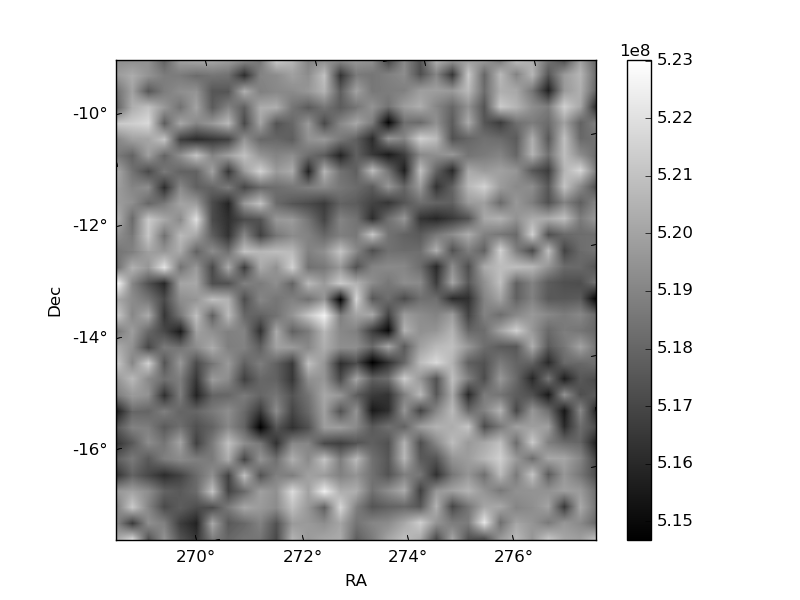
Histogram calculated using DETX and DETY for each event in the final _common_clean file
| Quadrant A | 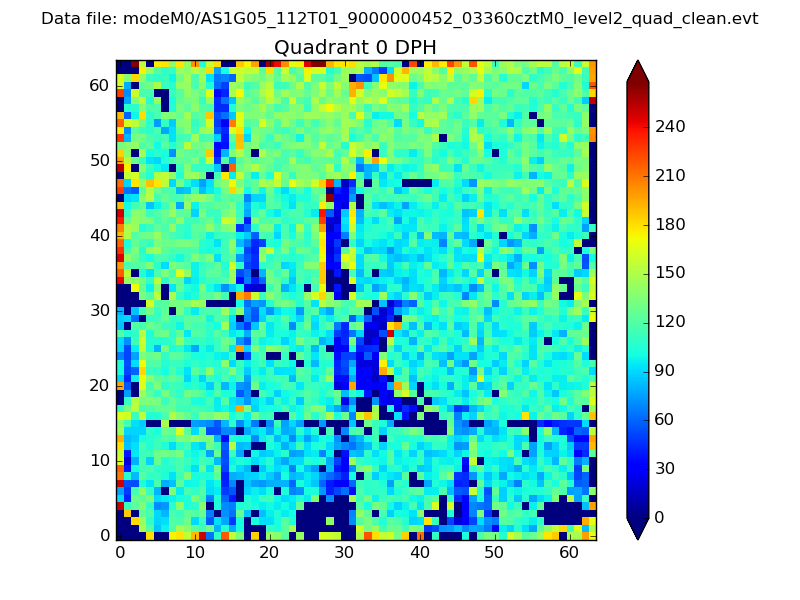 |
 |
Quadrant B |
|---|---|---|---|
| Quadrant D | 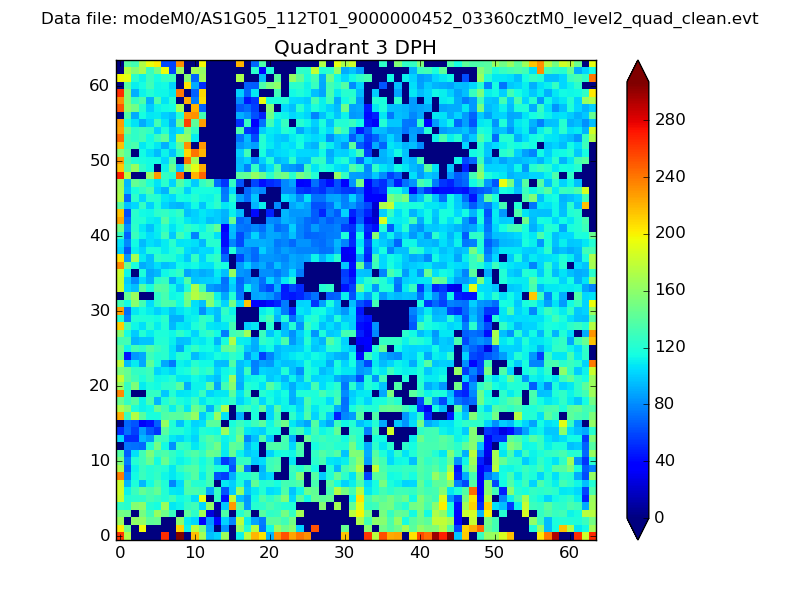 |
 |
Quadrant C |
| Plot type | Count rate plots | Images |
|---|---|---|
| Comparison with Poisson distribution Blue bars denote a histogram of data divided into 1 sec bins. Red curve is a Poisson curve with rate = median count rate of data. |
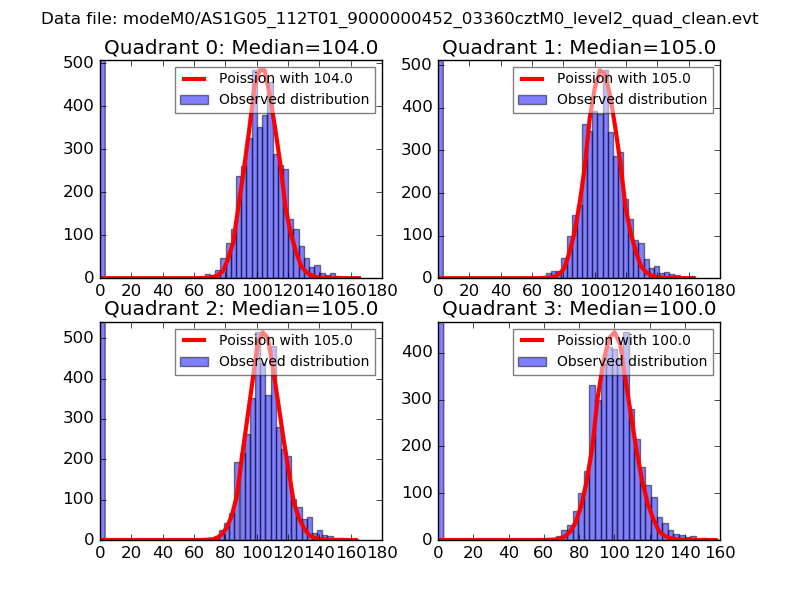 |
 |
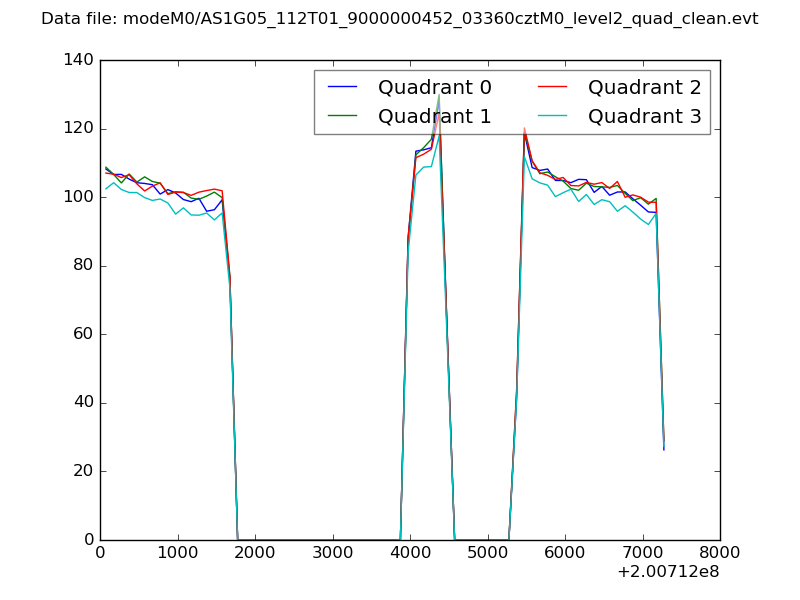
| Quadrant-wise count rates Data is divided into 100 sec bins |
 |
|
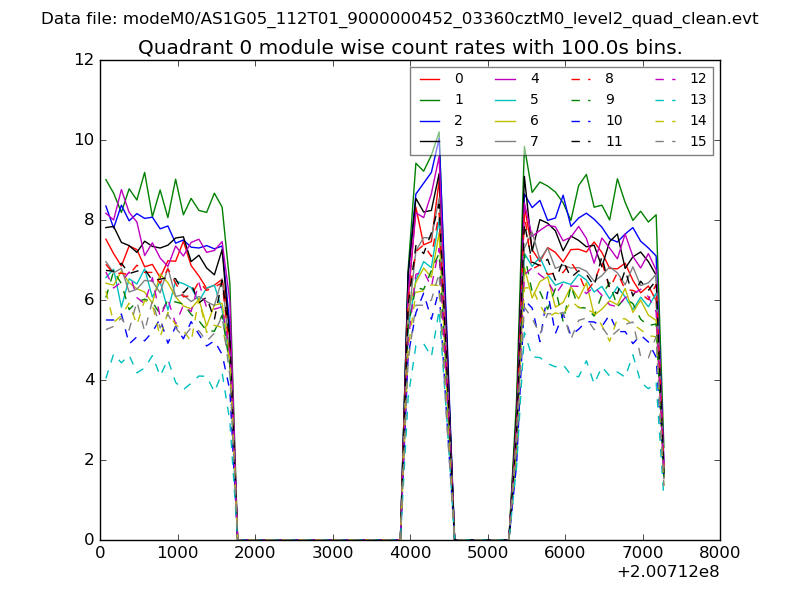
| Module-wise count rates for Quadrant A Data is divided into 100 sec bins |
 |
 |
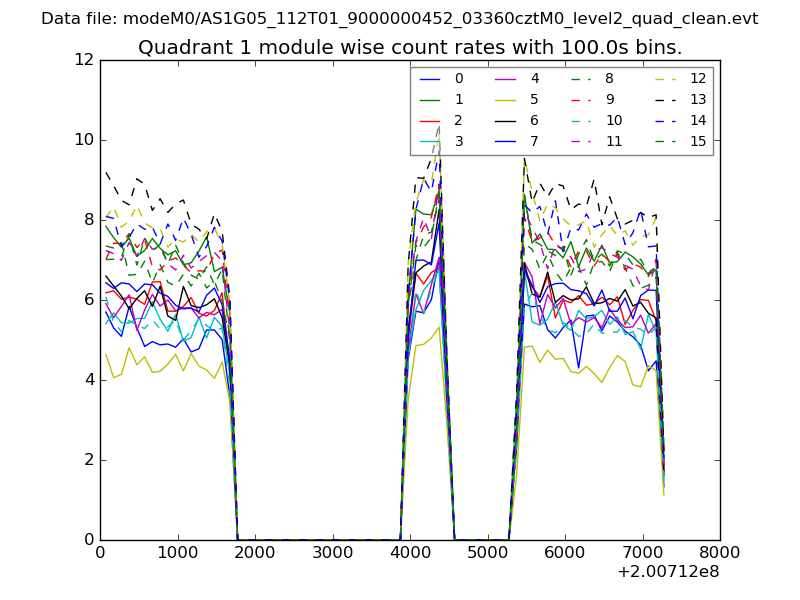
| Module-wise count rates for Quadrant B Data is divided into 100 sec bins |
 |
 |
| Module-wise count rates for Quadrant C Data is divided into 100 sec bins |
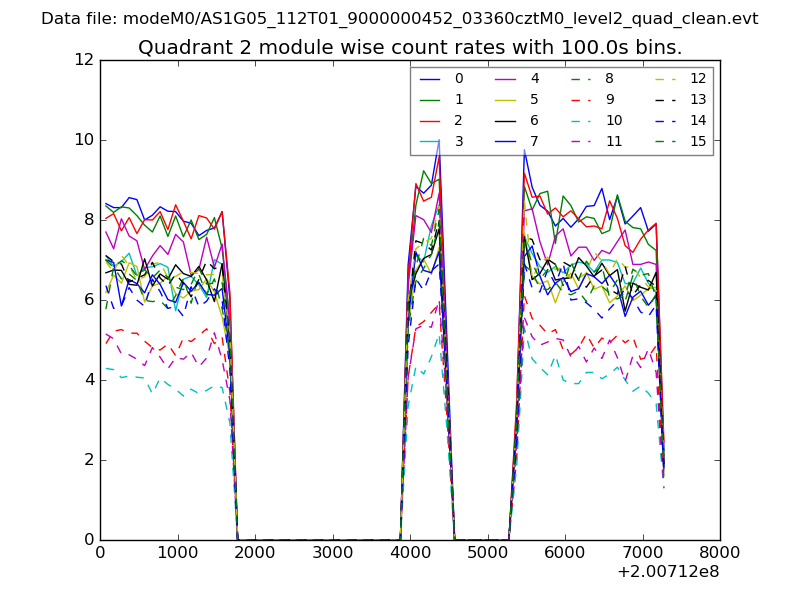 |
 |
| Module-wise count rates for Quadrant D Data is divided into 100 sec bins |
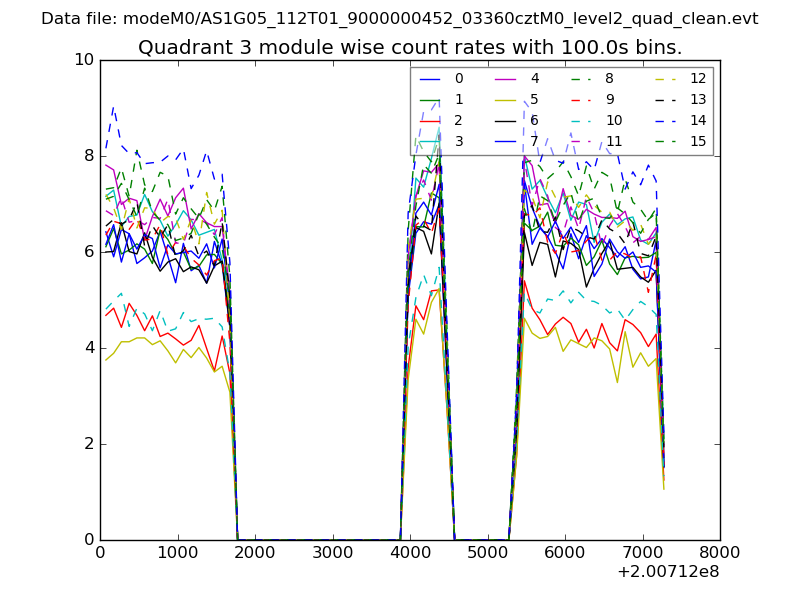 |
 |
| Parameter | Plot |
|---|---|
| CZT HV Monitor | 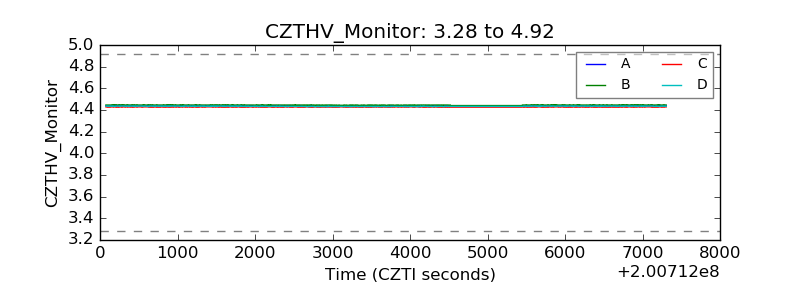 |
| D_VDD | 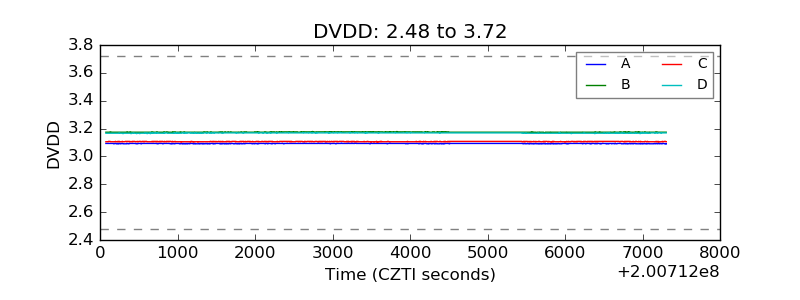 |
| Temperature 1 | 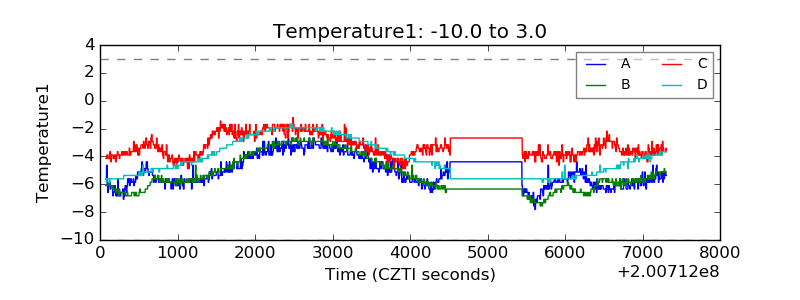 |
| Veto HV Monitor | 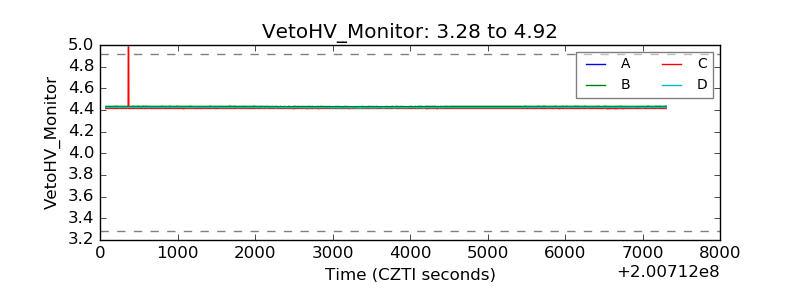 |
| Veto LLD | 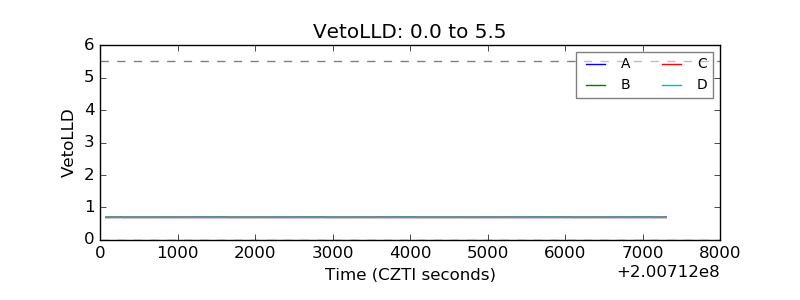 |
| Alpha Counter | 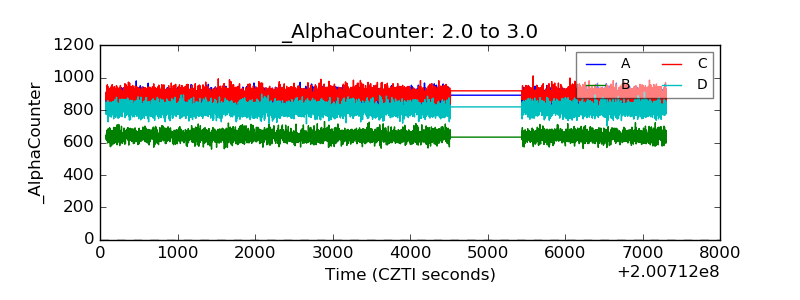 |
| _CPM_Rate | 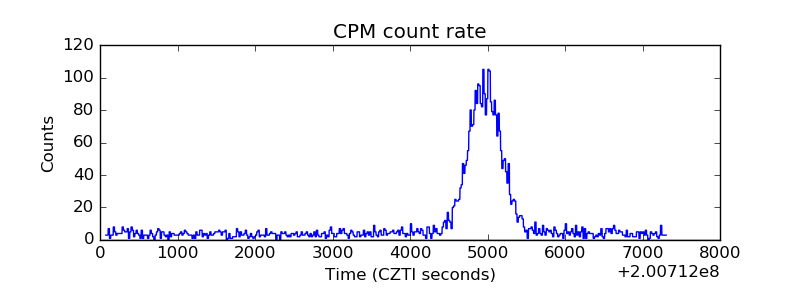 |
| CZT Counter | 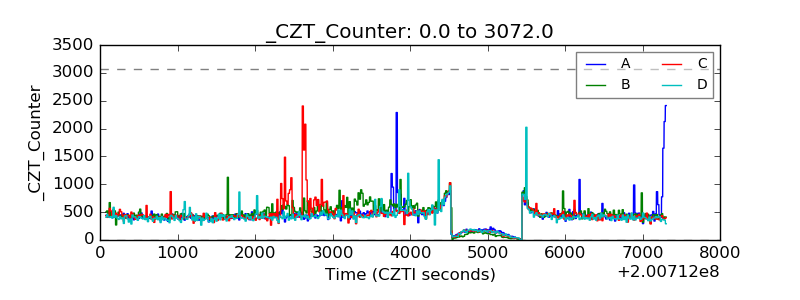 |
| +2.5 Volts monitor |  |
| +5 Volts monitor | 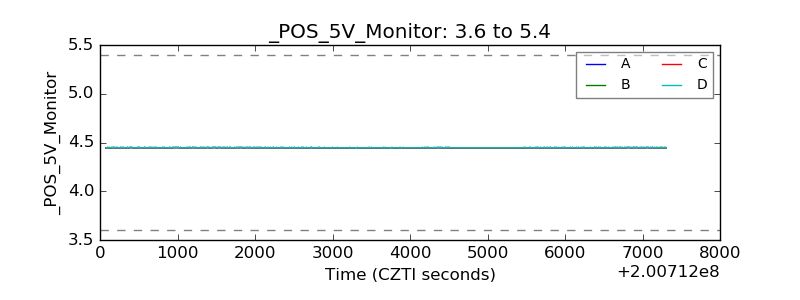 |
| _ROLL_ROT | 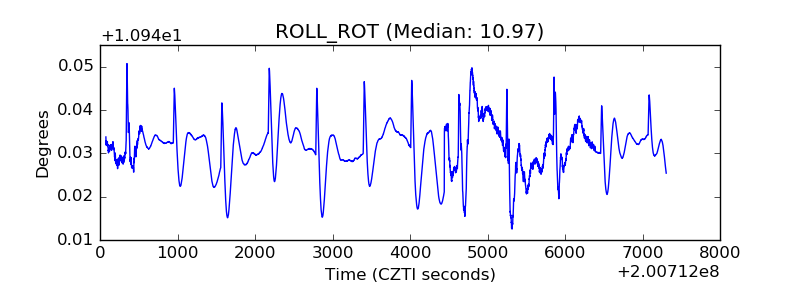 |
| _Roll_DEC | 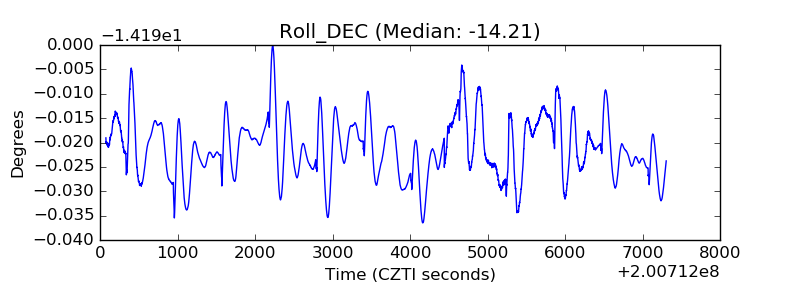 |
| _Roll_RA | 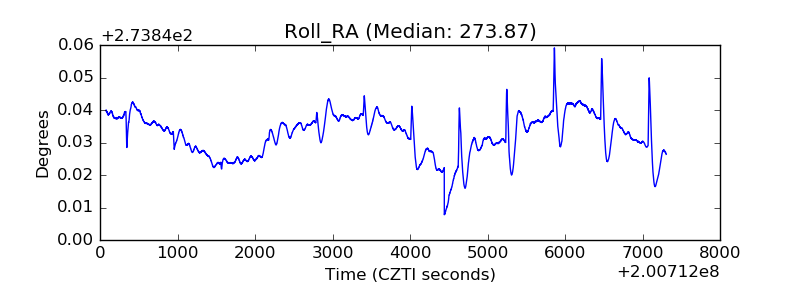 |
| Veto Counter | 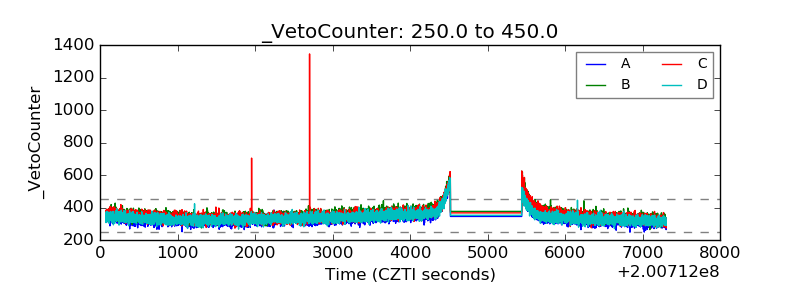 |