| Param | Original file | Final file |
|---|---|---|
| Filename | modeM0/AS1G05_112T01_9000000452_03361cztM0_level2.evt | modeM0/AS1G05_112T01_9000000452_03361cztM0_level2_quad_clean.evt |
| Size (bytes) | 176,725,440 | 42,932,160 |
| Size | 168.5 MB | 40.9 MB |
| Events in quadrant A | 1,272,374 | 278,446 |
| Events in quadrant B | 1,361,067 | 283,230 |
| Events in quadrant C | 1,308,428 | 283,387 |
| Events in quadrant D | 1,226,648 | 263,887 |
| Mode M9 | |||
|---|---|---|---|
| Quadrant | BADHDUFLAG | Total packets | Discarded packets |
| A | 0 | 4 | 0 |
| B | 0 | 4 | 1 |
| C | 0 | 4 | 0 |
| D | 0 | 4 | 0 |
| Mode SS | |||
|---|---|---|---|
| Quadrant | BADHDUFLAG | Total packets | Discarded packets |
| A | 0 | 80 | 22 |
| B | 0 | 79 | 19 |
| C | 0 | 77 | 19 |
| D | 0 | 78 | 22 |
| Mode M0 | |||
|---|---|---|---|
| Quadrant | BADHDUFLAG | Total packets | Discarded packets |
| A | 0 | 7933 | 2323 |
| B | 0 | 8014 | 2272 |
| C | 0 | 7864 | 2181 |
| D | 0 | 8085 | 2504 |
| Quadrant | Total seconds | Saturated seconds | Saturation percentage |
|---|---|---|---|
| A | 2631 | 121 | 4.599012% |
| B | 2663 | 122 | 4.581299% |
| C | 2673 | 75 | 2.805836% |
| D | 2601 | 104 | 3.998462% |
Noise dominated data is calculated using 1-second bins in cleaned event files. If a bin has >2000 counts, and if more than 50% of those come from <1% of pixels, then it is considered to be noise-dominated and hence unusable.
| Quadrant | # 1 sec bins | Bins with >0 counts | Bins with >2000 counts | High rate bins dominated by noise | Noise dominated (total time) | Noise dominated (detector-on time) | Marked lightcurve |
|---|---|---|---|---|---|---|---|
| A | 3619 | 2937 | 0 | 0 | 0.00% | 0.00% | 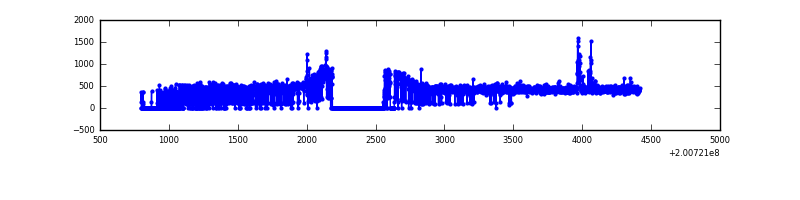 |
| B | 3648 | 2964 | 2 | 2 | 0.05% | 0.07% | 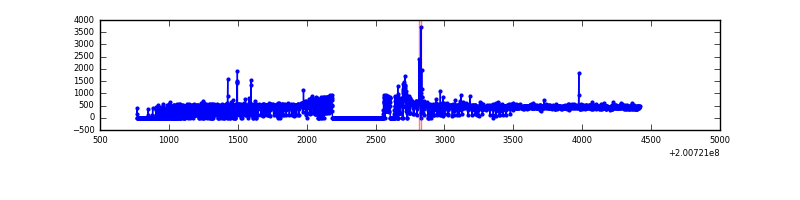 |
| C | 3655 | 2959 | 0 | 0 | 0.00% | 0.00% | 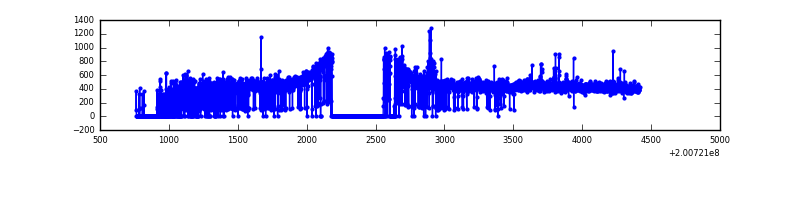 |
| D | 3678 | 2908 | 2 | 2 | 0.05% | 0.07% | 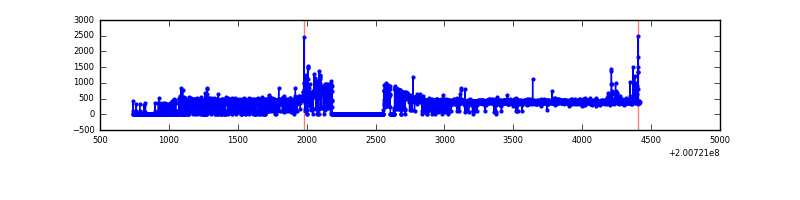 |
Top three noisy pixels from each quadrant. If the there are fewer than three noisy pixels in the level2.evt file, extra rows are filled as -1
| Pixel properties | Quadrant properties | ||||||
|---|---|---|---|---|---|---|---|
| Quadrant | DetID | PixID | Counts | Sigma | Mean | Median | Sigma |
| A | 0 | 50 | 32104 | 464.77 | 321 | 313 | 68.4 |
| A | 12 | 194 | 3390 | 44.98 | 321 | 313 | 68.4 |
| A | 0 | 226 | 3188 | 42.03 | 321 | 313 | 68.4 |
| B | 2 | 249 | 44878 | 676.47 | 327 | 318 | 65.9 |
| B | 15 | 204 | 32173 | 483.6 | 327 | 318 | 65.9 |
| B | 4 | 81 | 8468 | 123.73 | 327 | 318 | 65.9 |
| C | 6 | 80 | 18148 | 230.19 | 322 | 323 | 77.4 |
| C | 1 | 16 | 10765 | 134.85 | 322 | 323 | 77.4 |
| C | 8 | 128 | 8715 | 108.37 | 322 | 323 | 77.4 |
| D | 13 | 223 | 53946 | 698.46 | 309 | 298 | 76.8 |
| D | 14 | 226 | 3448 | 41.01 | 309 | 298 | 76.8 |
| D | 13 | 239 | 2825 | 32.9 | 309 | 298 | 76.8 |
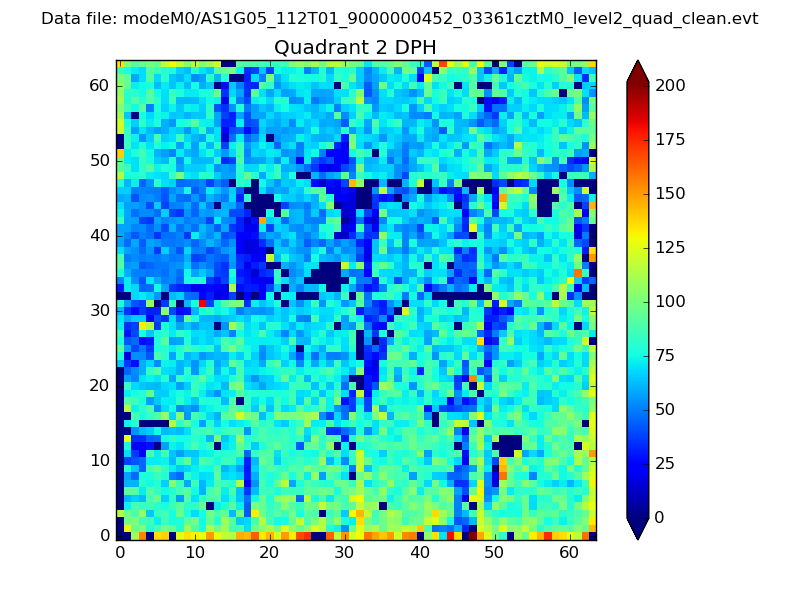
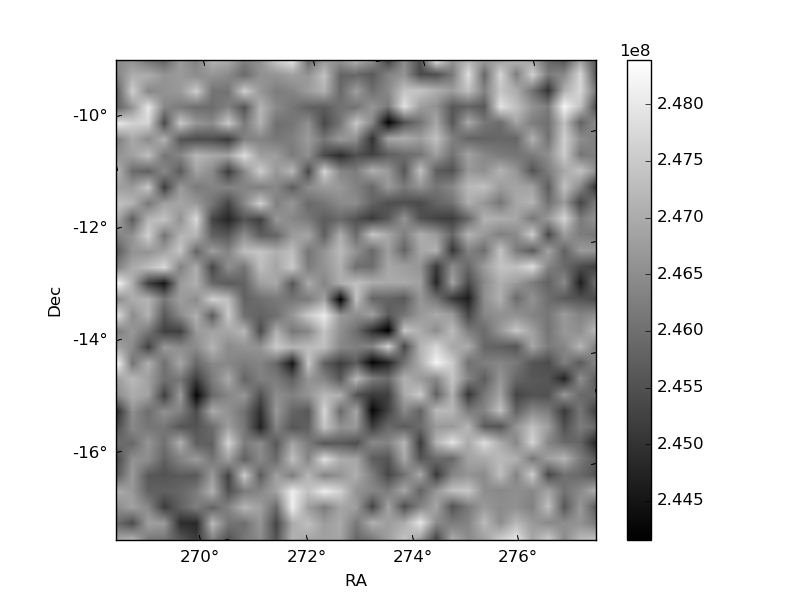
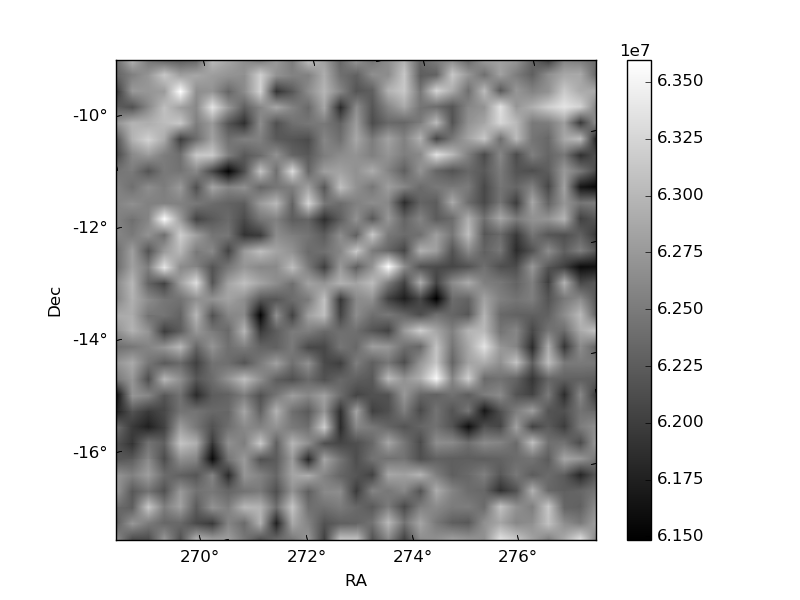
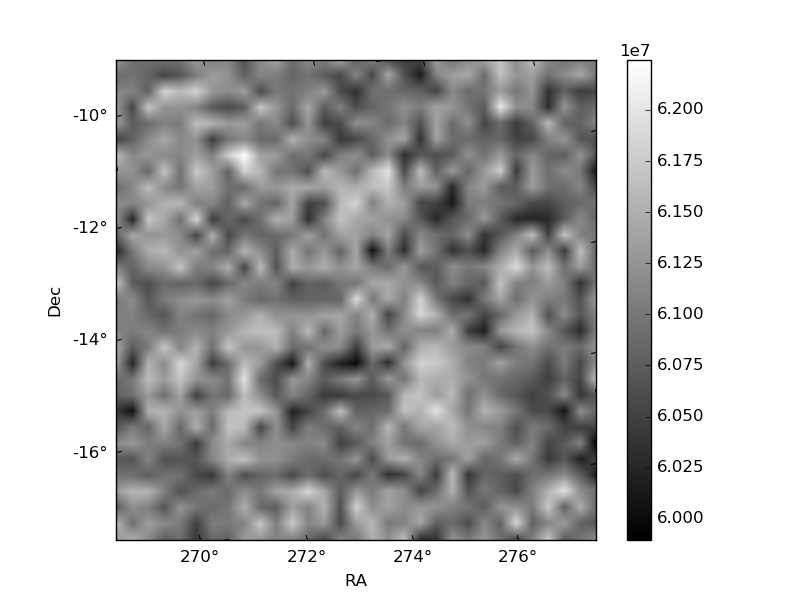
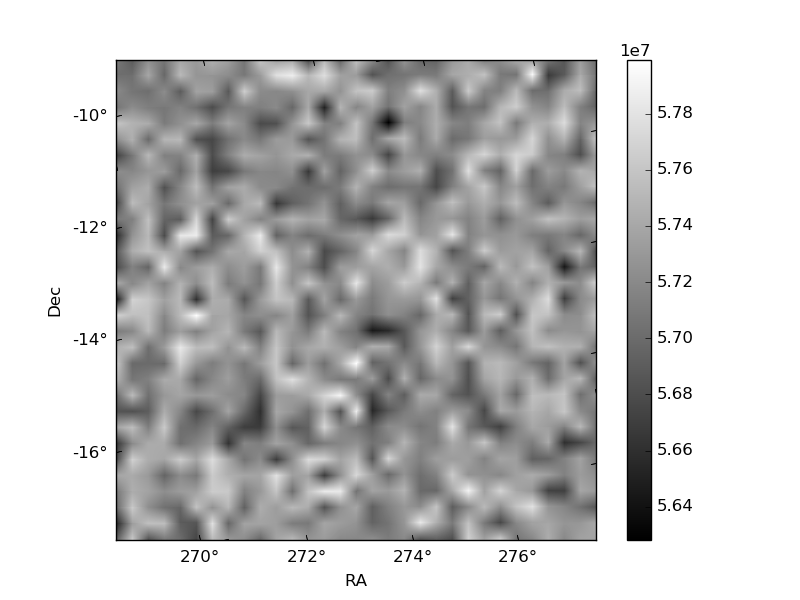
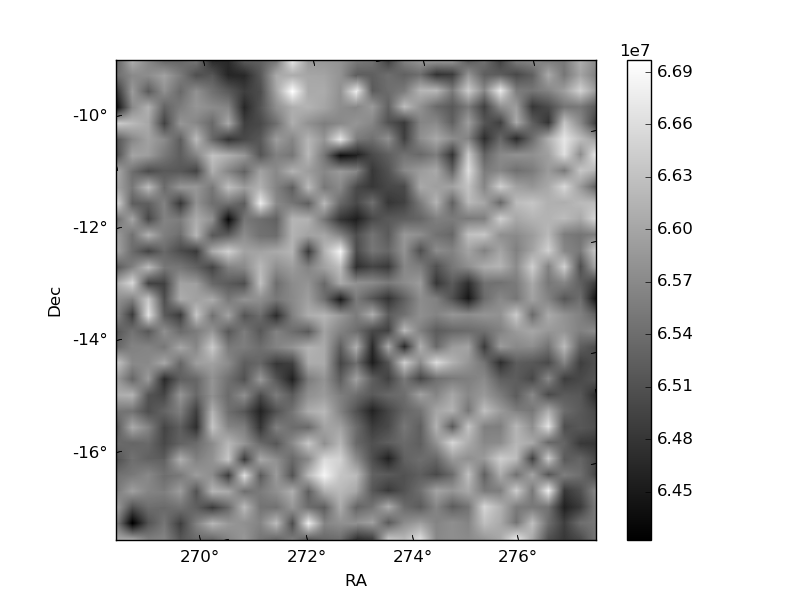
Histogram calculated using DETX and DETY for each event in the final _common_clean file
| Quadrant A | 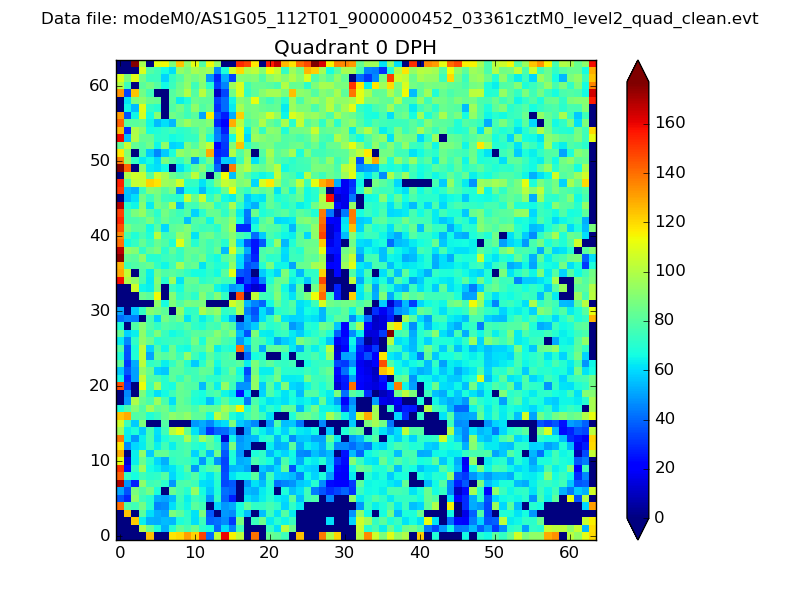 |
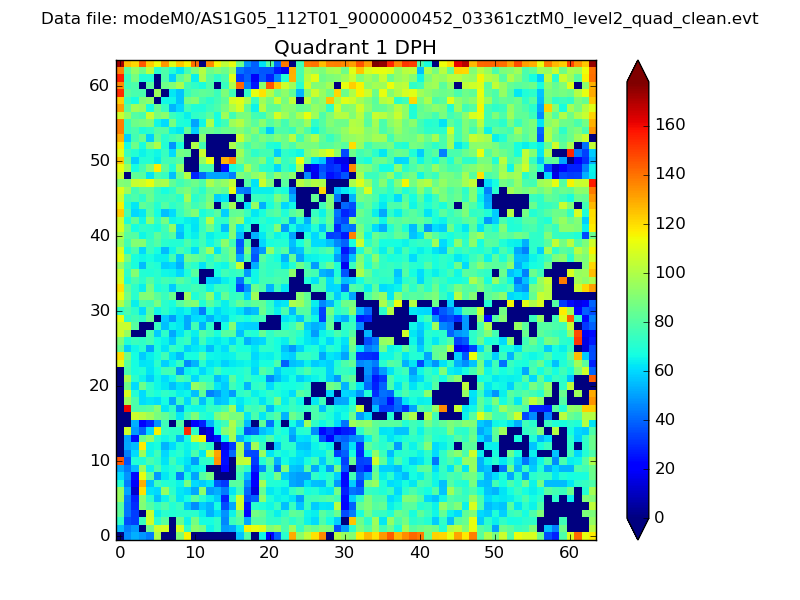 |
Quadrant B |
|---|---|---|---|
| Quadrant D | 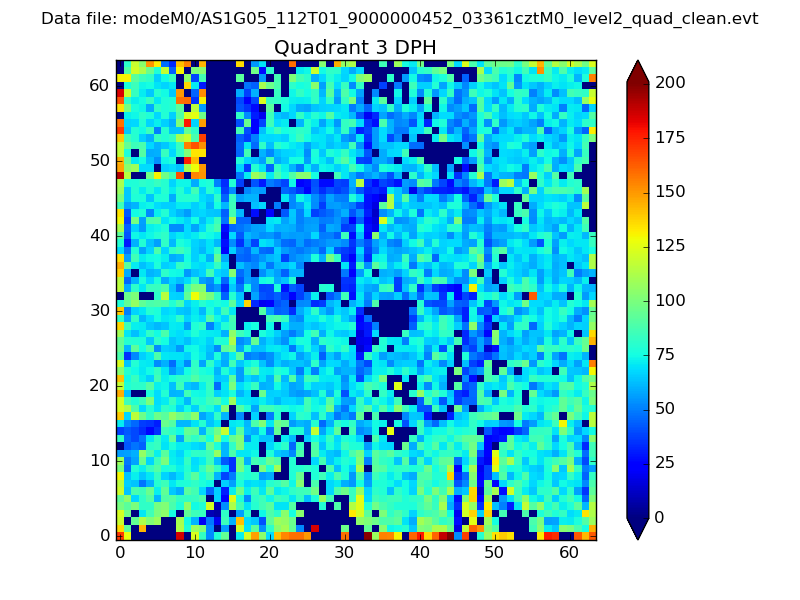 |
 |
Quadrant C |
| Plot type | Count rate plots | Images |
|---|---|---|
| Comparison with Poisson distribution Blue bars denote a histogram of data divided into 1 sec bins. Red curve is a Poisson curve with rate = median count rate of data. |
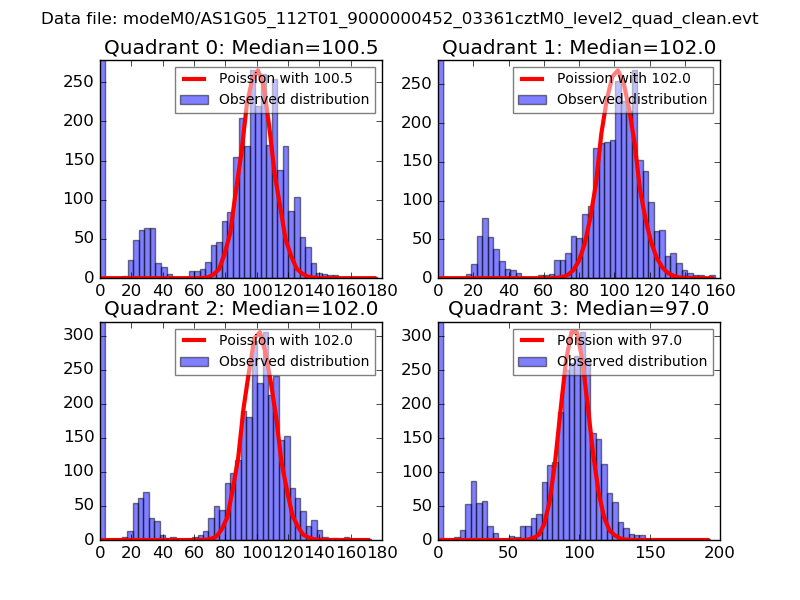 |
 |
| Quadrant-wise count rates Data is divided into 100 sec bins |
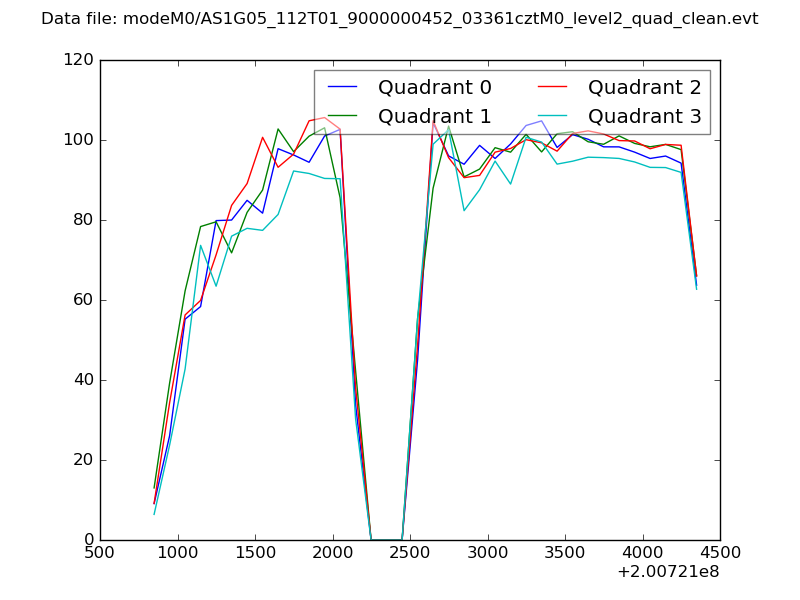 |
|
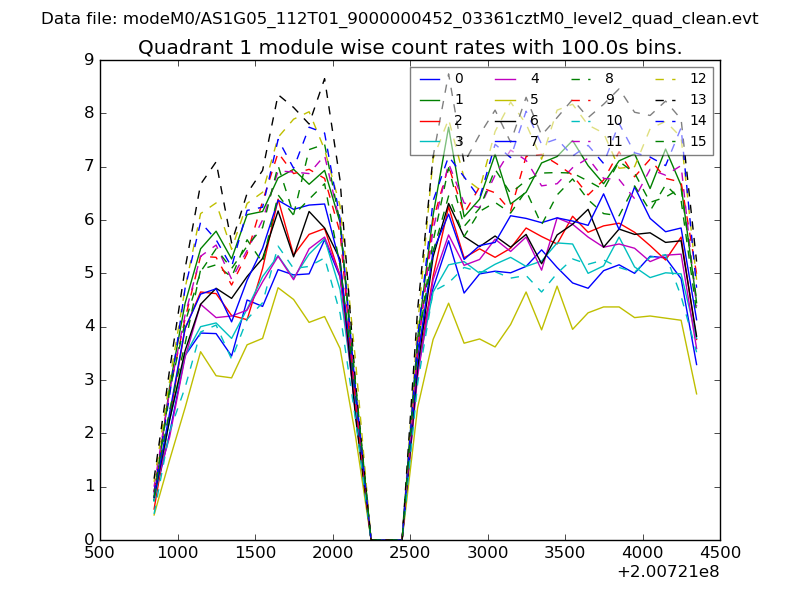
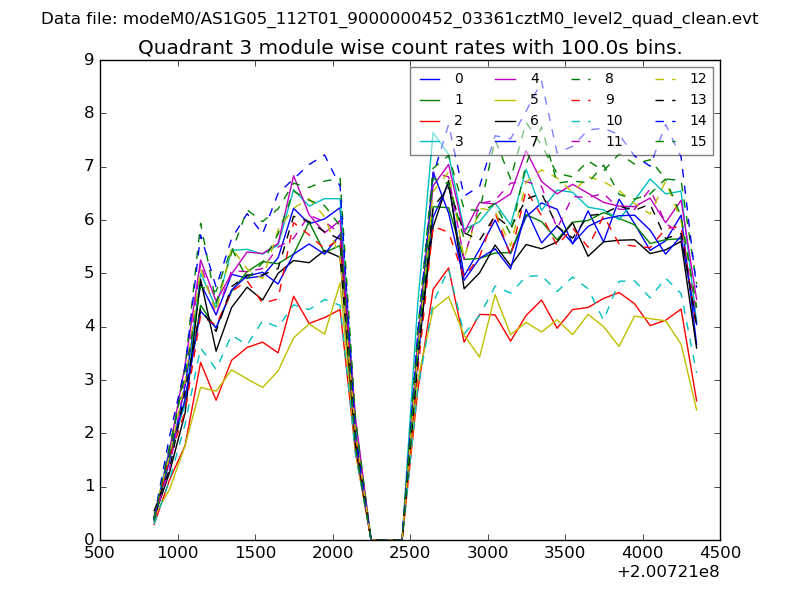
| Module-wise count rates for Quadrant A Data is divided into 100 sec bins |
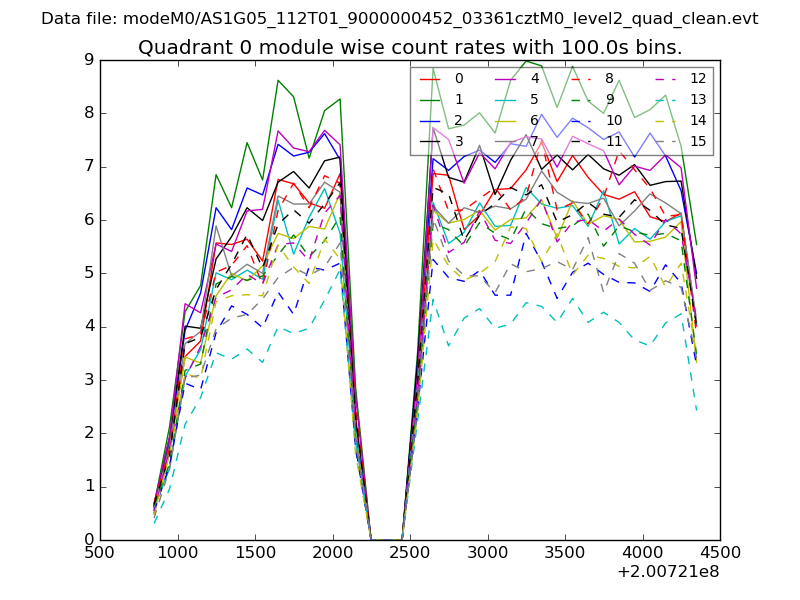 |
 |
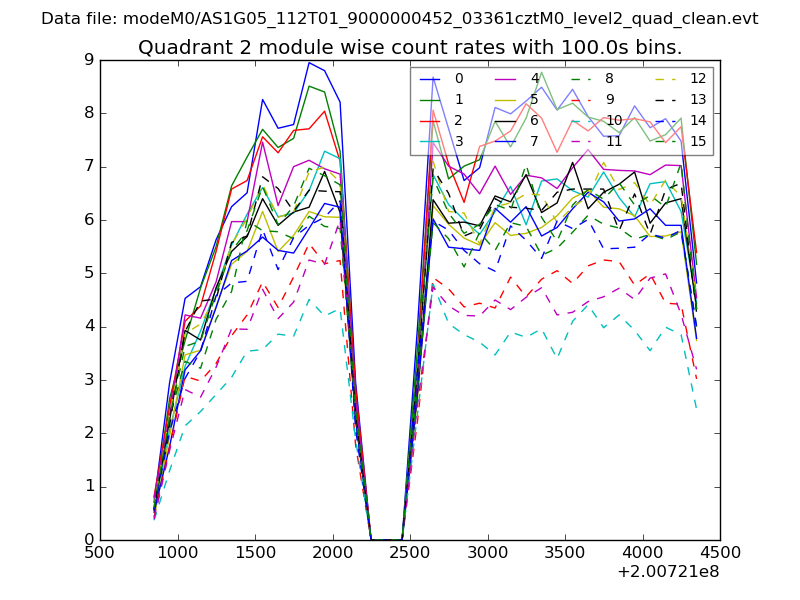
| Module-wise count rates for Quadrant B Data is divided into 100 sec bins |
 |
 |
| Module-wise count rates for Quadrant C Data is divided into 100 sec bins |
 |
 |
| Module-wise count rates for Quadrant D Data is divided into 100 sec bins |
 |
 |
| Parameter | Plot |
|---|---|
| CZT HV Monitor | 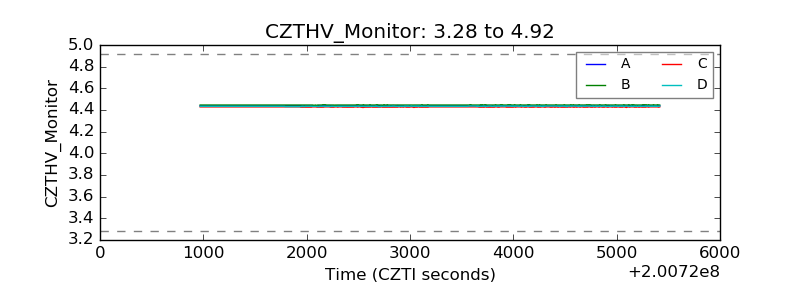 |
| D_VDD | 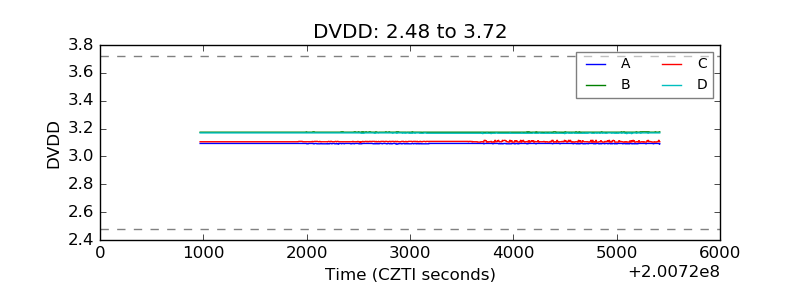 |
| Temperature 1 | 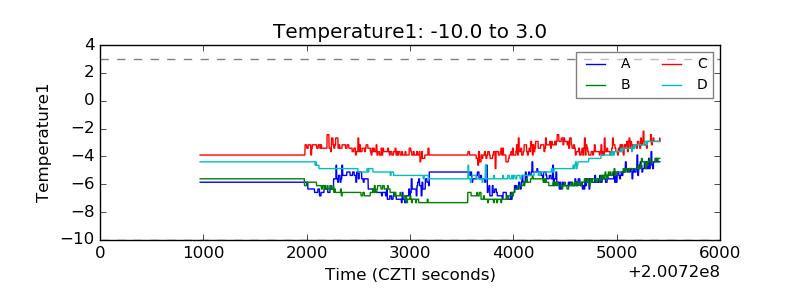 |
| Veto HV Monitor | 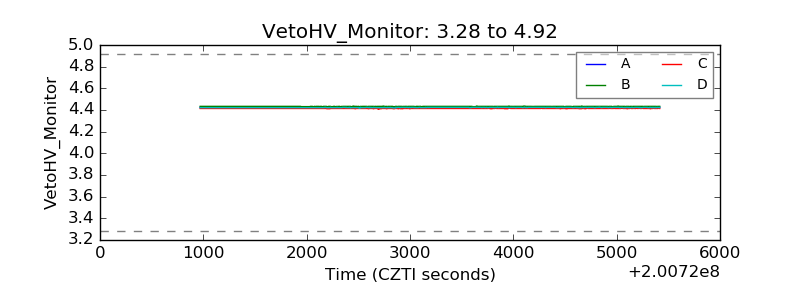 |
| Veto LLD | 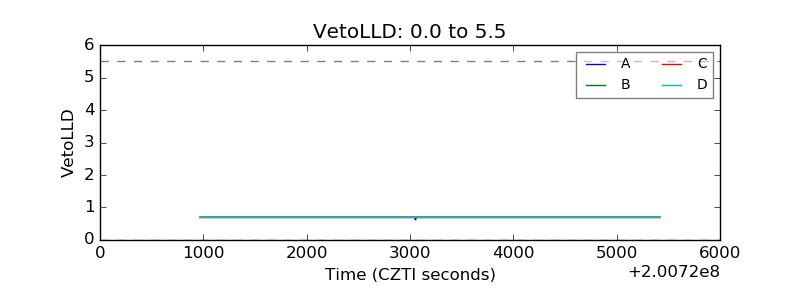 |
| Alpha Counter | 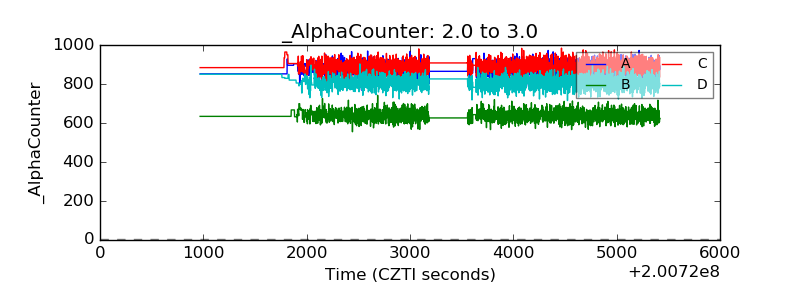 |
| _CPM_Rate | 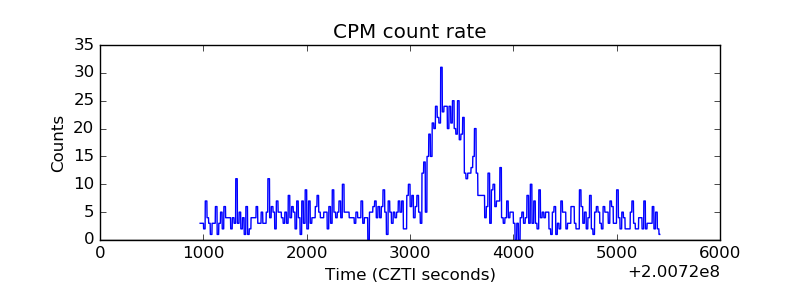 |
| CZT Counter | 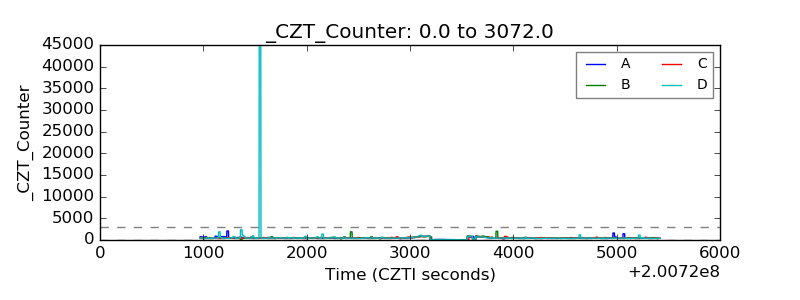 |
| +2.5 Volts monitor | 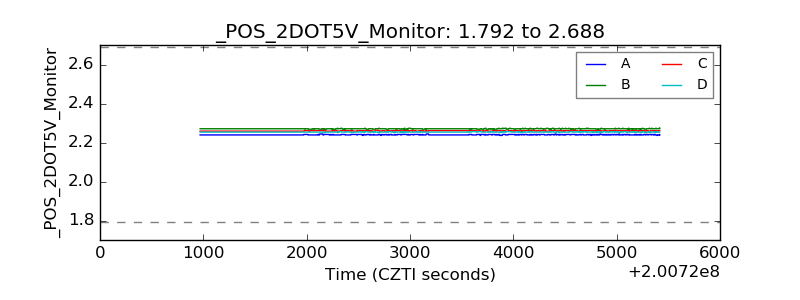 |
| +5 Volts monitor |  |
| _ROLL_ROT | 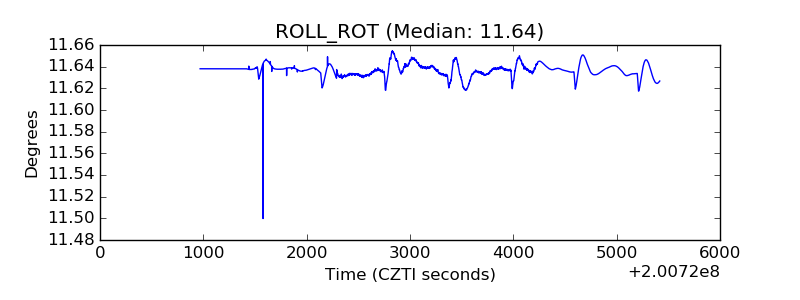 |
| _Roll_DEC | 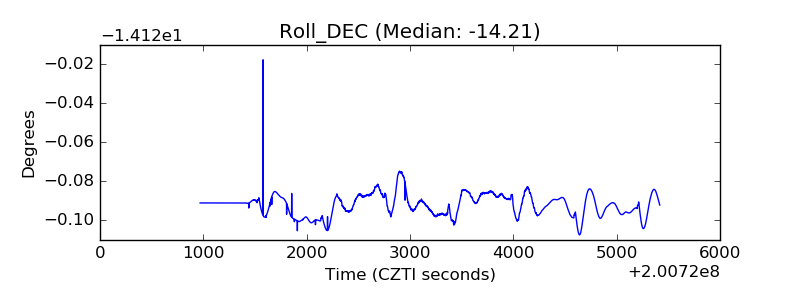 |
| _Roll_RA | 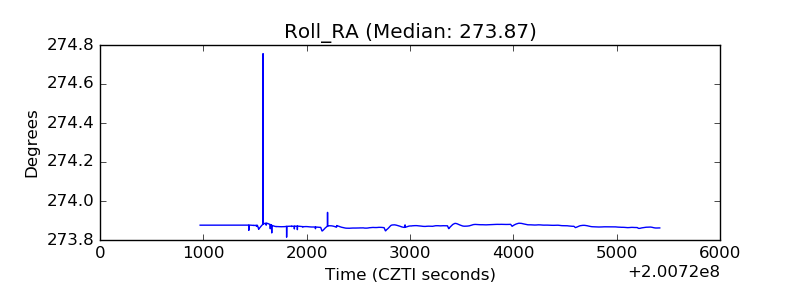 |
| Veto Counter | 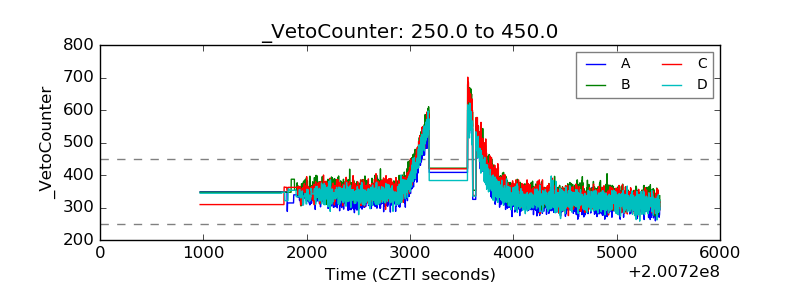 |