| Param | Original file | Final file |
|---|---|---|
| Filename | modeM0/AS1G05_112T01_9000000452_03362cztM0_level2.evt | modeM0/AS1G05_112T01_9000000452_03362cztM0_level2_quad_clean.evt |
| Size (bytes) | 501,577,920 | 85,798,080 |
| Size | 478.3 MB | 81.8 MB |
| Events in quadrant A | 3,694,915 | 519,942 |
| Events in quadrant B | 3,913,661 | 524,139 |
| Events in quadrant C | 3,488,304 | 522,791 |
| Events in quadrant D | 3,575,159 | 500,709 |
| Mode SS | |||
|---|---|---|---|
| Quadrant | BADHDUFLAG | Total packets | Discarded packets |
| A | 0 | 152 | 0 |
| B | 0 | 152 | 0 |
| C | 0 | 152 | 0 |
| D | 0 | 152 | 0 |
| Mode M0 | |||
|---|---|---|---|
| Quadrant | BADHDUFLAG | Total packets | Discarded packets |
| A | 0 | 16458 | 1 |
| B | 0 | 16499 | 0 |
| C | 0 | 15761 | 0 |
| D | 0 | 16417 | 0 |
| Quadrant | Total seconds | Saturated seconds | Saturation percentage |
|---|---|---|---|
| A | 7624 | 278 | 3.646380% |
| B | 7624 | 238 | 3.121721% |
| C | 7624 | 127 | 1.665792% |
| D | 7624 | 178 | 2.334732% |
Noise dominated data is calculated using 1-second bins in cleaned event files. If a bin has >2000 counts, and if more than 50% of those come from <1% of pixels, then it is considered to be noise-dominated and hence unusable.
| Quadrant | # 1 sec bins | Bins with >0 counts | Bins with >2000 counts | High rate bins dominated by noise | Noise dominated (total time) | Noise dominated (detector-on time) | Marked lightcurve |
|---|---|---|---|---|---|---|---|
| A | 7624 | 7624 | 42 | 42 | 0.55% | 0.55% | 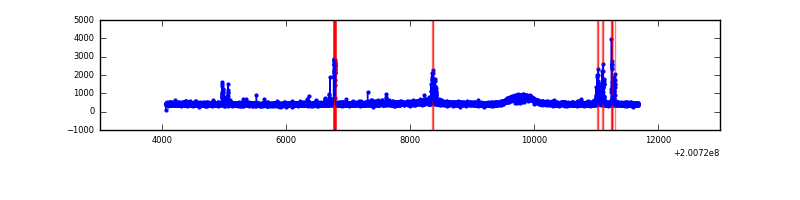 |
| B | 7624 | 7624 | 11 | 11 | 0.14% | 0.14% | 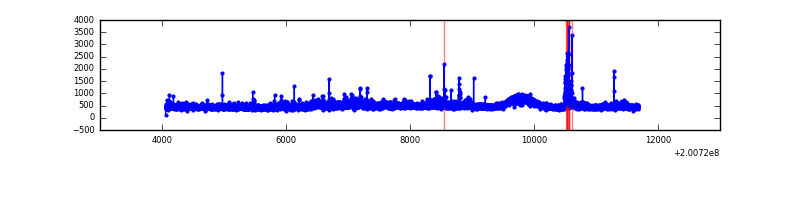 |
| C | 7624 | 7624 | 0 | 0 | 0.00% | 0.00% | 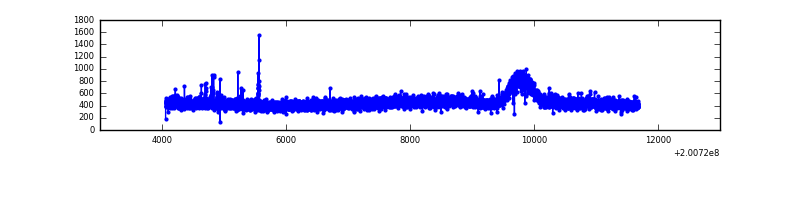 |
| D | 7624 | 7624 | 31 | 31 | 0.41% | 0.41% | 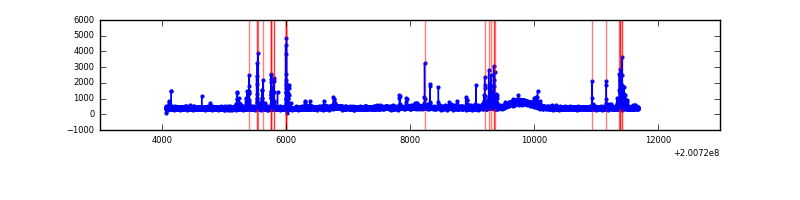 |
Top three noisy pixels from each quadrant. If the there are fewer than three noisy pixels in the level2.evt file, extra rows are filled as -1
| Pixel properties | Quadrant properties | ||||||
|---|---|---|---|---|---|---|---|
| Quadrant | DetID | PixID | Counts | Sigma | Mean | Median | Sigma |
| A | 14 | 249 | 145012 | 778.66 | 888 | 867 | 185.1 |
| A | 0 | 50 | 126095 | 676.47 | 888 | 867 | 185.1 |
| A | 12 | 194 | 9435 | 46.28 | 888 | 867 | 185.1 |
| B | 15 | 204 | 228522 | 1295.04 | 897 | 874 | 175.8 |
| B | 2 | 249 | 119628 | 675.57 | 897 | 874 | 175.8 |
| B | 4 | 81 | 70204 | 394.4 | 897 | 874 | 175.8 |
| C | 8 | 128 | 32981 | 157.01 | 869 | 871 | 204.5 |
| C | 1 | 16 | 13520 | 61.85 | 869 | 871 | 204.5 |
| C | 8 | 144 | 13365 | 61.09 | 869 | 871 | 204.5 |
| D | 13 | 223 | 255033 | 1192.58 | 867 | 838 | 213.1 |
| D | 14 | 156 | 17702 | 79.12 | 867 | 838 | 213.1 |
| D | 2 | 206 | 14655 | 64.82 | 867 | 838 | 213.1 |
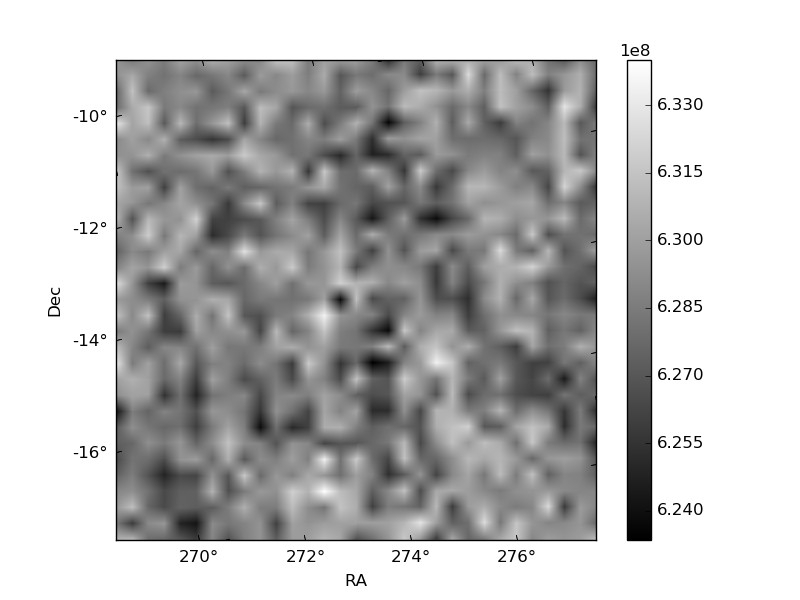
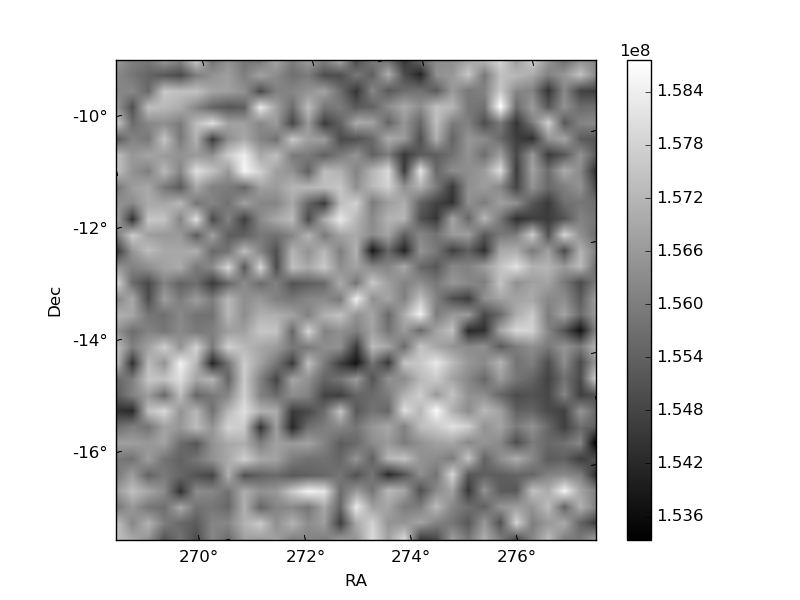
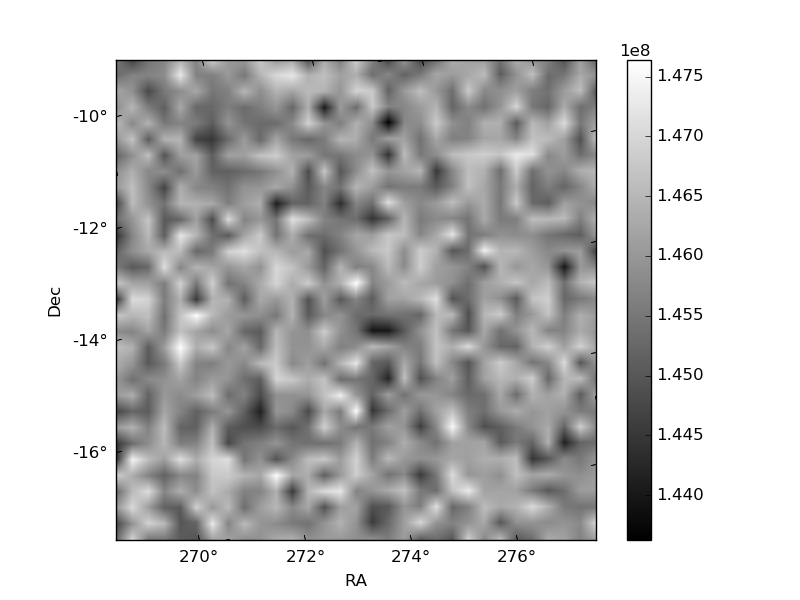
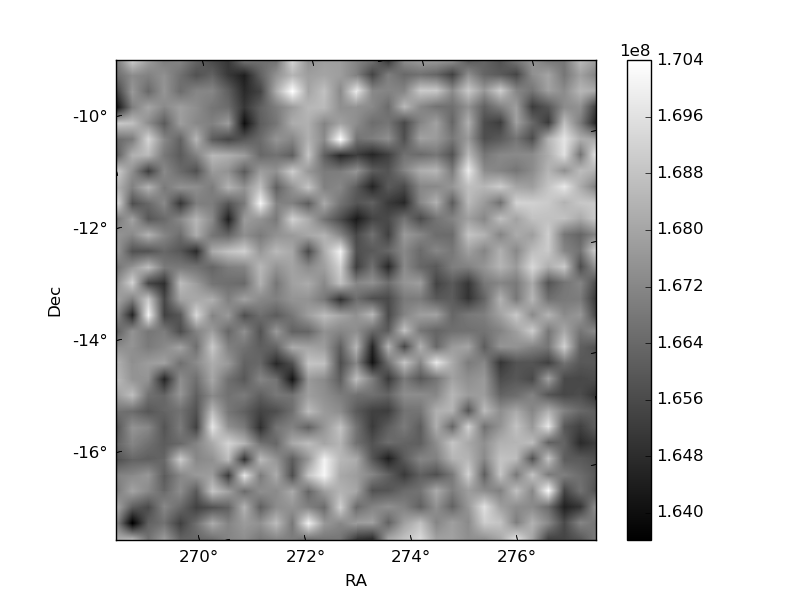
Histogram calculated using DETX and DETY for each event in the final _common_clean file
| Quadrant A | 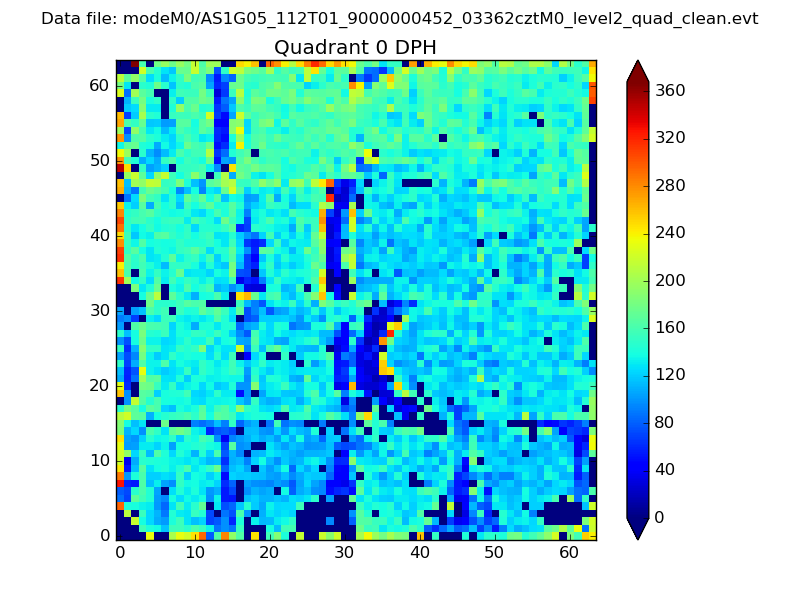 |
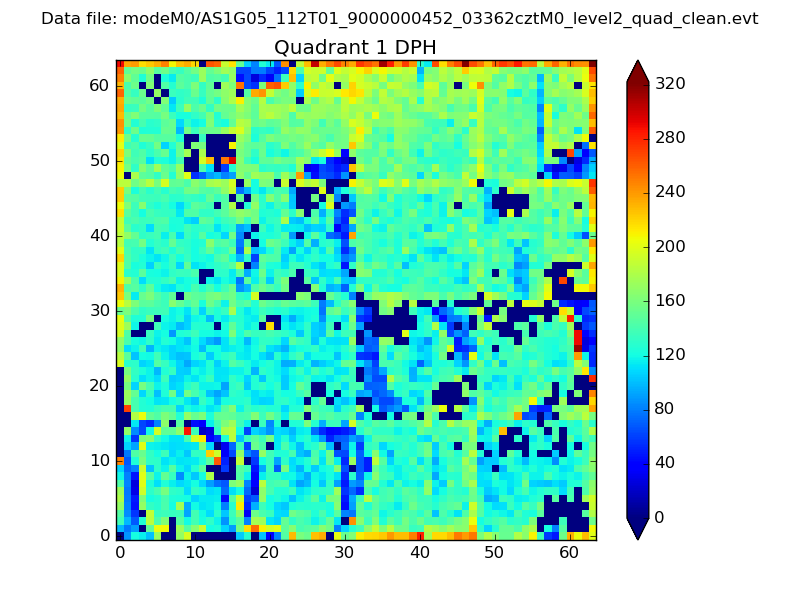 |
Quadrant B |
|---|---|---|---|
| Quadrant D | 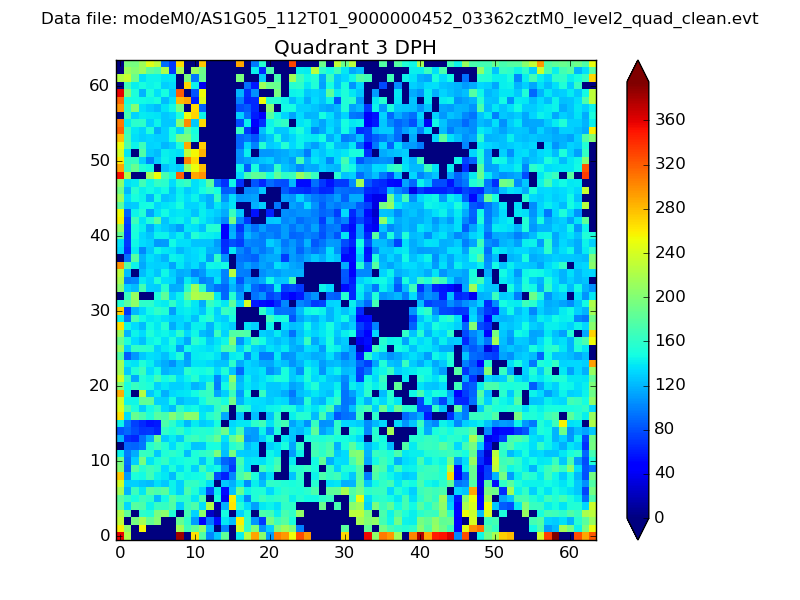 |
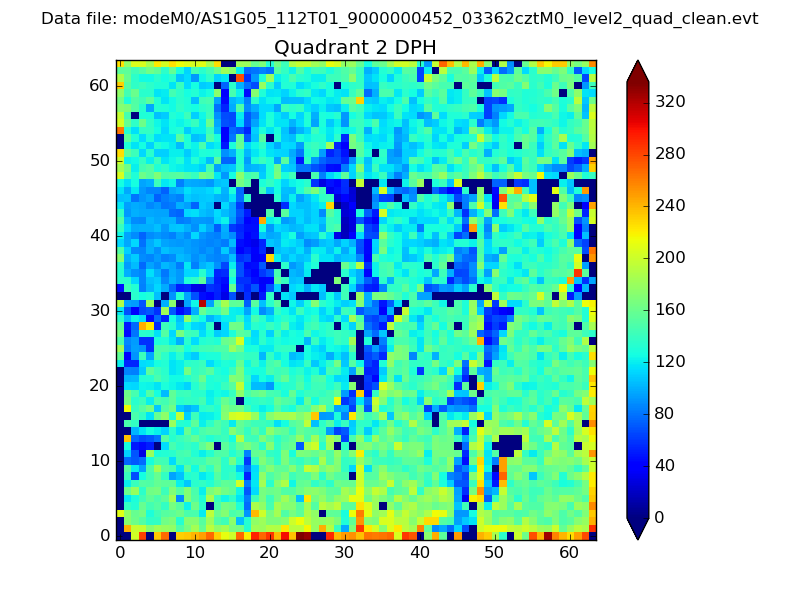 |
Quadrant C |
| Plot type | Count rate plots | Images |
|---|---|---|
| Comparison with Poisson distribution Blue bars denote a histogram of data divided into 1 sec bins. Red curve is a Poisson curve with rate = median count rate of data. |
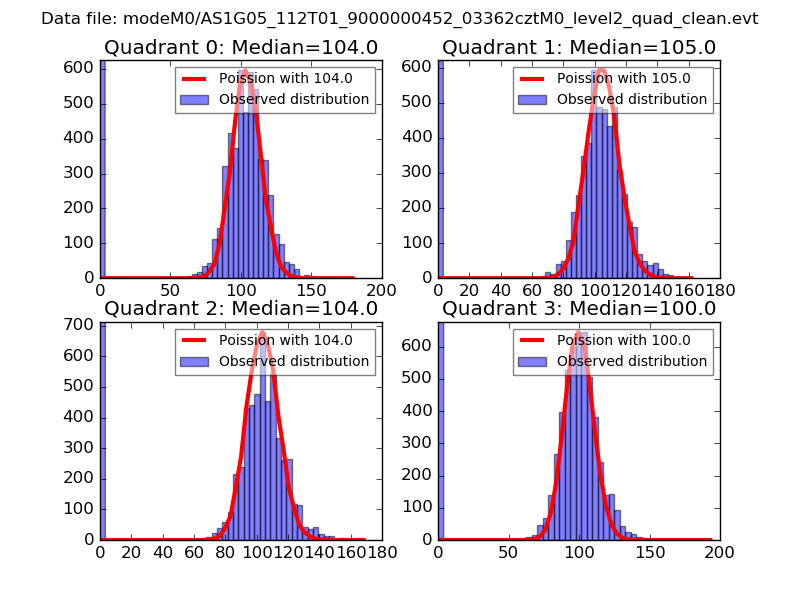 |
 |
| Quadrant-wise count rates Data is divided into 100 sec bins |
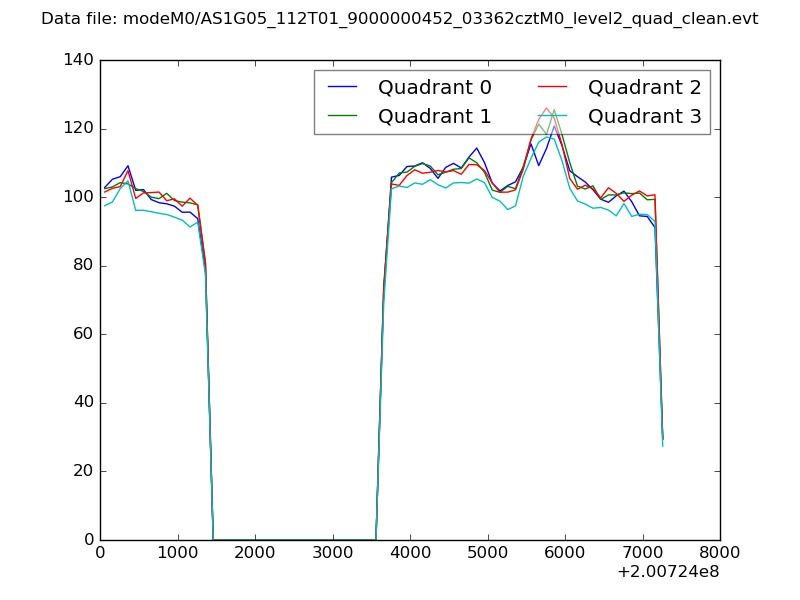 |
|
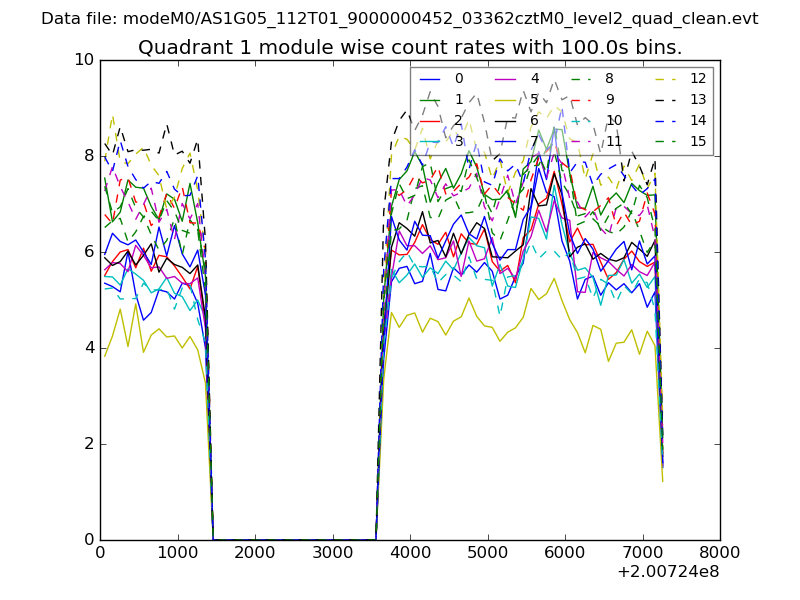
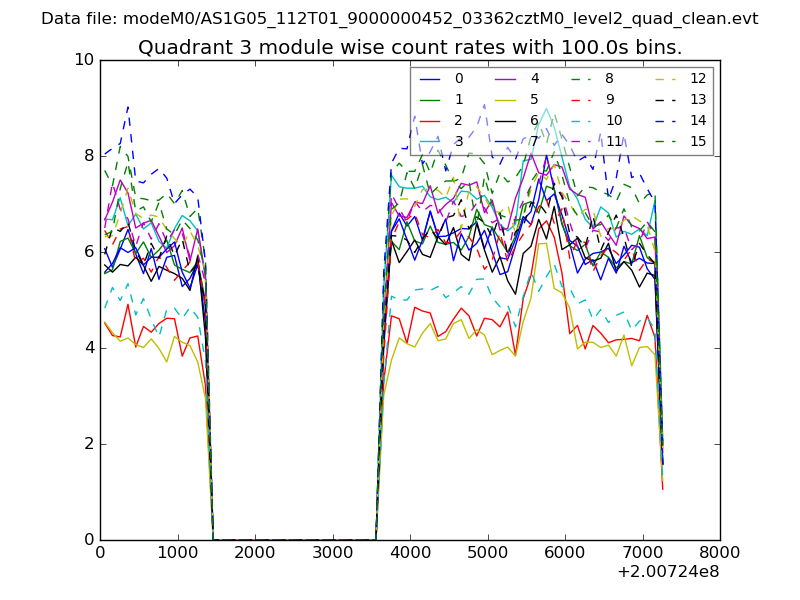
| Module-wise count rates for Quadrant A Data is divided into 100 sec bins |
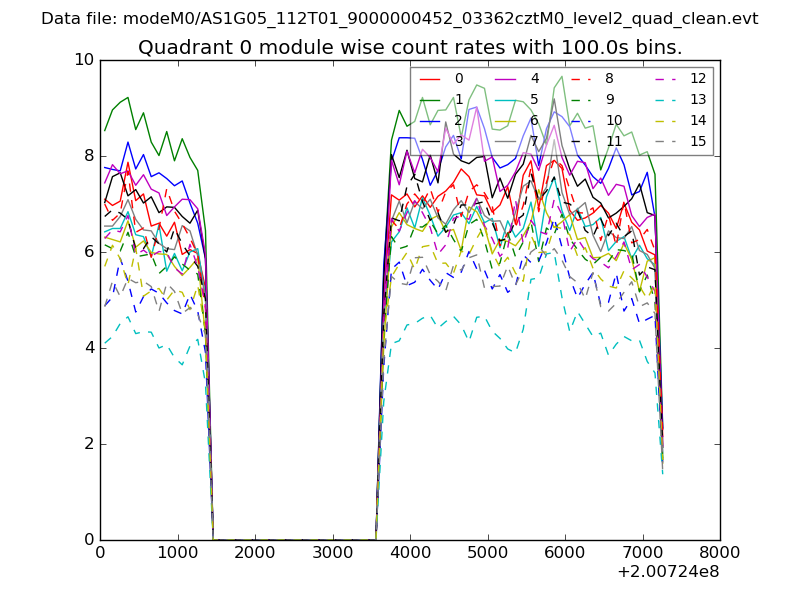 |
 |
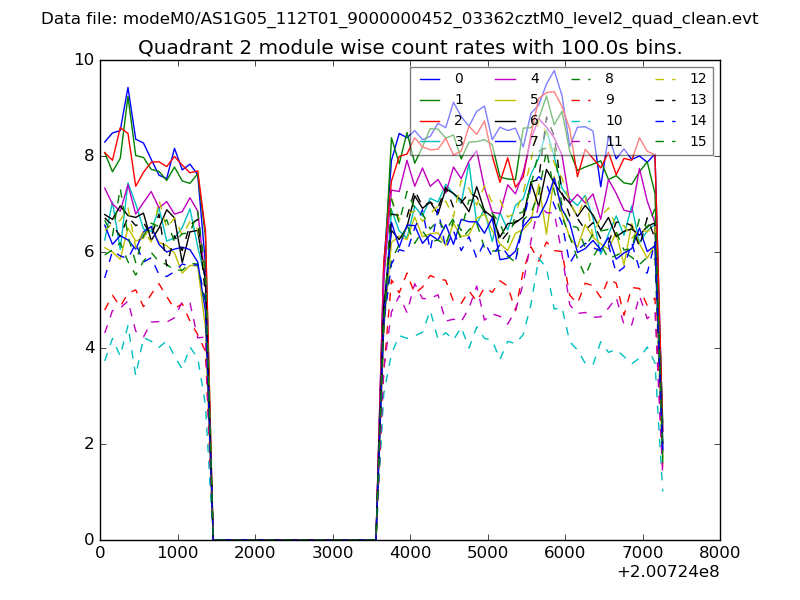
| Module-wise count rates for Quadrant B Data is divided into 100 sec bins |
 |
 |
| Module-wise count rates for Quadrant C Data is divided into 100 sec bins |
 |
 |
| Module-wise count rates for Quadrant D Data is divided into 100 sec bins |
 |
 |
| Parameter | Plot |
|---|---|
| CZT HV Monitor | 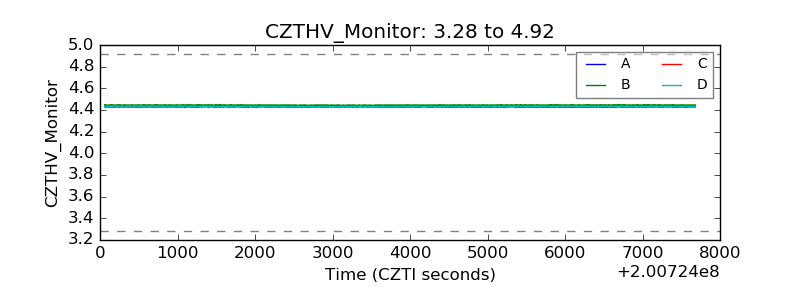 |
| D_VDD | 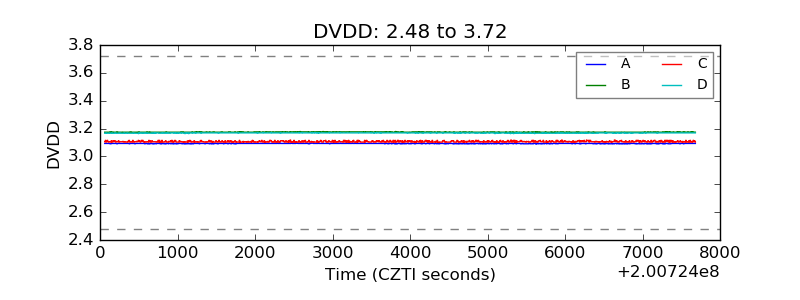 |
| Temperature 1 | 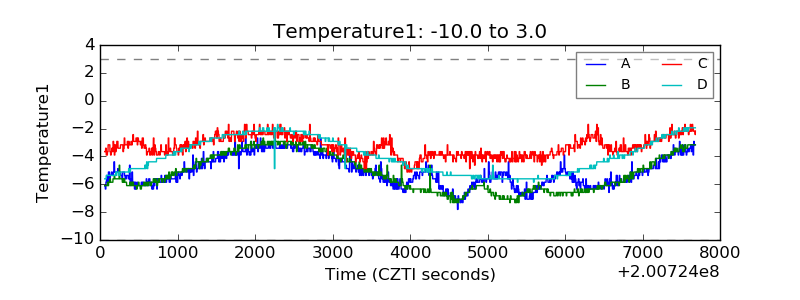 |
| Veto HV Monitor | 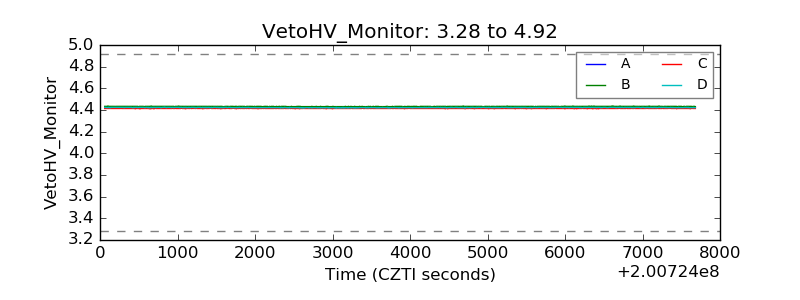 |
| Veto LLD | 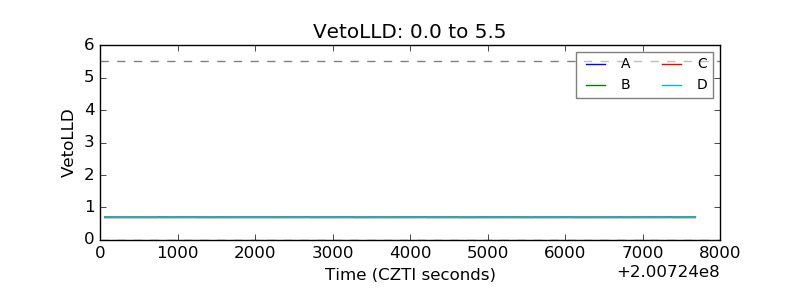 |
| Alpha Counter | 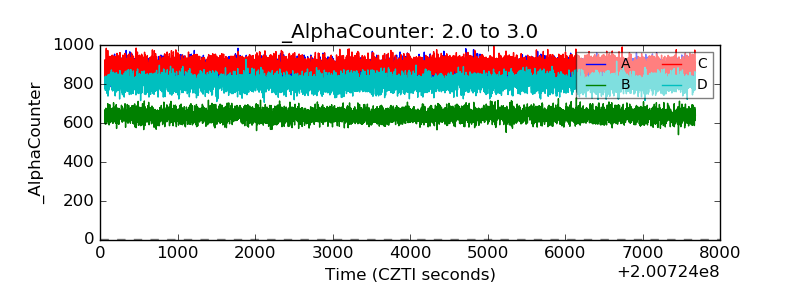 |
| _CPM_Rate | 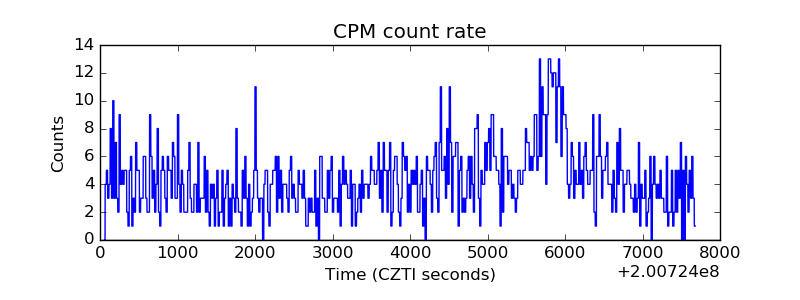 |
| CZT Counter | 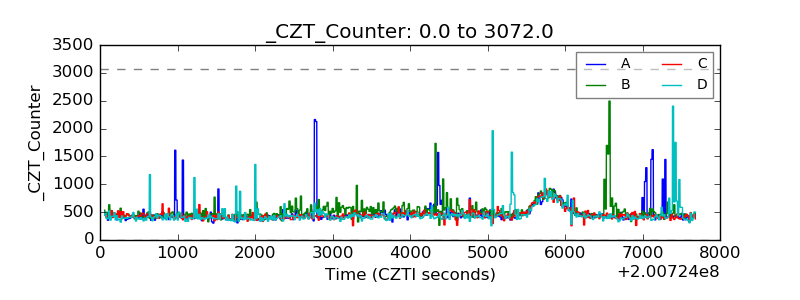 |
| +2.5 Volts monitor | 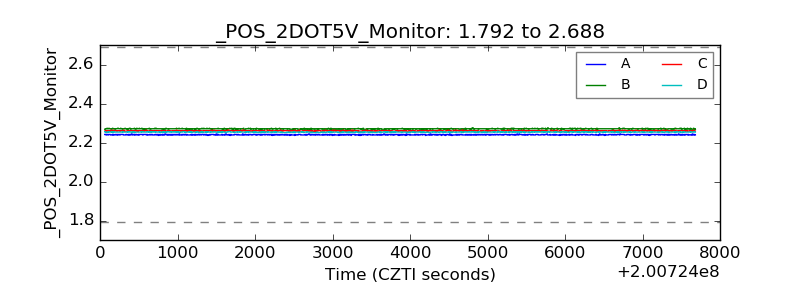 |
| +5 Volts monitor | 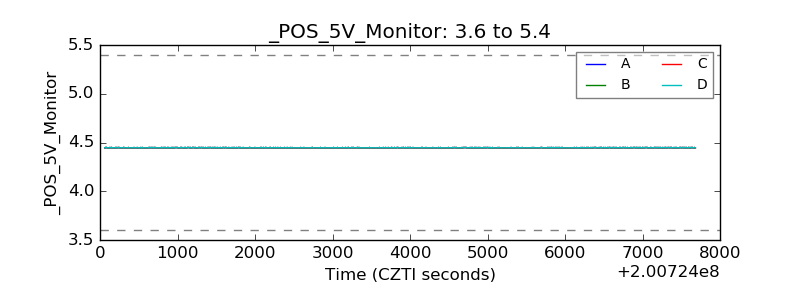 |
| _ROLL_ROT | 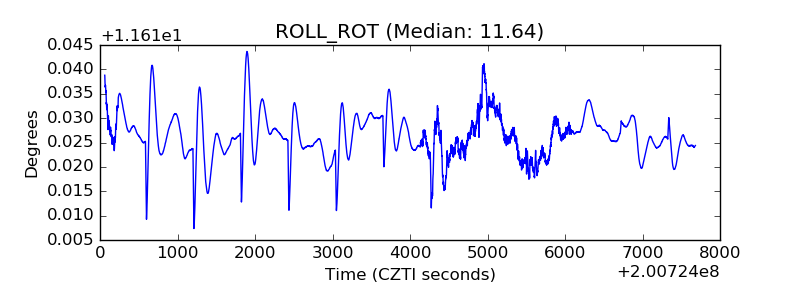 |
| _Roll_DEC | 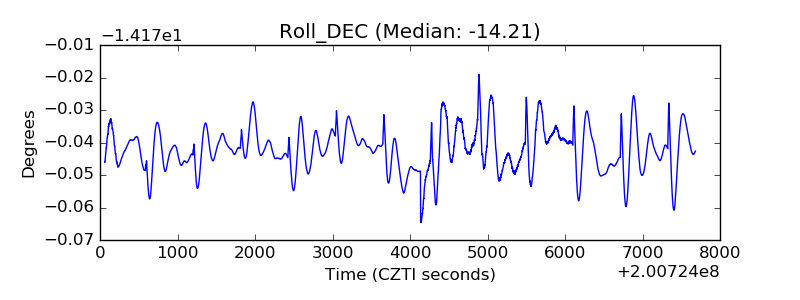 |
| _Roll_RA | 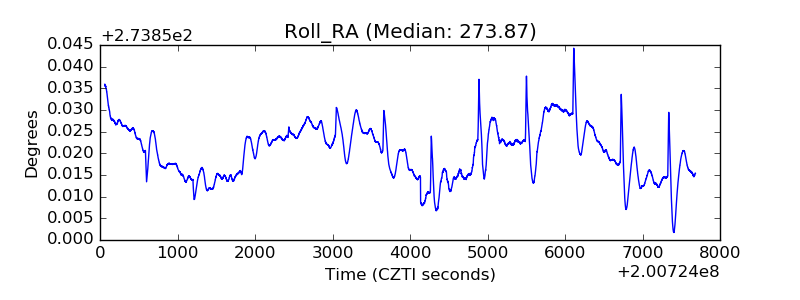 |
| Veto Counter | 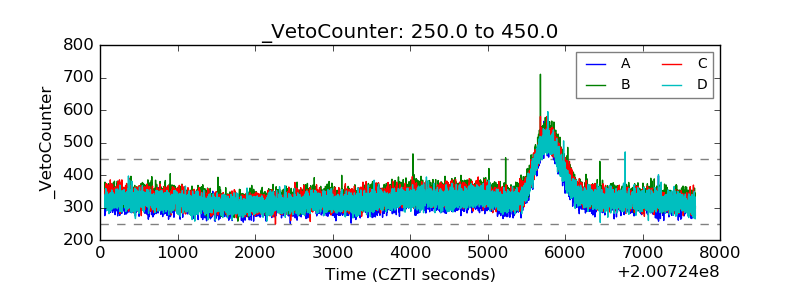 |