| Param | Original file | Final file |
|---|---|---|
| Filename | modeM0/AS1G05_112T01_9000000452_03363cztM0_level2.evt | modeM0/AS1G05_112T01_9000000452_03363cztM0_level2_quad_clean.evt |
| Size (bytes) | 1,218,784,320 | 191,286,720 |
| Size | 1.1 GB | 182.4 MB |
| Events in quadrant A | 9,003,249 | 1,141,509 |
| Events in quadrant B | 9,197,968 | 1,149,884 |
| Events in quadrant C | 8,482,395 | 1,145,485 |
| Events in quadrant D | 8,991,117 | 1,097,166 |
| Mode M9 | |||
|---|---|---|---|
| Quadrant | BADHDUFLAG | Total packets | Discarded packets |
| A | 0 | 5 | 0 |
| B | 0 | 5 | 0 |
| C | 0 | 5 | 0 |
| D | 0 | 5 | 0 |
| Mode SS | |||
|---|---|---|---|
| Quadrant | BADHDUFLAG | Total packets | Discarded packets |
| A | 0 | 368 | 0 |
| B | 0 | 368 | 0 |
| C | 0 | 368 | 0 |
| D | 0 | 368 | 0 |
| Mode M0 | |||
|---|---|---|---|
| Quadrant | BADHDUFLAG | Total packets | Discarded packets |
| A | 0 | 39648 | 6 |
| B | 0 | 38948 | 3 |
| C | 0 | 38119 | 5 |
| D | 0 | 40397 | 6 |
| Quadrant | Total seconds | Saturated seconds | Saturation percentage |
|---|---|---|---|
| A | 18259 | 735 | 4.025412% |
| B | 18260 | 660 | 3.614458% |
| C | 18259 | 433 | 2.371433% |
| D | 18259 | 726 | 3.976121% |
Noise dominated data is calculated using 1-second bins in cleaned event files. If a bin has >2000 counts, and if more than 50% of those come from <1% of pixels, then it is considered to be noise-dominated and hence unusable.
| Quadrant | # 1 sec bins | Bins with >0 counts | Bins with >2000 counts | High rate bins dominated by noise | Noise dominated (total time) | Noise dominated (detector-on time) | Marked lightcurve |
|---|---|---|---|---|---|---|---|
| A | 18950 | 18264 | 74 | 74 | 0.39% | 0.41% | 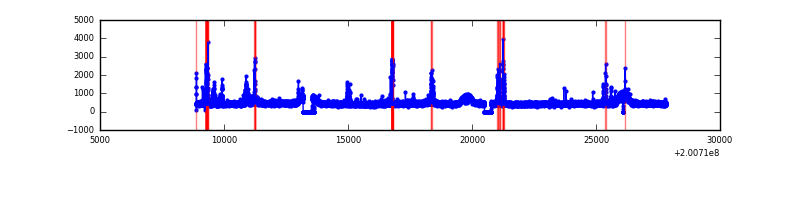 |
| B | 18950 | 18264 | 11 | 11 | 0.06% | 0.06% | 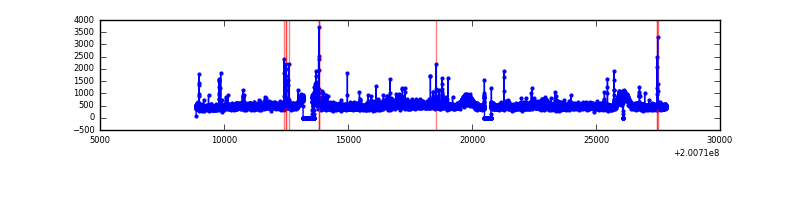 |
| C | 18950 | 18264 | 3 | 3 | 0.02% | 0.02% | 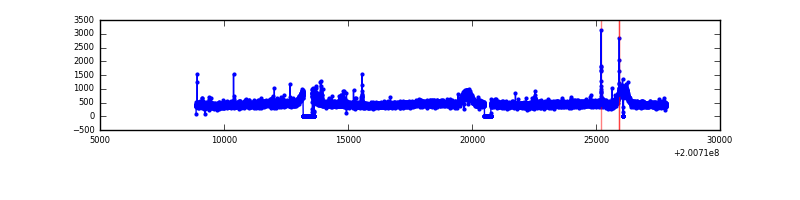 |
| D | 18950 | 18263 | 218 | 218 | 1.15% | 1.19% | 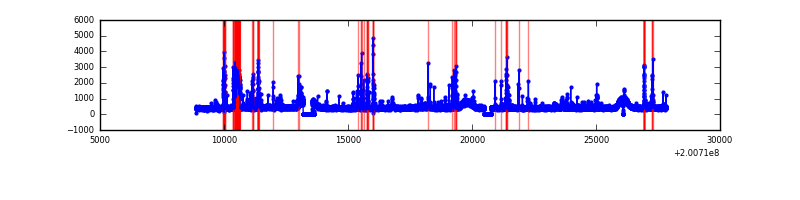 |
Top three noisy pixels from each quadrant. If the there are fewer than three noisy pixels in the level2.evt file, extra rows are filled as -1
| Pixel properties | Quadrant properties | ||||||
|---|---|---|---|---|---|---|---|
| Quadrant | DetID | PixID | Counts | Sigma | Mean | Median | Sigma |
| A | 14 | 249 | 408353 | 916.39 | 2158 | 2107 | 443.3 |
| A | 0 | 50 | 243866 | 545.35 | 2158 | 2107 | 443.3 |
| A | 0 | 226 | 22952 | 47.02 | 2158 | 2107 | 443.3 |
| B | 15 | 204 | 468093 | 1096.86 | 2182 | 2129 | 424.8 |
| B | 2 | 249 | 103646 | 238.97 | 2182 | 2129 | 424.8 |
| B | 4 | 81 | 88647 | 203.66 | 2182 | 2129 | 424.8 |
| C | 8 | 128 | 52692 | 102.2 | 2115 | 2127 | 494.7 |
| C | 1 | 16 | 25731 | 47.71 | 2115 | 2127 | 494.7 |
| C | 6 | 80 | 23594 | 43.39 | 2115 | 2127 | 494.7 |
| D | 13 | 223 | 534291 | 1044.65 | 2100 | 2030 | 509.5 |
| D | 12 | 33 | 376537 | 735.03 | 2100 | 2030 | 509.5 |
| D | 14 | 156 | 61231 | 116.19 | 2100 | 2030 | 509.5 |
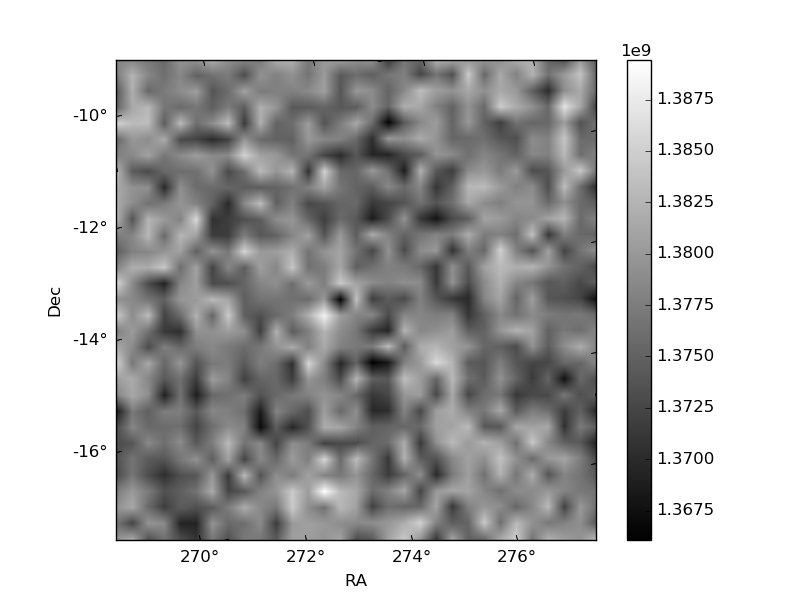
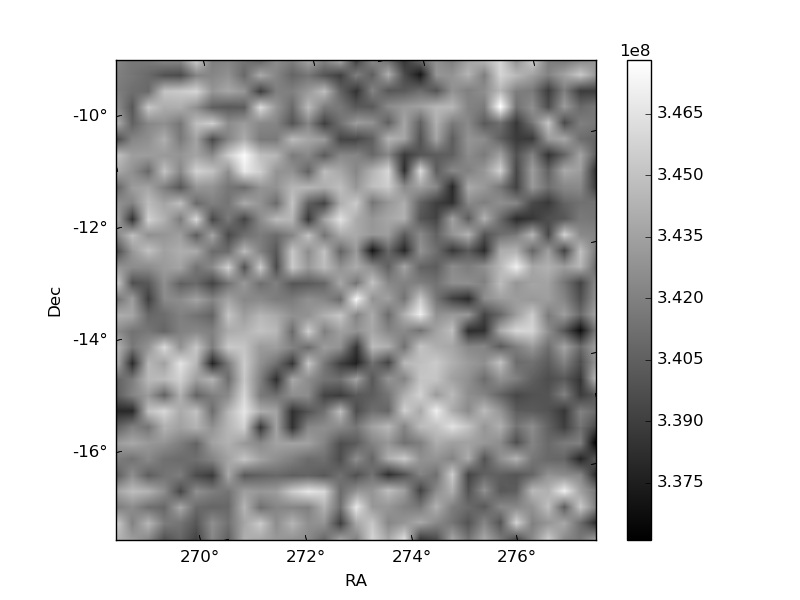
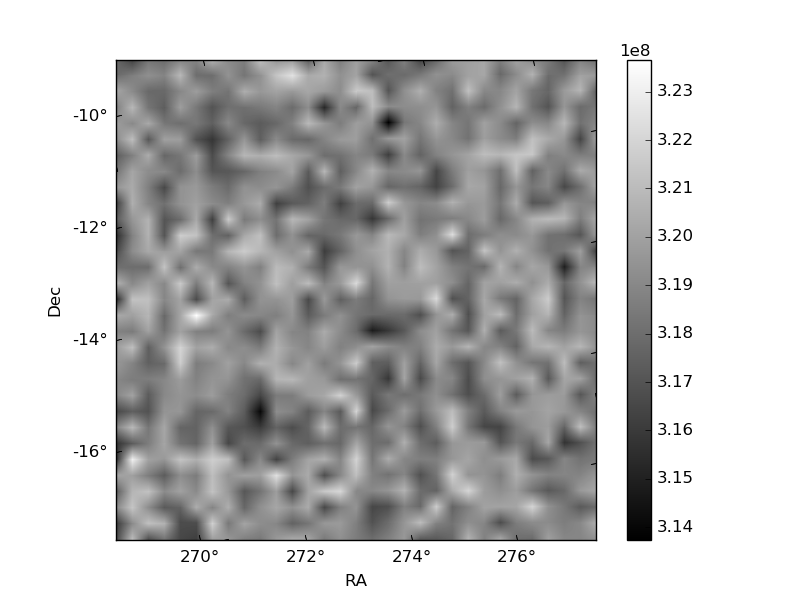
Histogram calculated using DETX and DETY for each event in the final _common_clean file
| Quadrant A |  |
 |
Quadrant B |
|---|---|---|---|
| Quadrant D |  |
 |
Quadrant C |
| Plot type | Count rate plots | Images |
|---|---|---|
| Comparison with Poisson distribution Blue bars denote a histogram of data divided into 1 sec bins. Red curve is a Poisson curve with rate = median count rate of data. |
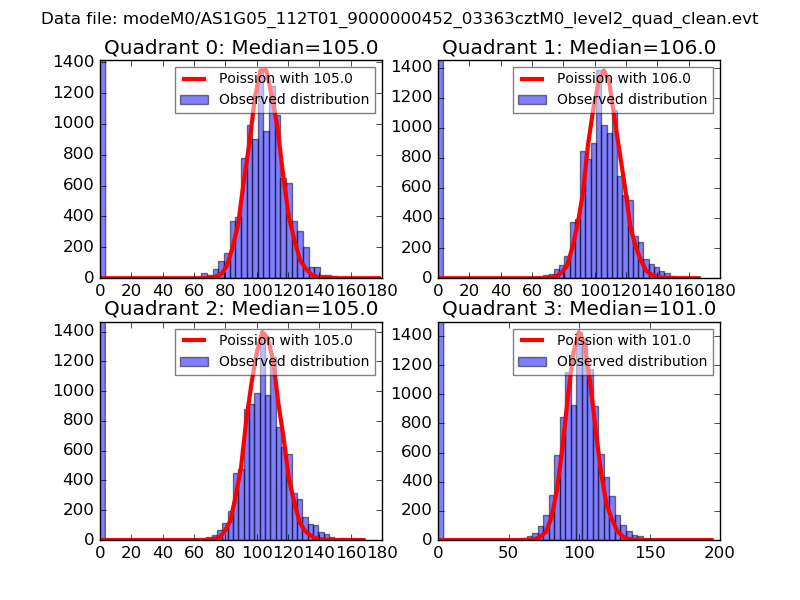 |
 |
| Quadrant-wise count rates Data is divided into 100 sec bins |
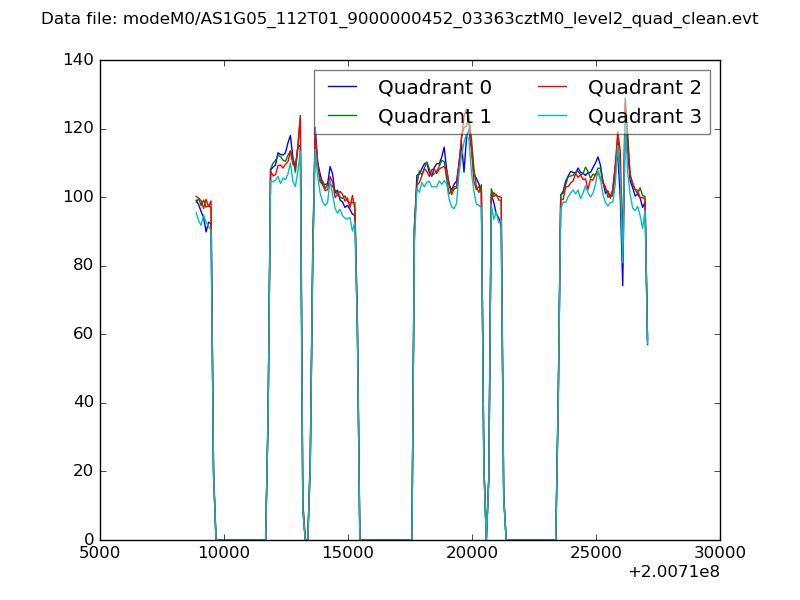 |
|
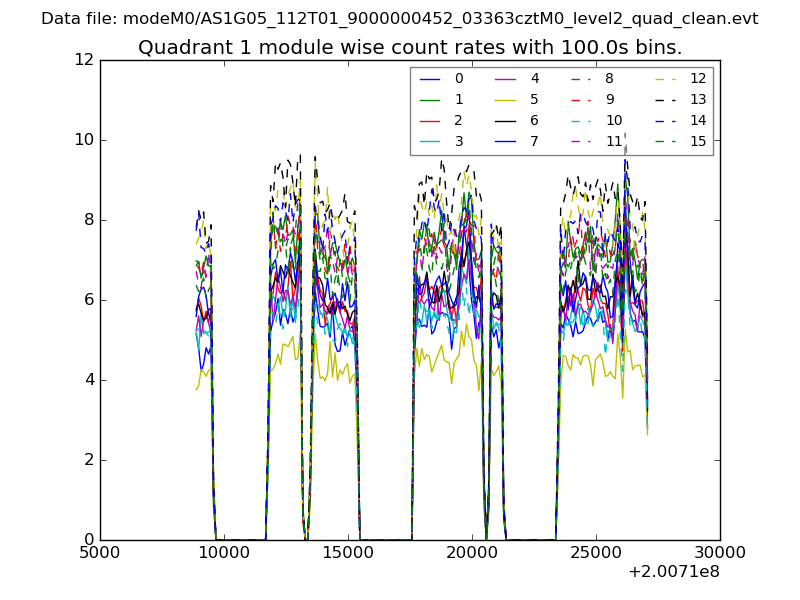
| Module-wise count rates for Quadrant A Data is divided into 100 sec bins |
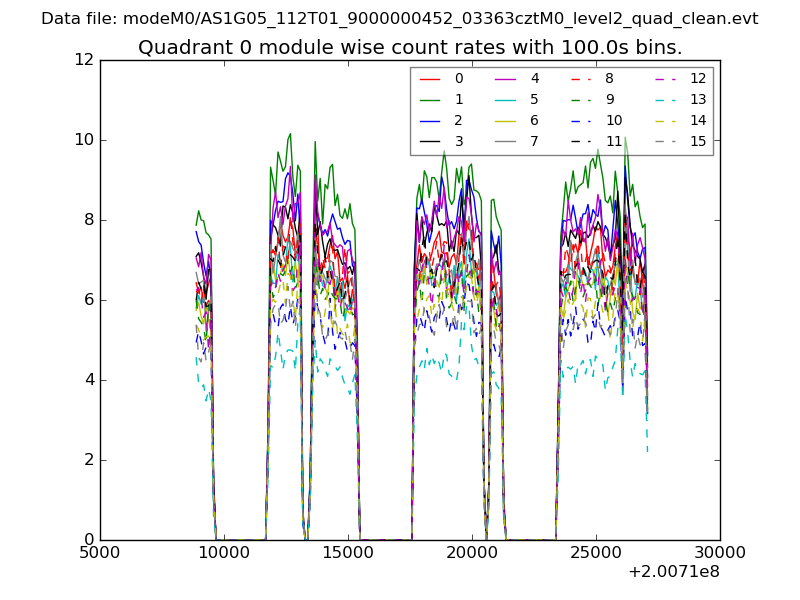 |
 |
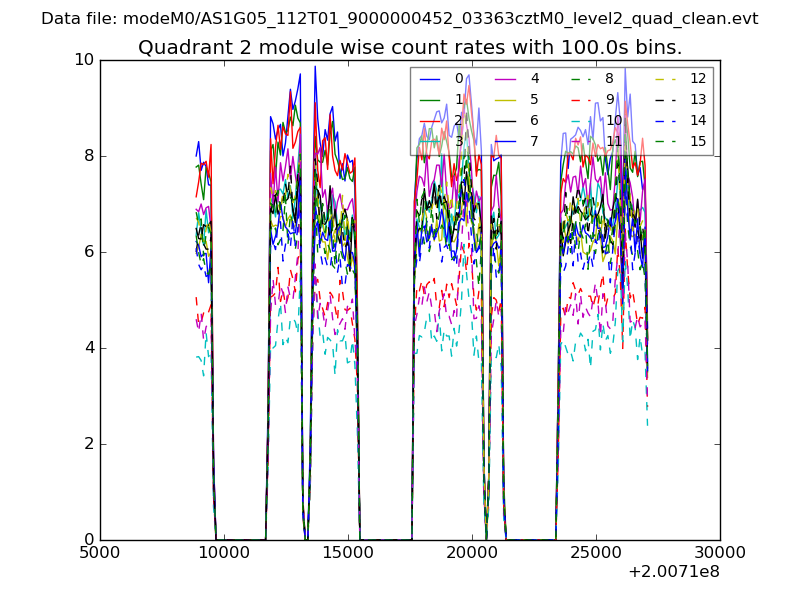
| Module-wise count rates for Quadrant B Data is divided into 100 sec bins |
 |
 |
| Module-wise count rates for Quadrant C Data is divided into 100 sec bins |
 |
 |
| Module-wise count rates for Quadrant D Data is divided into 100 sec bins |
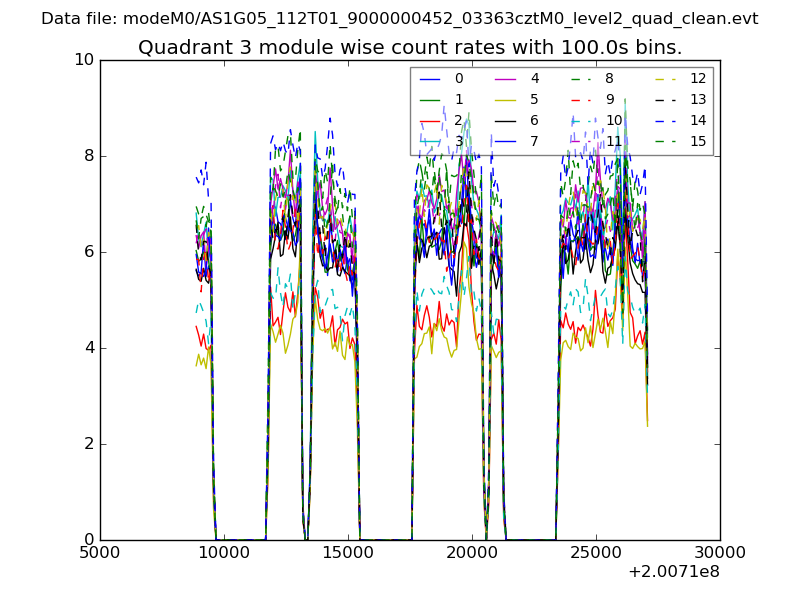 |
 |
| Parameter | Plot |
|---|---|
| CZT HV Monitor | 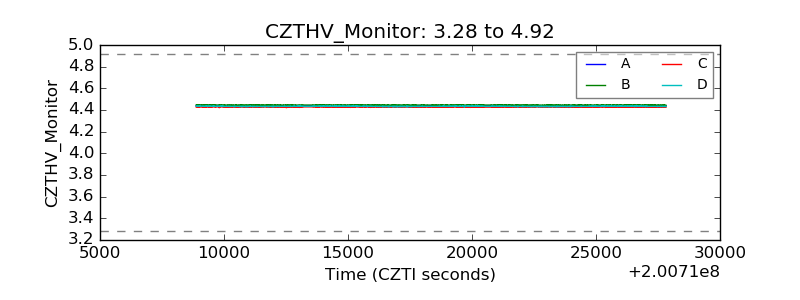 |
| D_VDD | 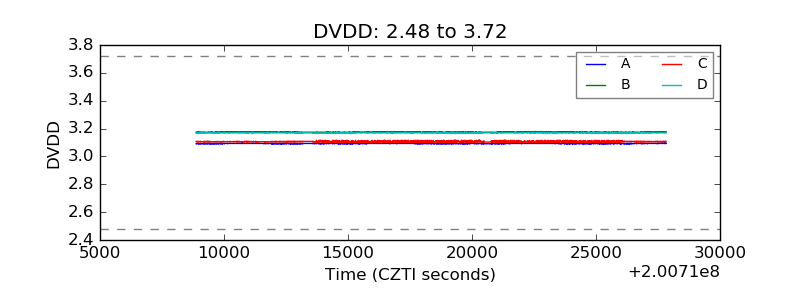 |
| Temperature 1 | 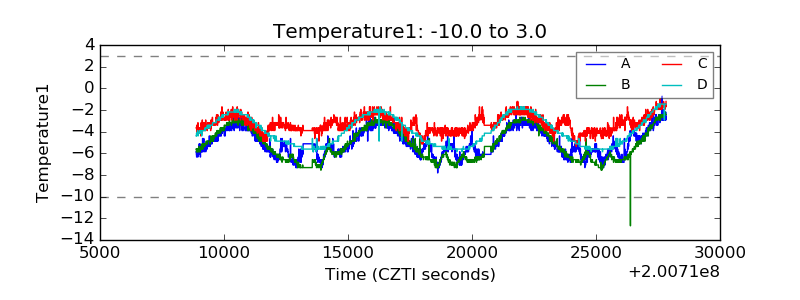 |
| Veto HV Monitor | 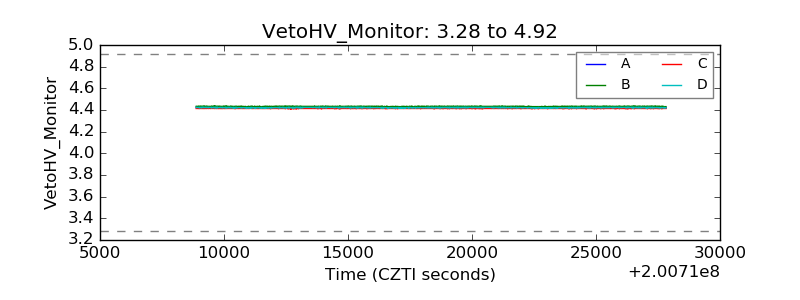 |
| Veto LLD | 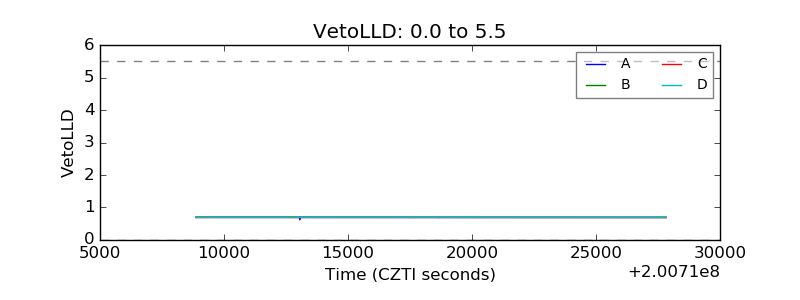 |
| Alpha Counter | 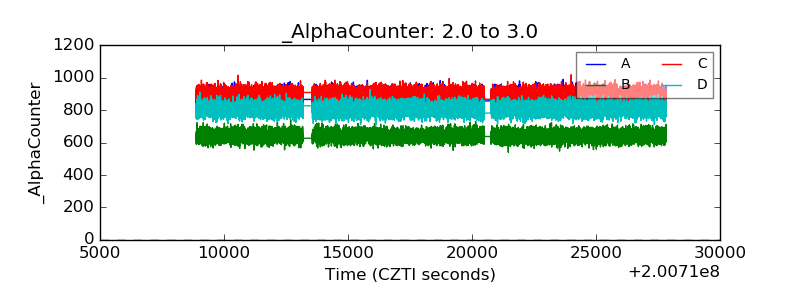 |
| _CPM_Rate | 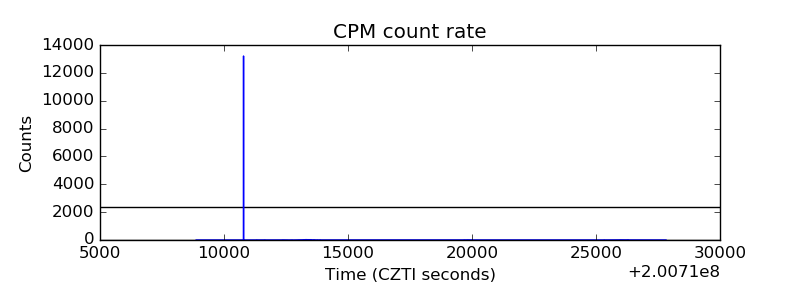 |
| CZT Counter |  |
| +2.5 Volts monitor |  |
| +5 Volts monitor |  |
| _ROLL_ROT | 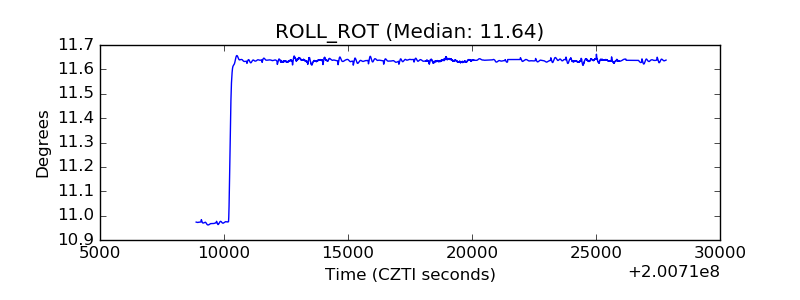 |
| _Roll_DEC | 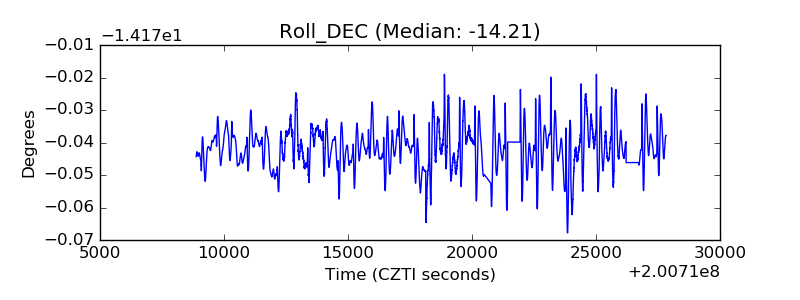 |
| _Roll_RA | 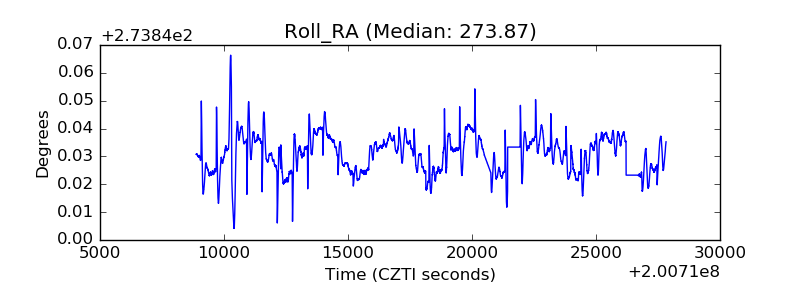 |
| Veto Counter | 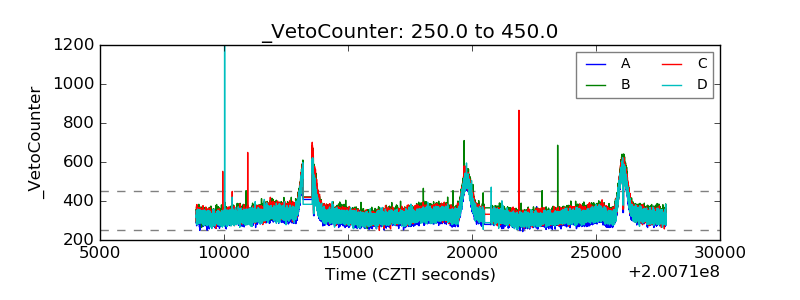 |