| Param | Original file | Final file |
|---|---|---|
| Filename | modeM0/AS1G05_112T01_9000000452_03369cztM0_level2.evt | modeM0/AS1G05_112T01_9000000452_03369cztM0_level2_quad_clean.evt |
| Size (bytes) | 455,132,160 | 73,016,640 |
| Size | 434.0 MB | 69.6 MB |
| Events in quadrant A | 3,221,696 | 443,161 |
| Events in quadrant B | 3,680,811 | 442,219 |
| Events in quadrant C | 3,290,285 | 435,840 |
| Events in quadrant D | 3,135,052 | 422,139 |
| Mode M9 | |||
|---|---|---|---|
| Quadrant | BADHDUFLAG | Total packets | Discarded packets |
| A | 0 | 20 | 0 |
| B | 0 | 20 | 0 |
| C | 0 | 20 | 0 |
| D | 0 | 20 | 0 |
| Mode SS | |||
|---|---|---|---|
| Quadrant | BADHDUFLAG | Total packets | Discarded packets |
| A | 0 | 138 | 0 |
| B | 0 | 138 | 0 |
| C | 0 | 138 | 0 |
| D | 0 | 138 | 0 |
| Mode M0 | |||
|---|---|---|---|
| Quadrant | BADHDUFLAG | Total packets | Discarded packets |
| A | 0 | 14117 | 3 |
| B | 0 | 15571 | 2 |
| C | 0 | 14266 | 2 |
| D | 0 | 14084 | 2 |
| Quadrant | Total seconds | Saturated seconds | Saturation percentage |
|---|---|---|---|
| A | 6707 | 78 | 1.162964% |
| B | 6707 | 114 | 1.699717% |
| C | 6707 | 73 | 1.088415% |
| D | 6707 | 75 | 1.118235% |
Noise dominated data is calculated using 1-second bins in cleaned event files. If a bin has >2000 counts, and if more than 50% of those come from <1% of pixels, then it is considered to be noise-dominated and hence unusable.
| Quadrant | # 1 sec bins | Bins with >0 counts | Bins with >2000 counts | High rate bins dominated by noise | Noise dominated (total time) | Noise dominated (detector-on time) | Marked lightcurve |
|---|---|---|---|---|---|---|---|
| A | 8717 | 6709 | 1 | 1 | 0.01% | 0.01% | 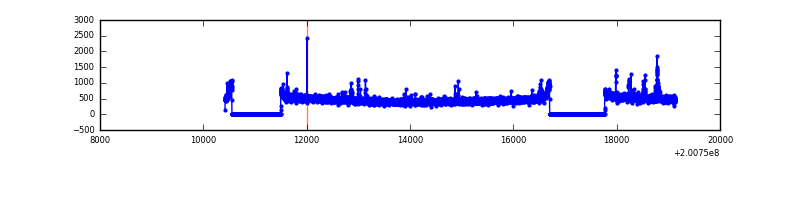 |
| B | 8717 | 6709 | 4 | 4 | 0.05% | 0.06% | 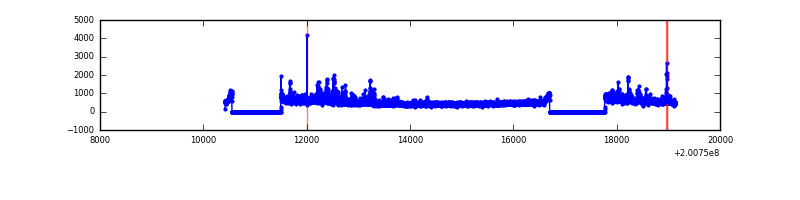 |
| C | 8717 | 6709 | 20 | 20 | 0.23% | 0.30% | 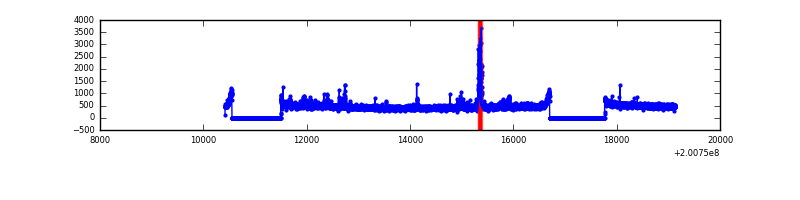 |
| D | 8717 | 6709 | 12 | 12 | 0.14% | 0.18% | 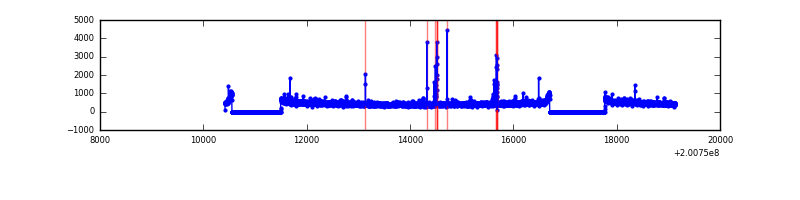 |
Top three noisy pixels from each quadrant. If the there are fewer than three noisy pixels in the level2.evt file, extra rows are filled as -1
| Pixel properties | Quadrant properties | ||||||
|---|---|---|---|---|---|---|---|
| Quadrant | DetID | PixID | Counts | Sigma | Mean | Median | Sigma |
| A | 0 | 50 | 44663 | 262.06 | 804 | 785 | 167.4 |
| A | 14 | 249 | 40822 | 239.12 | 804 | 785 | 167.4 |
| A | 0 | 31 | 17625 | 100.58 | 804 | 785 | 167.4 |
| B | 14 | 167 | 237955 | 1499.17 | 815 | 797 | 158.2 |
| B | 15 | 204 | 222207 | 1399.62 | 815 | 797 | 158.2 |
| B | 0 | 229 | 29591 | 182.02 | 815 | 797 | 158.2 |
| C | 14 | 223 | 104469 | 565.69 | 784 | 789 | 183.3 |
| C | 9 | 54 | 57672 | 310.36 | 784 | 789 | 183.3 |
| C | 1 | 192 | 30336 | 161.21 | 784 | 789 | 183.3 |
| D | 13 | 223 | 52355 | 269.21 | 780 | 758 | 191.7 |
| D | 13 | 137 | 42347 | 217.0 | 780 | 758 | 191.7 |
| D | 13 | 239 | 31471 | 160.25 | 780 | 758 | 191.7 |
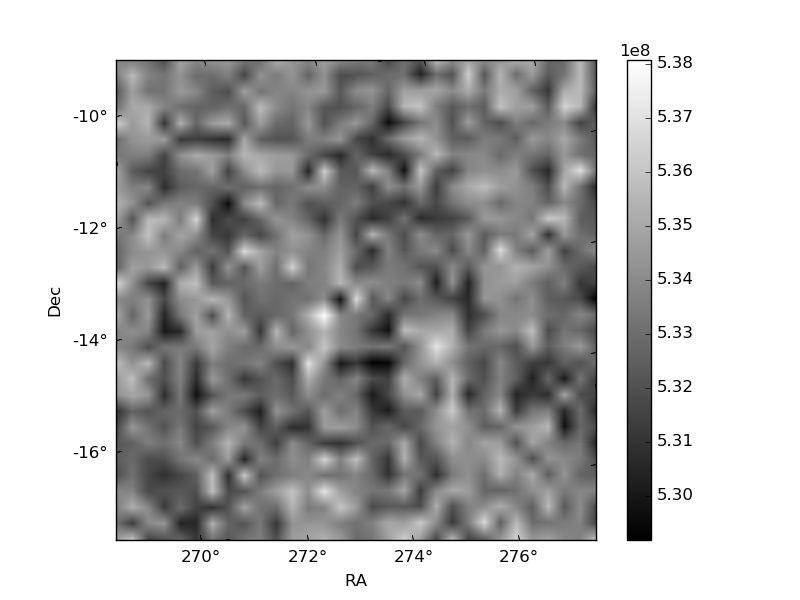
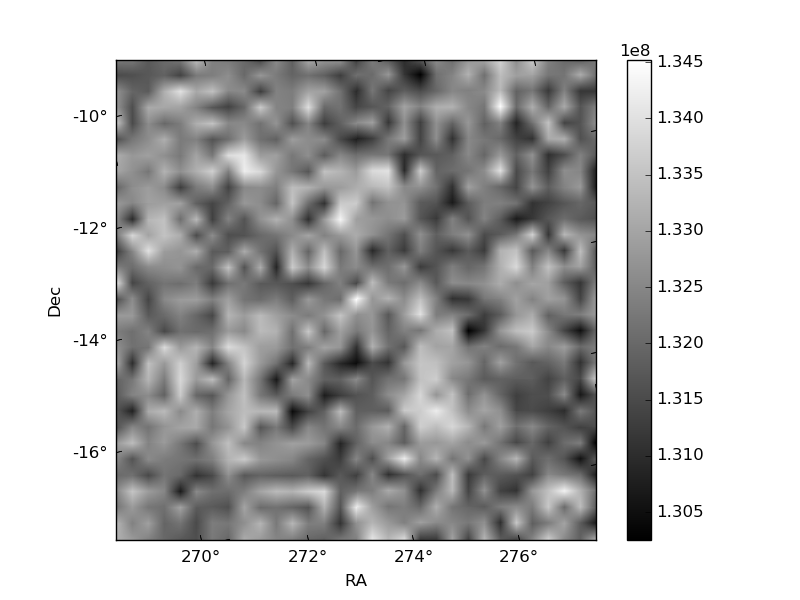
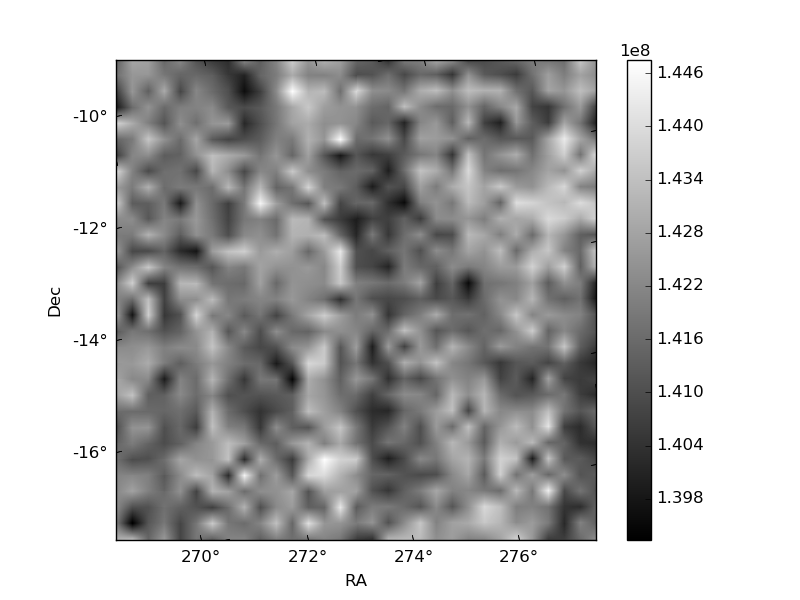
Histogram calculated using DETX and DETY for each event in the final _common_clean file
| Quadrant A | 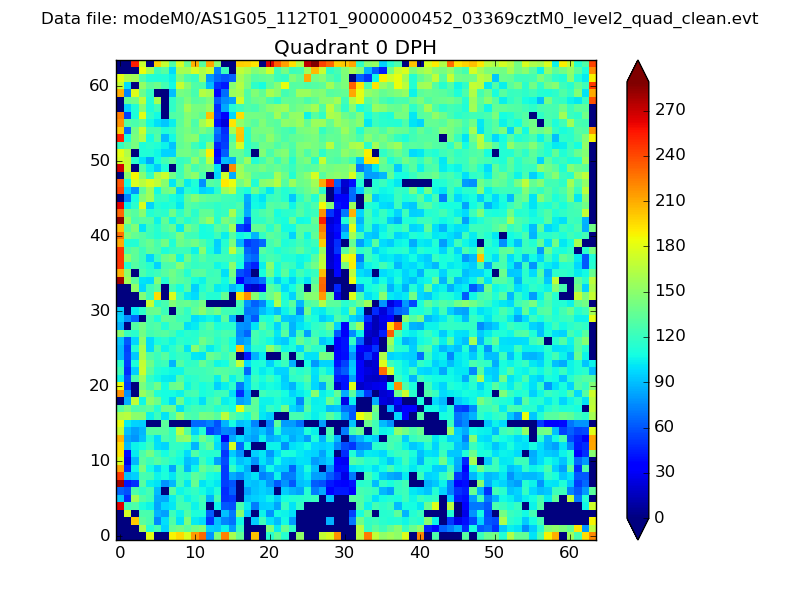 |
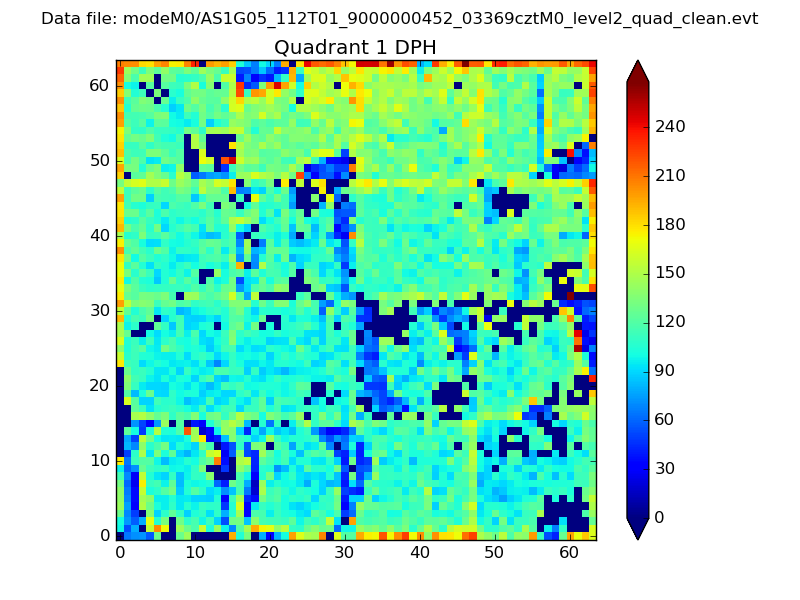 |
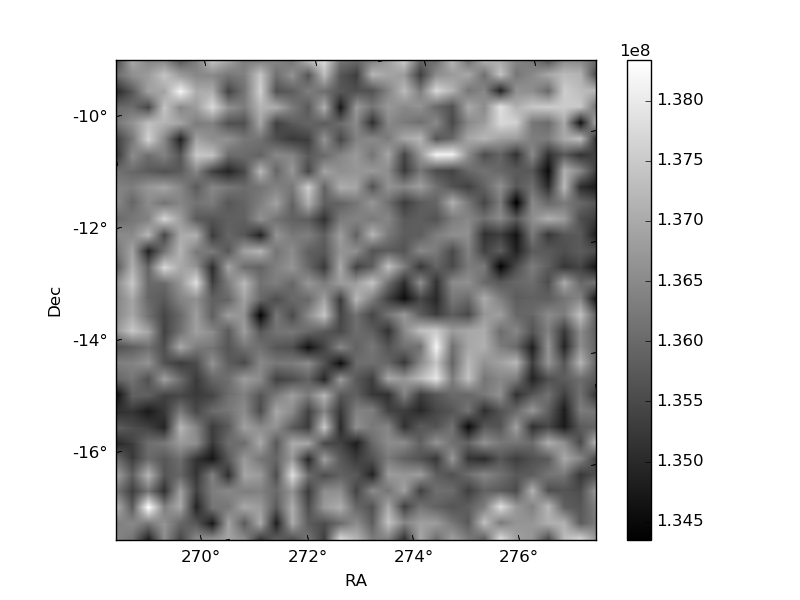
Quadrant B |
|---|---|---|---|
| Quadrant D | 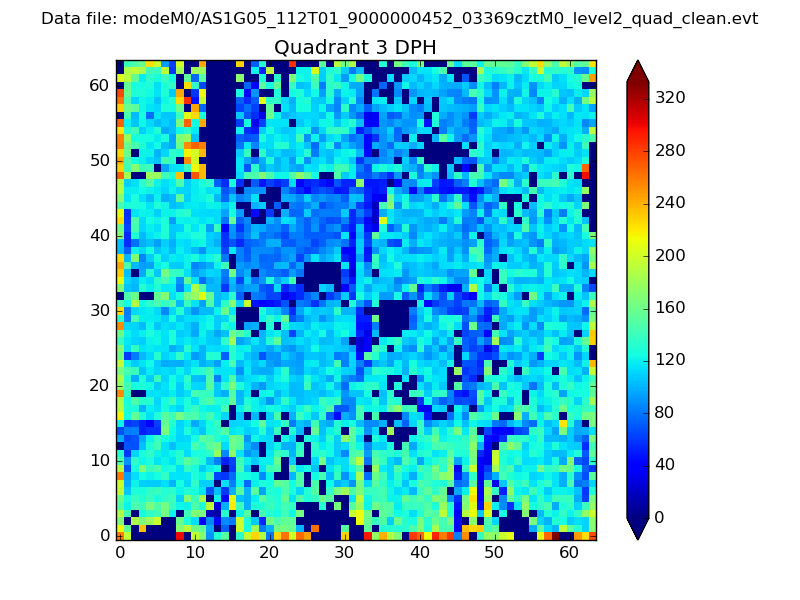 |
 |
Quadrant C |
| Plot type | Count rate plots | Images |
|---|---|---|
| Comparison with Poisson distribution Blue bars denote a histogram of data divided into 1 sec bins. Red curve is a Poisson curve with rate = median count rate of data. |
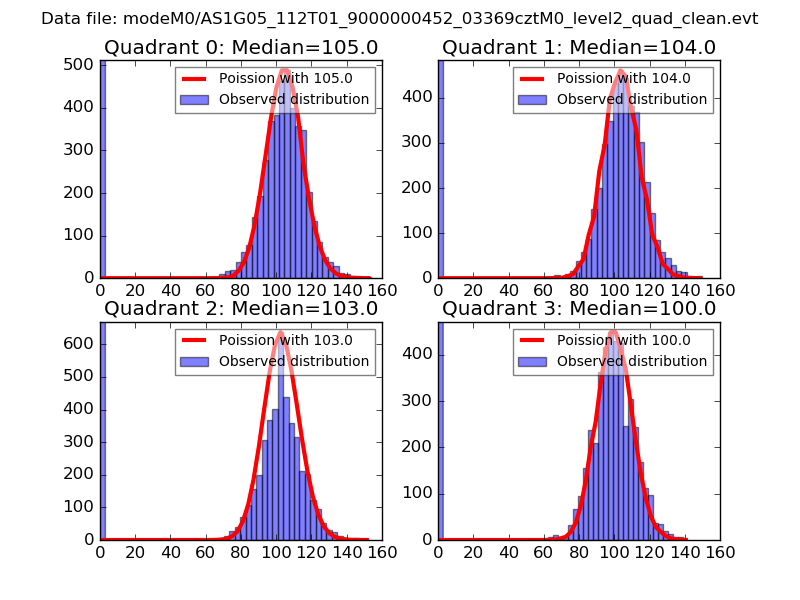 |
 |
| Quadrant-wise count rates Data is divided into 100 sec bins |
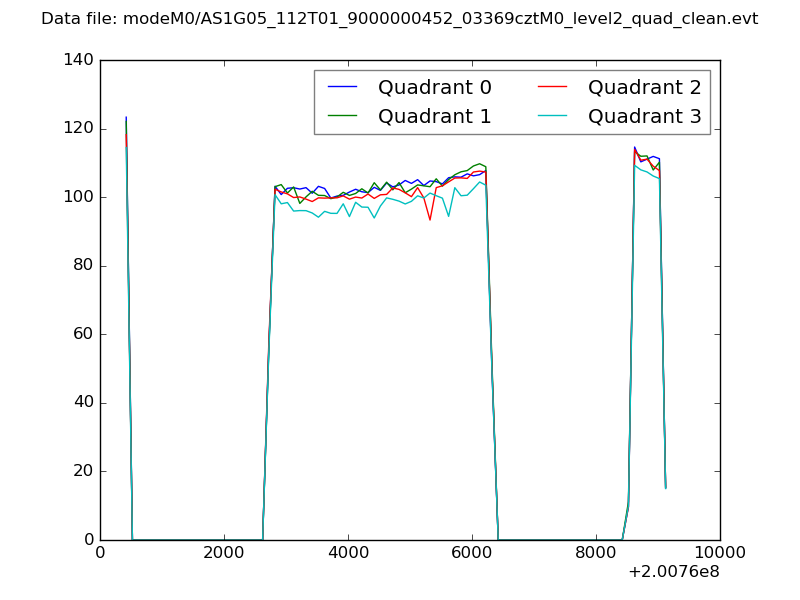 |
|
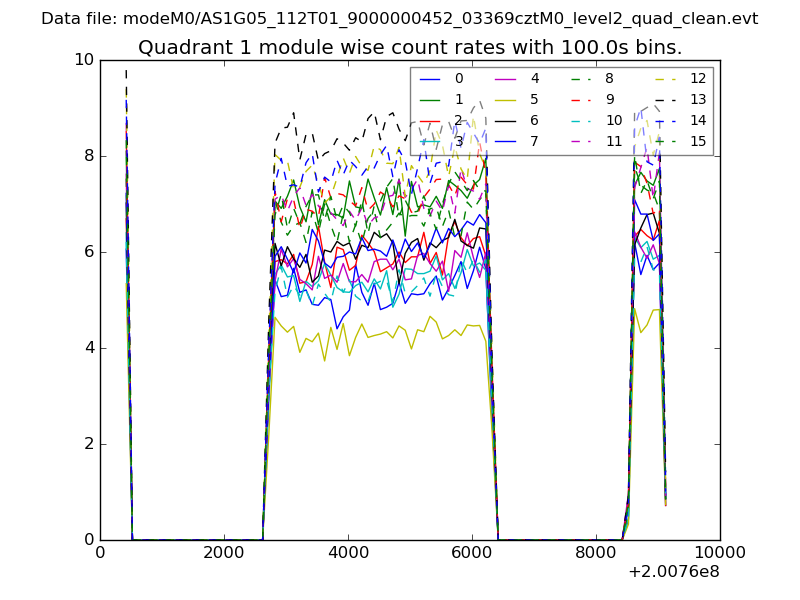
| Module-wise count rates for Quadrant A Data is divided into 100 sec bins |
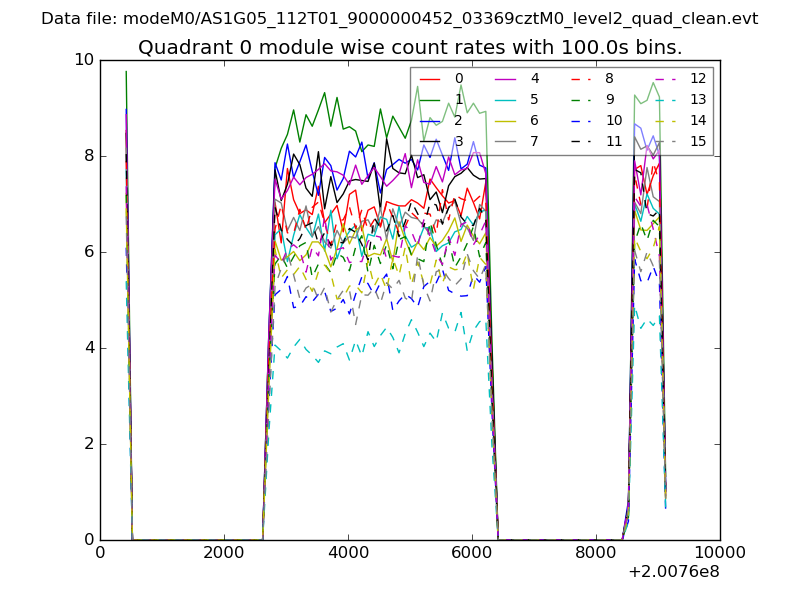 |
 |
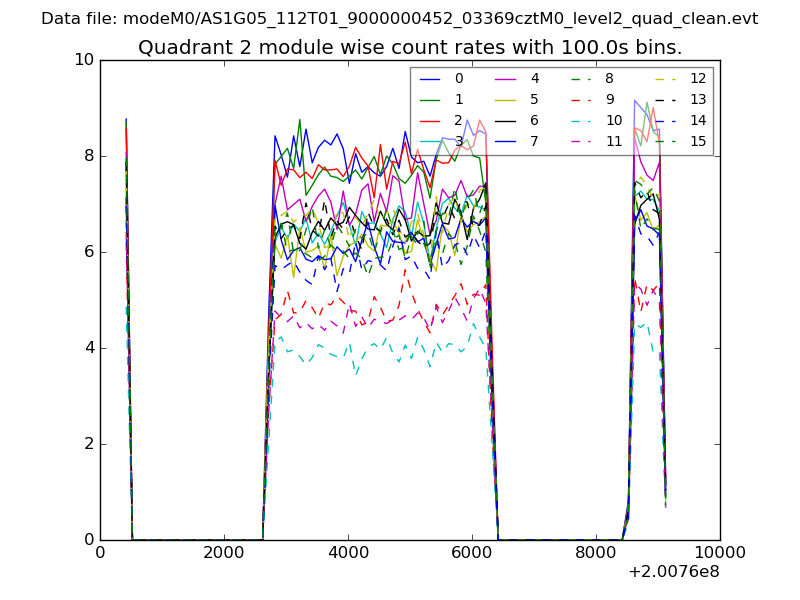
| Module-wise count rates for Quadrant B Data is divided into 100 sec bins |
 |
 |
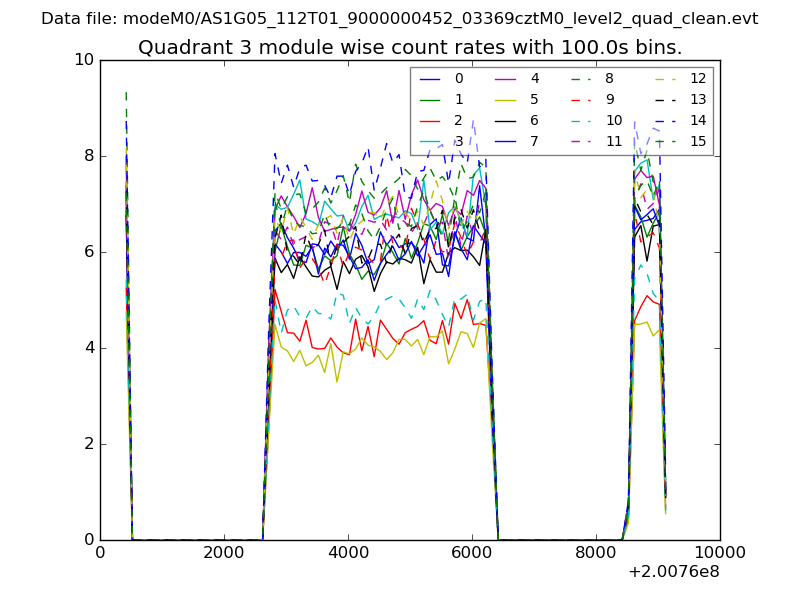
| Module-wise count rates for Quadrant C Data is divided into 100 sec bins |
 |
 |
| Module-wise count rates for Quadrant D Data is divided into 100 sec bins |
 |
 |
| Parameter | Plot |
|---|---|
| CZT HV Monitor | 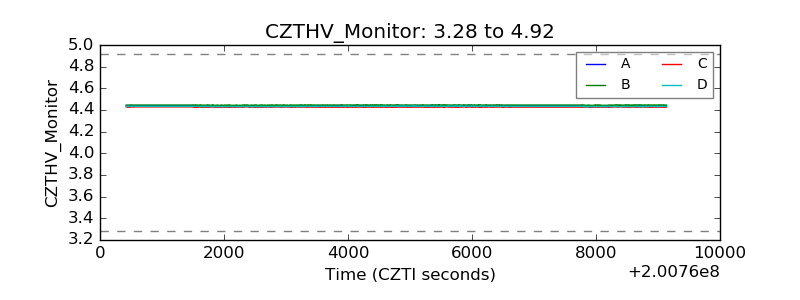 |
| D_VDD |  |
| Temperature 1 | 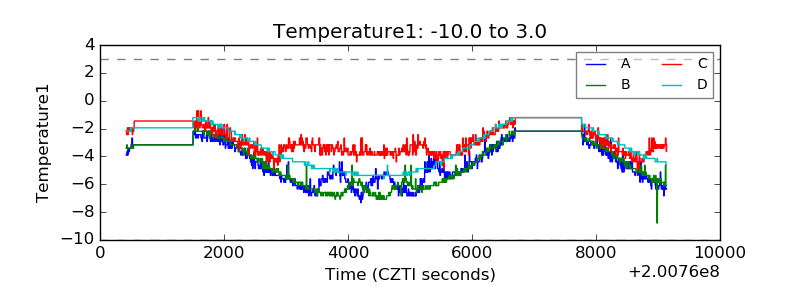 |
| Veto HV Monitor | 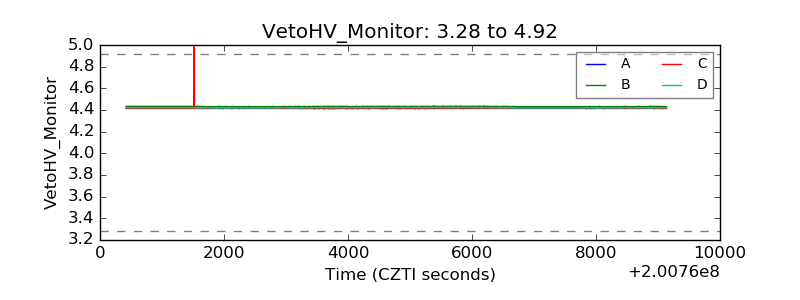 |
| Veto LLD | 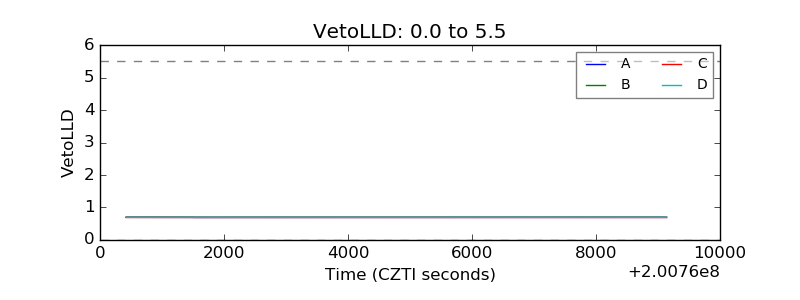 |
| Alpha Counter | 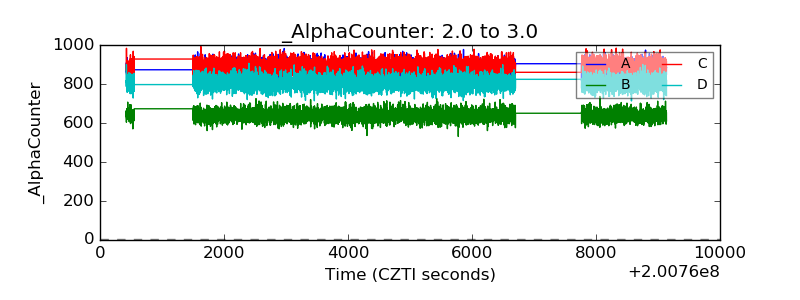 |
| _CPM_Rate | 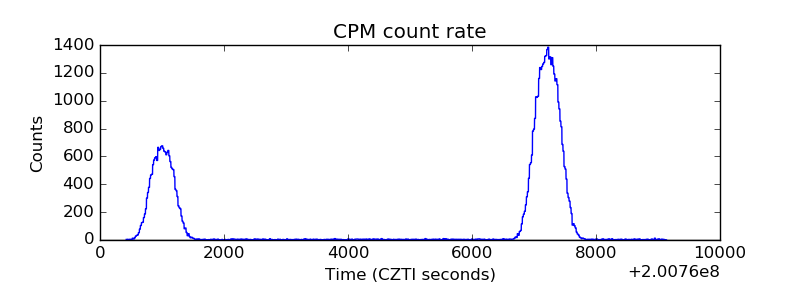 |
| CZT Counter |  |
| +2.5 Volts monitor |  |
| +5 Volts monitor |  |
| _ROLL_ROT | 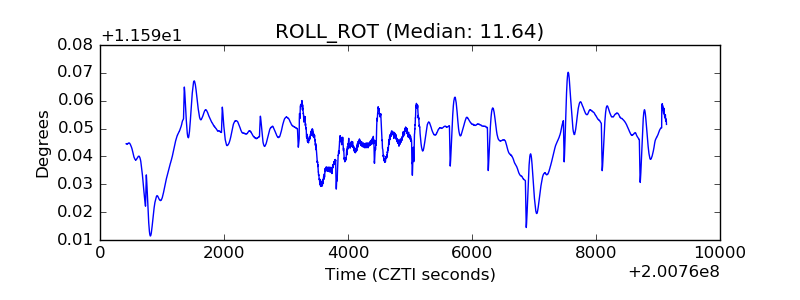 |
| _Roll_DEC | 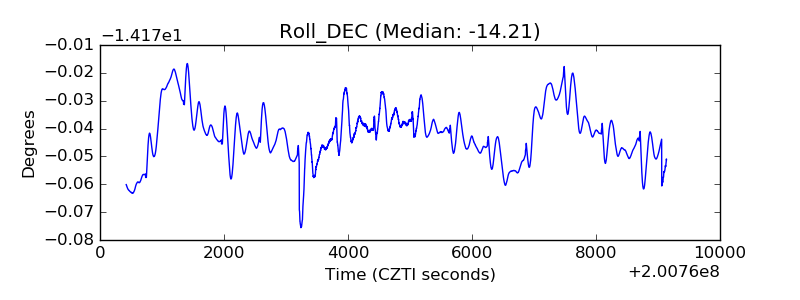 |
| _Roll_RA |  |
| Veto Counter | 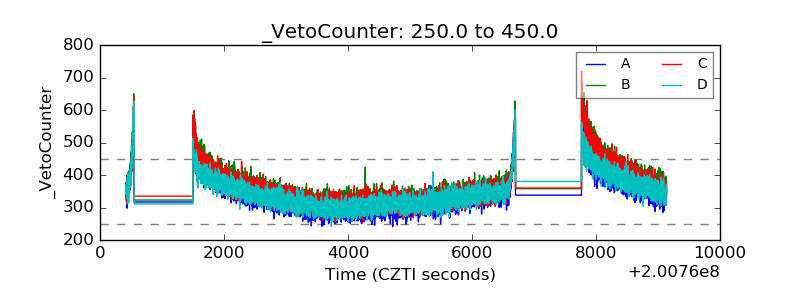 |