| Param | Original file | Final file |
|---|---|---|
| Filename | modeM0/AS1G05_112T01_9000000452_03371cztM0_level2.evt | modeM0/AS1G05_112T01_9000000452_03371cztM0_level2_quad_clean.evt |
| Size (bytes) | 379,486,080 | 85,147,200 |
| Size | 361.9 MB | 81.2 MB |
| Events in quadrant A | 2,752,618 | 546,104 |
| Events in quadrant B | 2,923,834 | 555,056 |
| Events in quadrant C | 2,757,681 | 549,582 |
| Events in quadrant D | 2,664,912 | 523,523 |
| Mode M9 | |||
|---|---|---|---|
| Quadrant | BADHDUFLAG | Total packets | Discarded packets |
| A | 0 | 12 | 0 |
| B | 0 | 12 | 0 |
| C | 0 | 12 | 0 |
| D | 0 | 12 | 0 |
| Mode SS | |||
|---|---|---|---|
| Quadrant | BADHDUFLAG | Total packets | Discarded packets |
| A | 0 | 118 | 0 |
| B | 0 | 118 | 0 |
| C | 0 | 118 | 0 |
| D | 0 | 118 | 0 |
| Mode M0 | |||
|---|---|---|---|
| Quadrant | BADHDUFLAG | Total packets | Discarded packets |
| A | 0 | 12025 | 2 |
| B | 0 | 12425 | 1 |
| C | 0 | 11992 | 1 |
| D | 0 | 11984 | 1 |
| Quadrant | Total seconds | Saturated seconds | Saturation percentage |
|---|---|---|---|
| A | 5781 | 35 | 0.605432% |
| B | 5781 | 50 | 0.864902% |
| C | 5781 | 13 | 0.224875% |
| D | 5781 | 25 | 0.432451% |
Noise dominated data is calculated using 1-second bins in cleaned event files. If a bin has >2000 counts, and if more than 50% of those come from <1% of pixels, then it is considered to be noise-dominated and hence unusable.
| Quadrant | # 1 sec bins | Bins with >0 counts | Bins with >2000 counts | High rate bins dominated by noise | Noise dominated (total time) | Noise dominated (detector-on time) | Marked lightcurve |
|---|---|---|---|---|---|---|---|
| A | 7051 | 5782 | 12 | 12 | 0.17% | 0.21% | 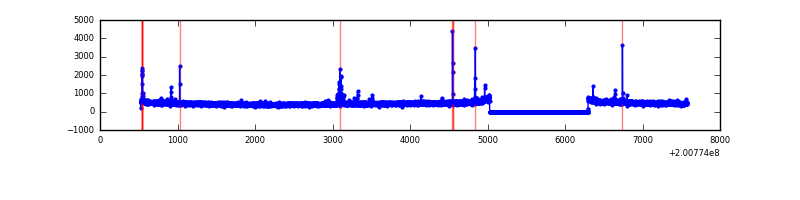 |
| B | 7051 | 5782 | 14 | 14 | 0.20% | 0.24% | 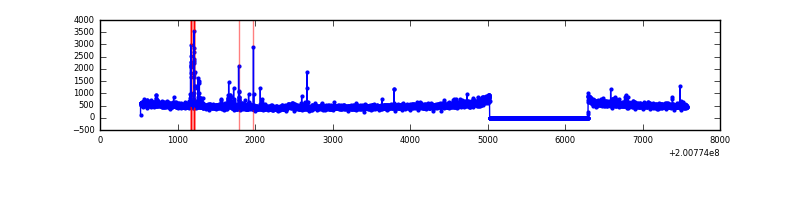 |
| C | 7051 | 5782 | 0 | 0 | 0.00% | 0.00% | 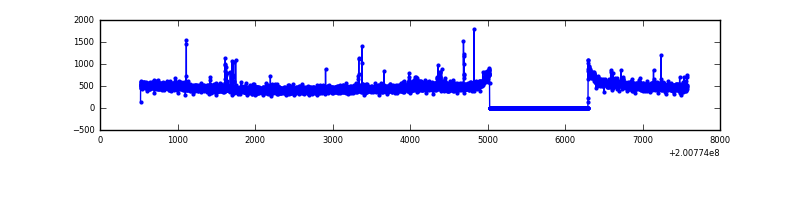 |
| D | 7051 | 5782 | 11 | 11 | 0.16% | 0.19% | 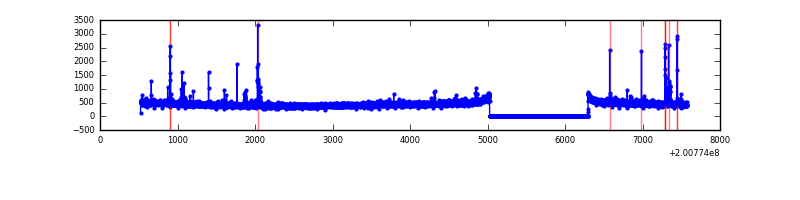 |
Top three noisy pixels from each quadrant. If the there are fewer than three noisy pixels in the level2.evt file, extra rows are filled as -1
| Pixel properties | Quadrant properties | ||||||
|---|---|---|---|---|---|---|---|
| Quadrant | DetID | PixID | Counts | Sigma | Mean | Median | Sigma |
| A | 0 | 118 | 57416 | 404.97 | 687 | 673 | 140.1 |
| A | 0 | 50 | 15498 | 105.81 | 687 | 673 | 140.1 |
| A | 0 | 226 | 12331 | 83.2 | 687 | 673 | 140.1 |
| B | 2 | 249 | 88347 | 644.05 | 704 | 689 | 136.1 |
| B | 15 | 204 | 67051 | 487.58 | 704 | 689 | 136.1 |
| B | 0 | 229 | 28301 | 202.87 | 704 | 689 | 136.1 |
| C | 15 | 208 | 32818 | 200.3 | 682 | 687 | 160.4 |
| C | 1 | 16 | 17864 | 107.08 | 682 | 687 | 160.4 |
| C | 7 | 237 | 11113 | 64.99 | 682 | 687 | 160.4 |
| D | 13 | 223 | 55174 | 334.36 | 670 | 653 | 163.1 |
| D | 5 | 233 | 23146 | 137.94 | 670 | 653 | 163.1 |
| D | 2 | 37 | 12522 | 72.79 | 670 | 653 | 163.1 |
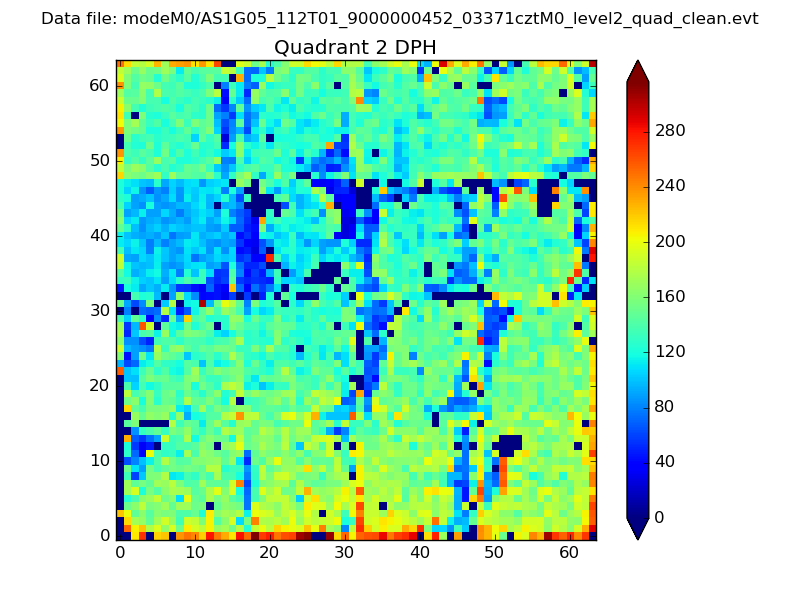
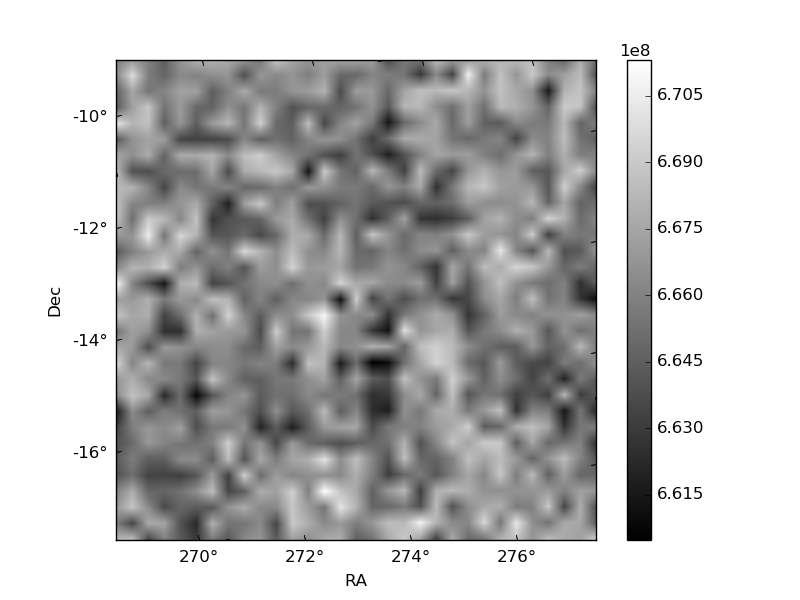
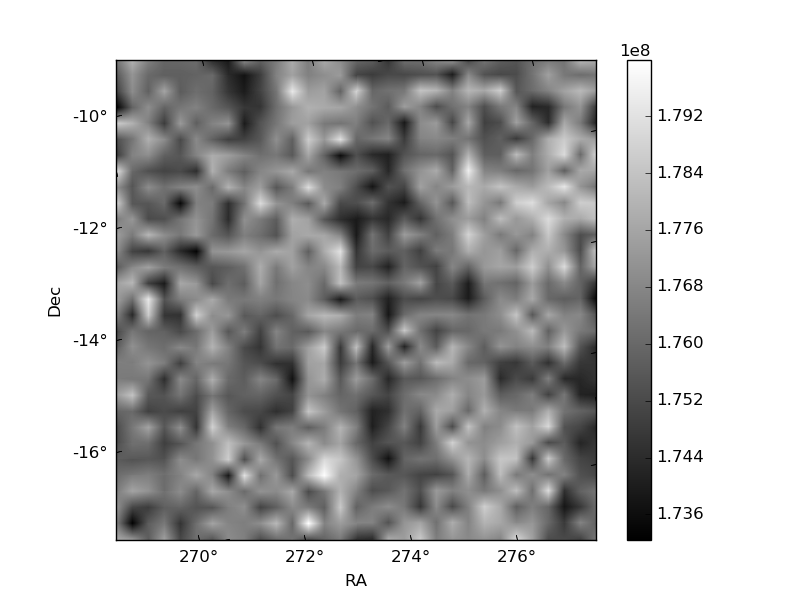
Histogram calculated using DETX and DETY for each event in the final _common_clean file
| Quadrant A | 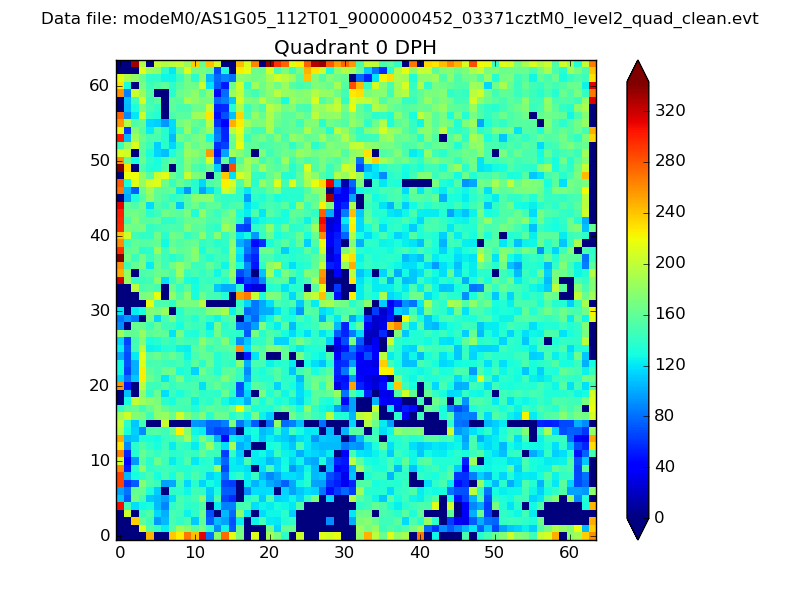 |
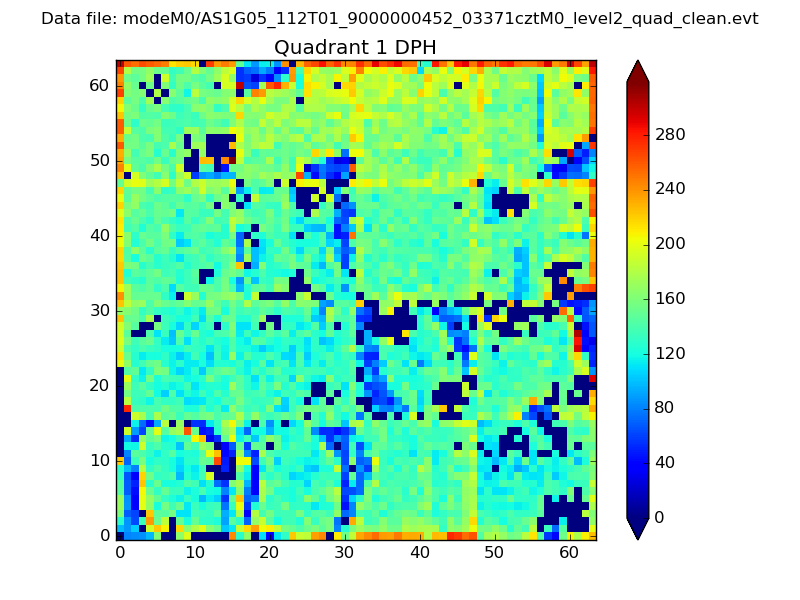 |
Quadrant B |
|---|---|---|---|
| Quadrant D | 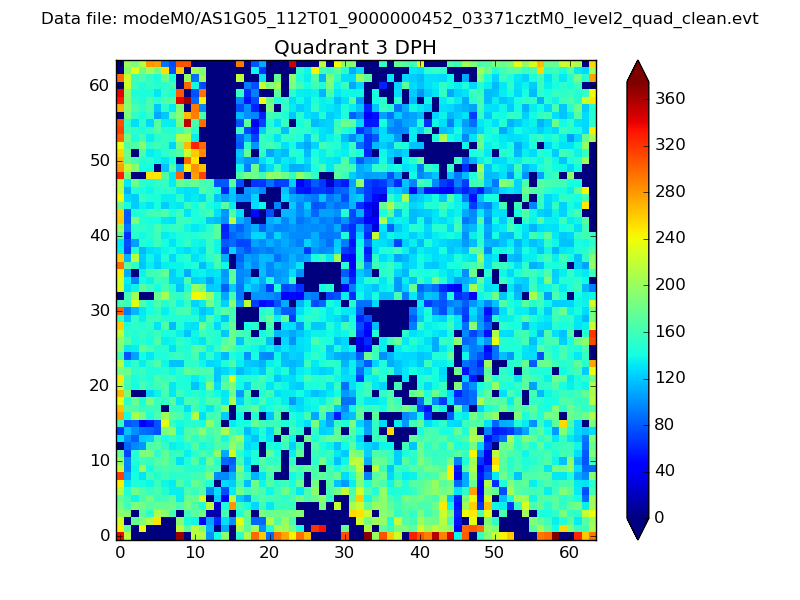 |
 |
Quadrant C |
| Plot type | Count rate plots | Images |
|---|---|---|
| Comparison with Poisson distribution Blue bars denote a histogram of data divided into 1 sec bins. Red curve is a Poisson curve with rate = median count rate of data. |
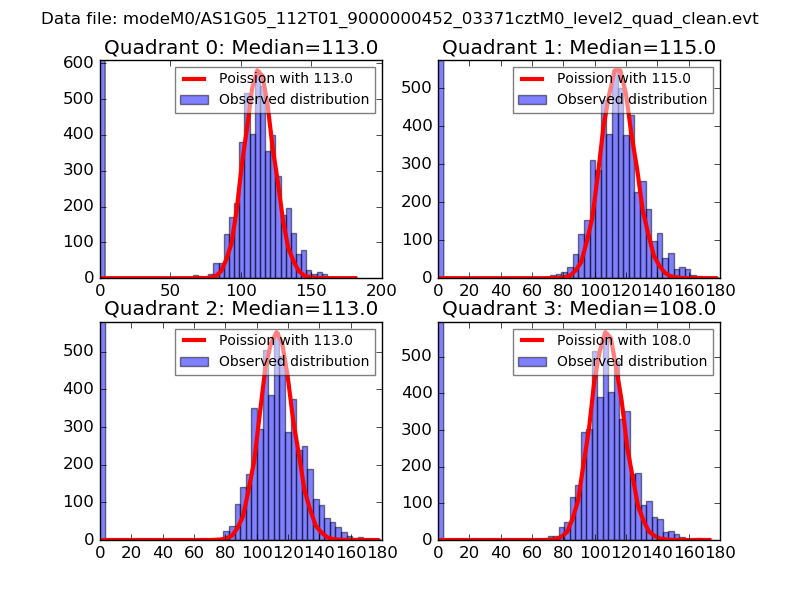 |
 |
| Quadrant-wise count rates Data is divided into 100 sec bins |
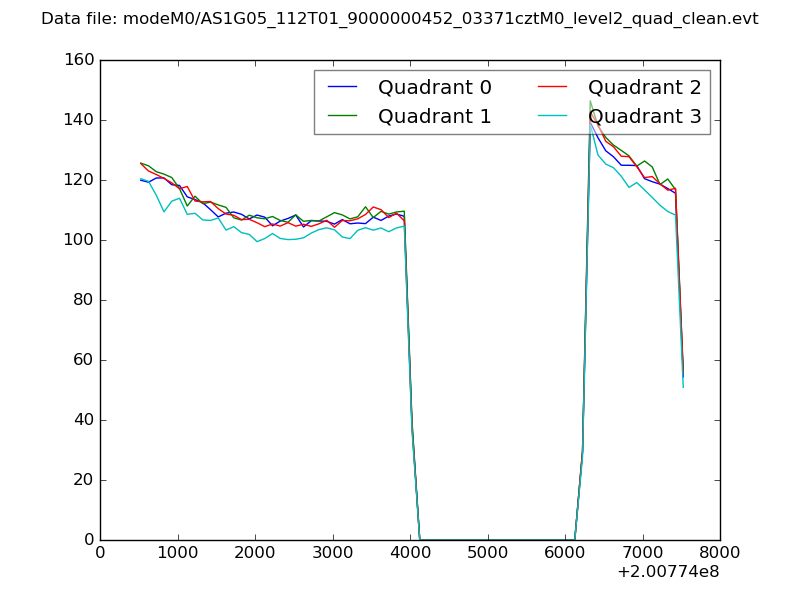 |
|
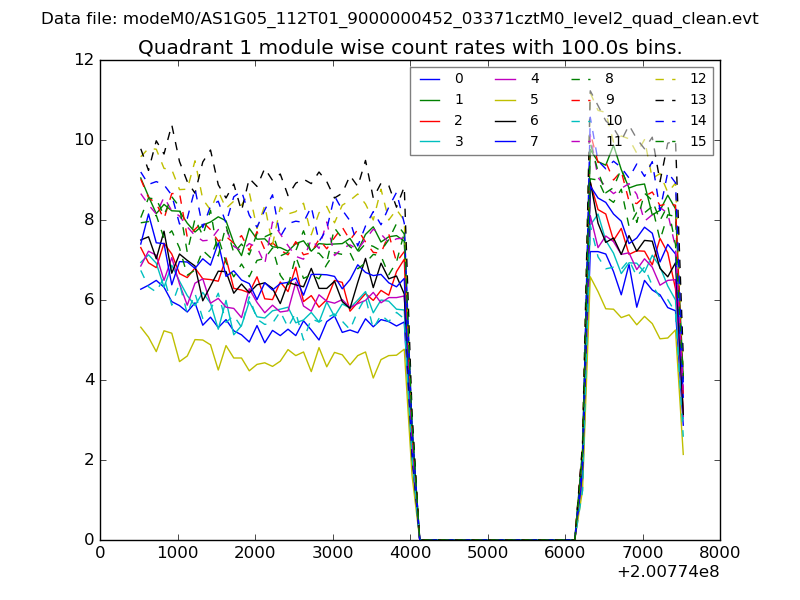
| Module-wise count rates for Quadrant A Data is divided into 100 sec bins |
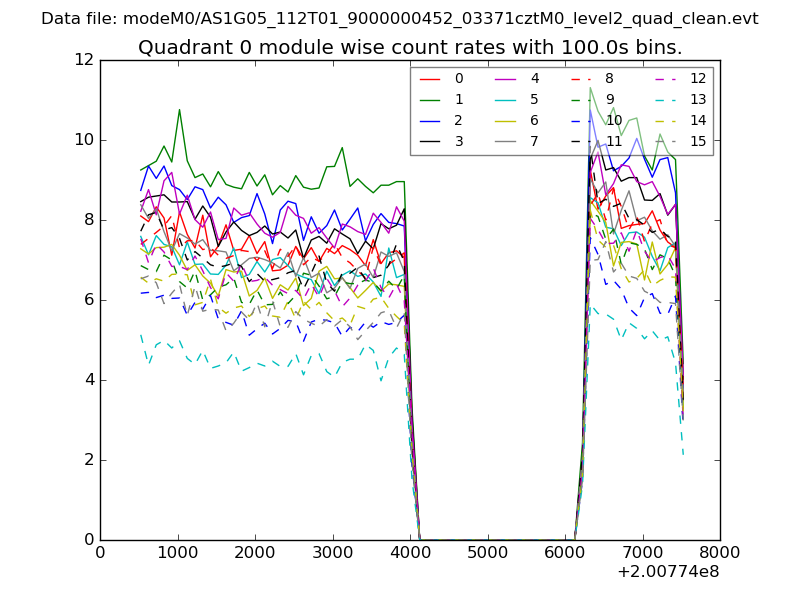 |
 |
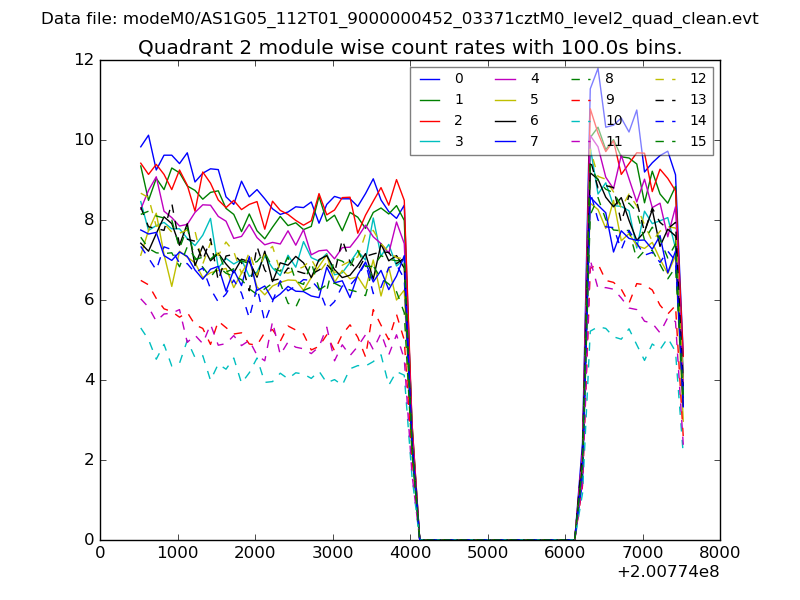
| Module-wise count rates for Quadrant B Data is divided into 100 sec bins |
 |
 |
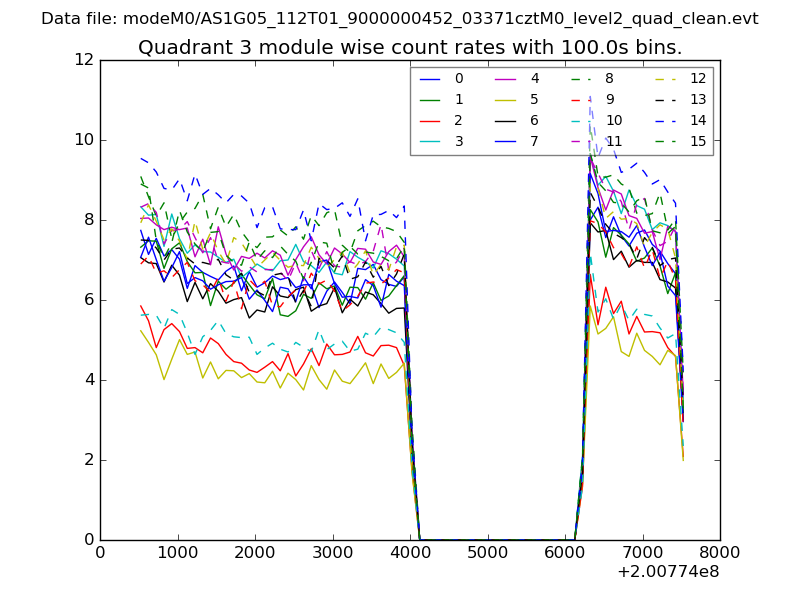
| Module-wise count rates for Quadrant C Data is divided into 100 sec bins |
 |
 |
| Module-wise count rates for Quadrant D Data is divided into 100 sec bins |
 |
 |
| Parameter | Plot |
|---|---|
| CZT HV Monitor | 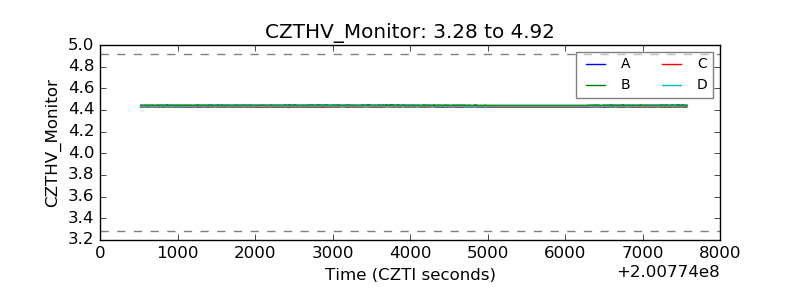 |
| D_VDD | 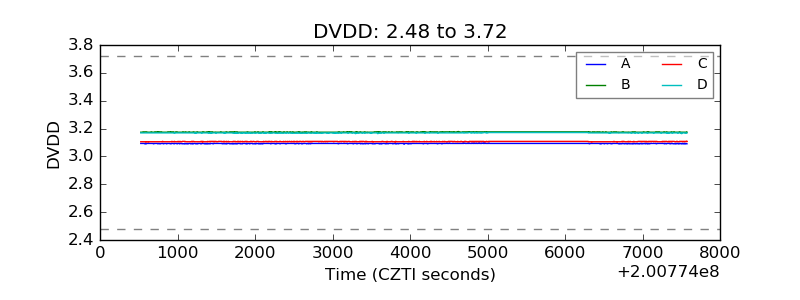 |
| Temperature 1 | 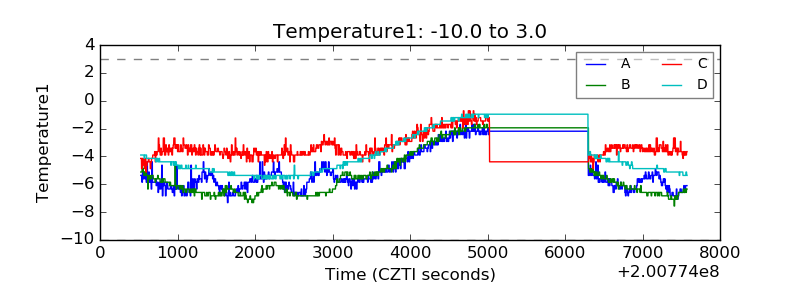 |
| Veto HV Monitor | 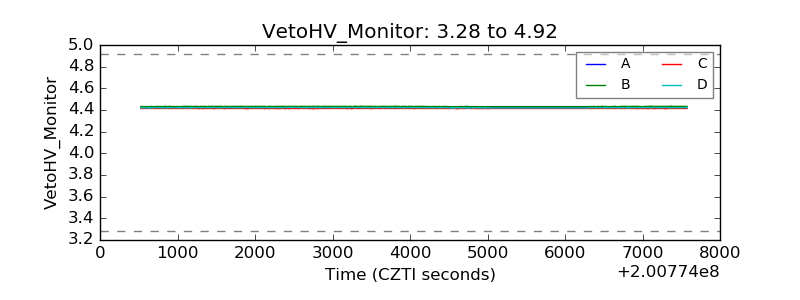 |
| Veto LLD | 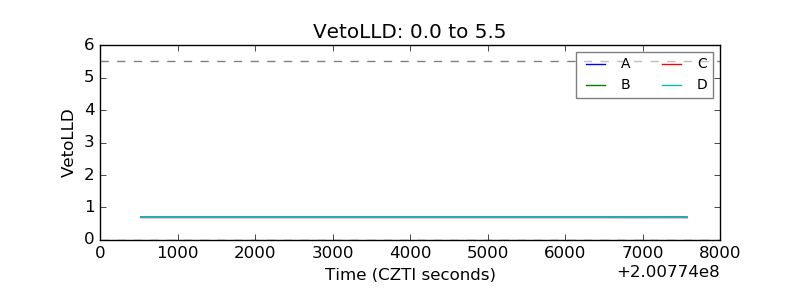 |
| Alpha Counter | 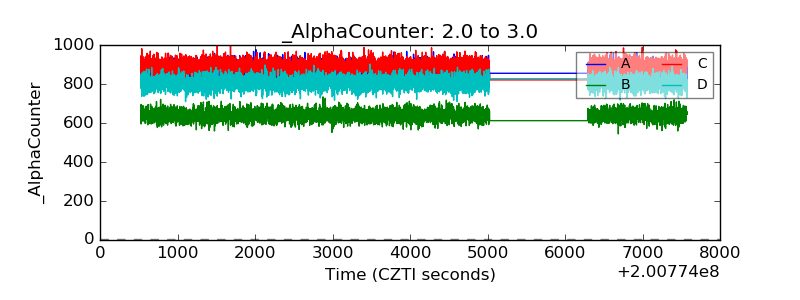 |
| _CPM_Rate | 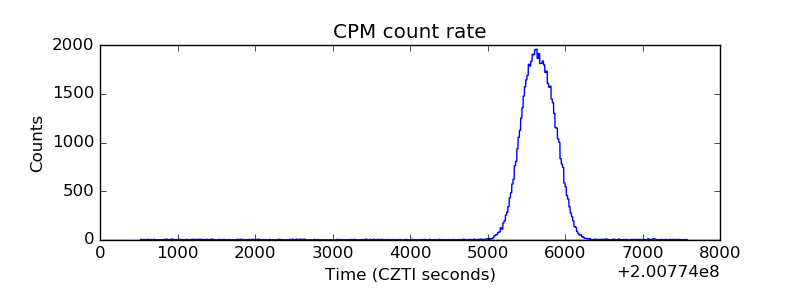 |
| CZT Counter | 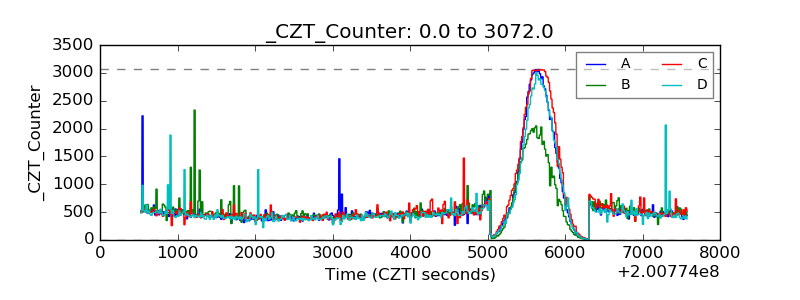 |
| +2.5 Volts monitor | 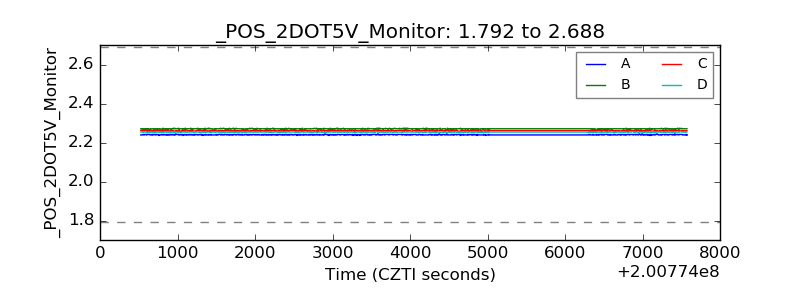 |
| +5 Volts monitor |  |
| _ROLL_ROT | 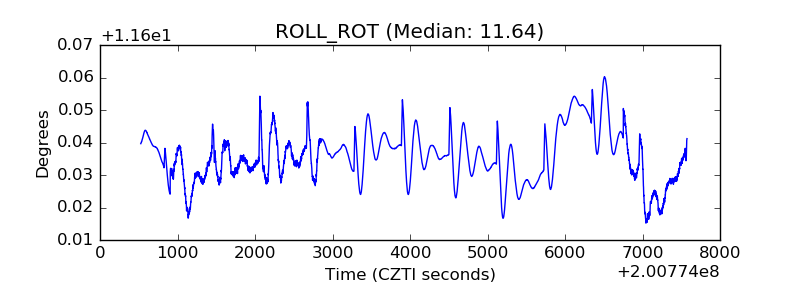 |
| _Roll_DEC | 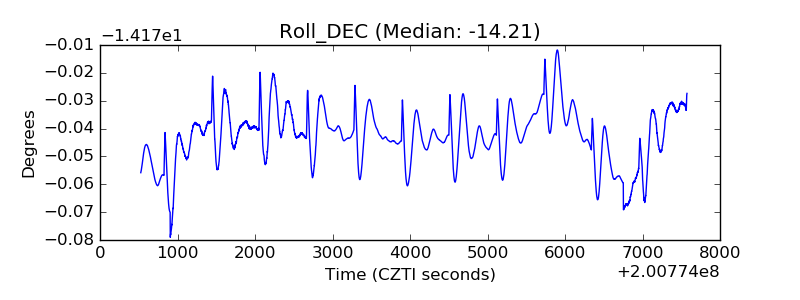 |
| _Roll_RA | 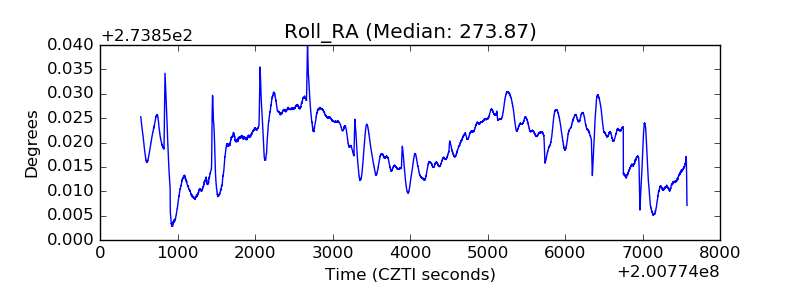 |
| Veto Counter | 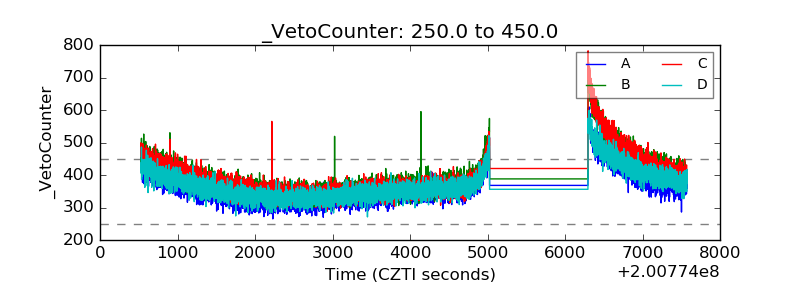 |