| Param | Original file | Final file |
|---|---|---|
| Filename | modeM0/AS1G05_112T01_9000000452_03373cztM0_level2.evt | modeM0/AS1G05_112T01_9000000452_03373cztM0_level2_quad_clean.evt |
| Size (bytes) | 399,539,520 | 78,929,280 |
| Size | 381.0 MB | 75.3 MB |
| Events in quadrant A | 2,831,394 | 492,692 |
| Events in quadrant B | 3,142,543 | 499,698 |
| Events in quadrant C | 2,873,212 | 495,781 |
| Events in quadrant D | 2,833,522 | 471,740 |
| Mode M9 | |||
|---|---|---|---|
| Quadrant | BADHDUFLAG | Total packets | Discarded packets |
| A | 0 | 13 | 0 |
| B | 0 | 13 | 0 |
| C | 0 | 13 | 0 |
| D | 0 | 13 | 0 |
| Mode SS | |||
|---|---|---|---|
| Quadrant | BADHDUFLAG | Total packets | Discarded packets |
| A | 0 | 126 | 0 |
| B | 0 | 126 | 0 |
| C | 0 | 126 | 0 |
| D | 0 | 126 | 0 |
| Mode M0 | |||
|---|---|---|---|
| Quadrant | BADHDUFLAG | Total packets | Discarded packets |
| A | 0 | 12672 | 2 |
| B | 0 | 13408 | 1 |
| C | 0 | 12669 | 1 |
| D | 0 | 12880 | 1 |
| Quadrant | Total seconds | Saturated seconds | Saturation percentage |
|---|---|---|---|
| A | 6159 | 14 | 0.227310% |
| B | 6159 | 35 | 0.568274% |
| C | 6159 | 13 | 0.211073% |
| D | 6159 | 24 | 0.389674% |
Noise dominated data is calculated using 1-second bins in cleaned event files. If a bin has >2000 counts, and if more than 50% of those come from <1% of pixels, then it is considered to be noise-dominated and hence unusable.
| Quadrant | # 1 sec bins | Bins with >0 counts | Bins with >2000 counts | High rate bins dominated by noise | Noise dominated (total time) | Noise dominated (detector-on time) | Marked lightcurve |
|---|---|---|---|---|---|---|---|
| A | 7434 | 6160 | 4 | 4 | 0.05% | 0.06% | 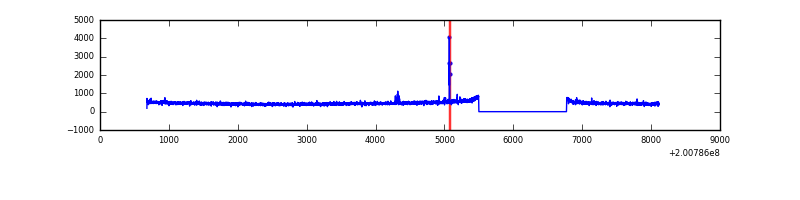 |
| B | 7434 | 6160 | 2 | 2 | 0.03% | 0.03% | 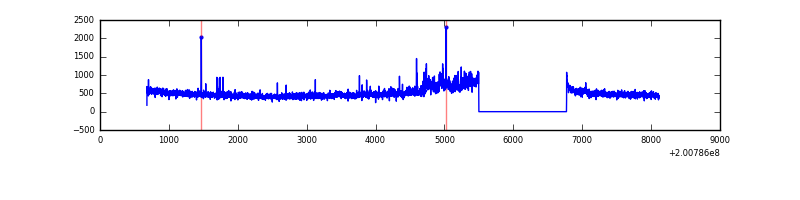 |
| C | 7434 | 6160 | 0 | 0 | 0.00% | 0.00% | 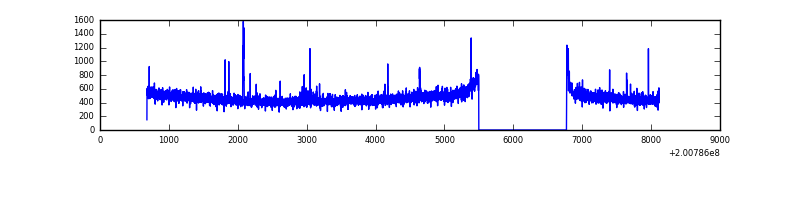 |
| D | 7434 | 6160 | 12 | 12 | 0.16% | 0.19% | 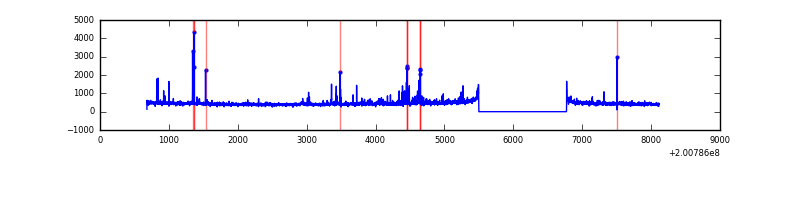 |
Top three noisy pixels from each quadrant. If the there are fewer than three noisy pixels in the level2.evt file, extra rows are filled as -1
| Pixel properties | Quadrant properties | ||||||
|---|---|---|---|---|---|---|---|
| Quadrant | DetID | PixID | Counts | Sigma | Mean | Median | Sigma |
| A | 14 | 249 | 16399 | 105.68 | 723 | 708 | 148.5 |
| A | 13 | 248 | 14212 | 90.95 | 723 | 708 | 148.5 |
| A | 0 | 50 | 10272 | 64.41 | 723 | 708 | 148.5 |
| B | 15 | 204 | 206291 | 1440.37 | 740 | 723 | 142.7 |
| B | 14 | 167 | 42012 | 289.3 | 740 | 723 | 142.7 |
| B | 12 | 111 | 10207 | 66.45 | 740 | 723 | 142.7 |
| C | 9 | 54 | 16660 | 94.17 | 719 | 726 | 169.2 |
| C | 1 | 16 | 16249 | 91.74 | 719 | 726 | 169.2 |
| C | 1 | 192 | 8020 | 43.11 | 719 | 726 | 169.2 |
| D | 13 | 223 | 87722 | 507.96 | 706 | 687 | 171.3 |
| D | 13 | 239 | 34242 | 195.84 | 706 | 687 | 171.3 |
| D | 12 | 110 | 24432 | 138.58 | 706 | 687 | 171.3 |
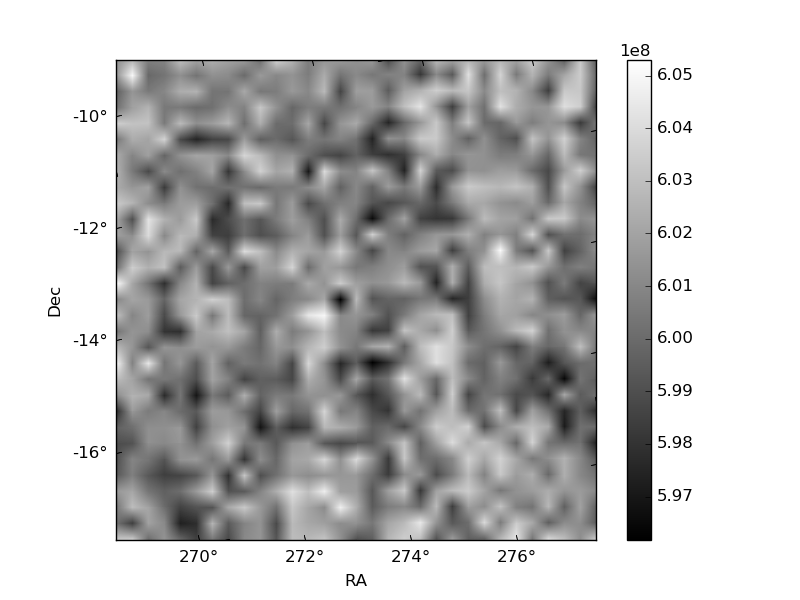
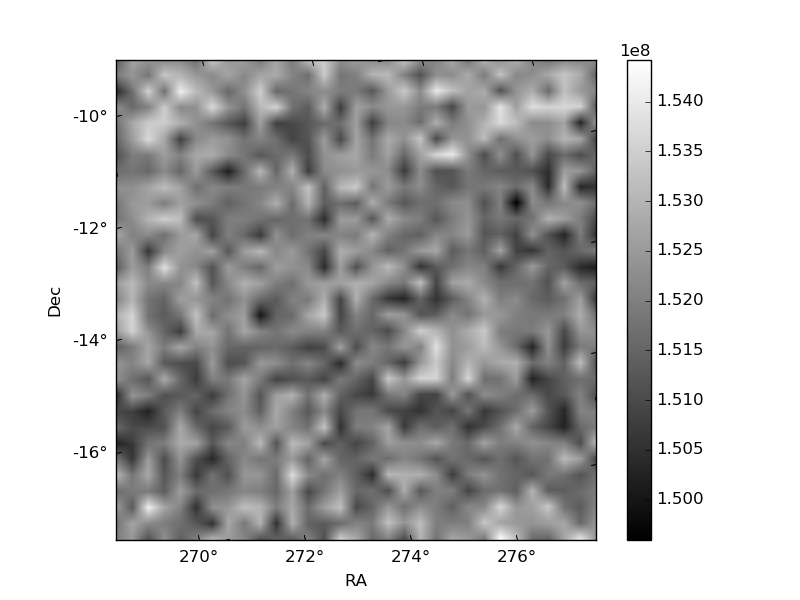
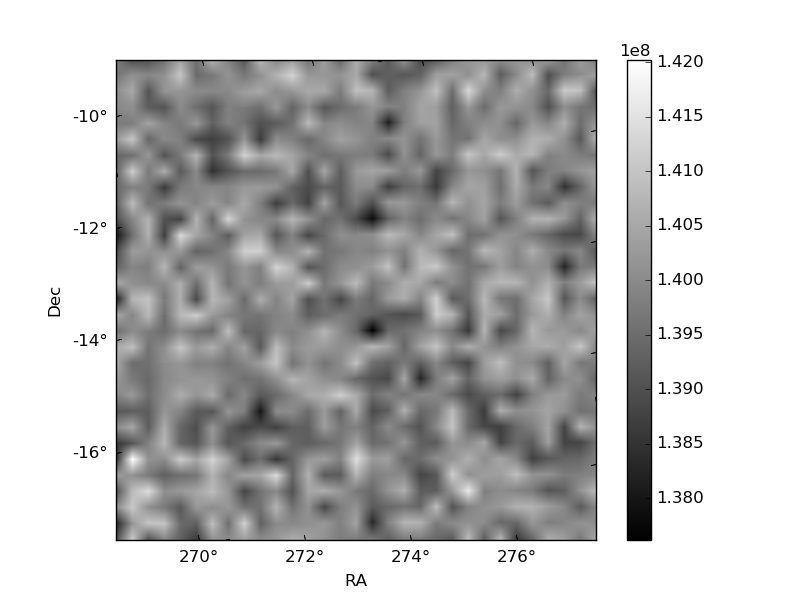
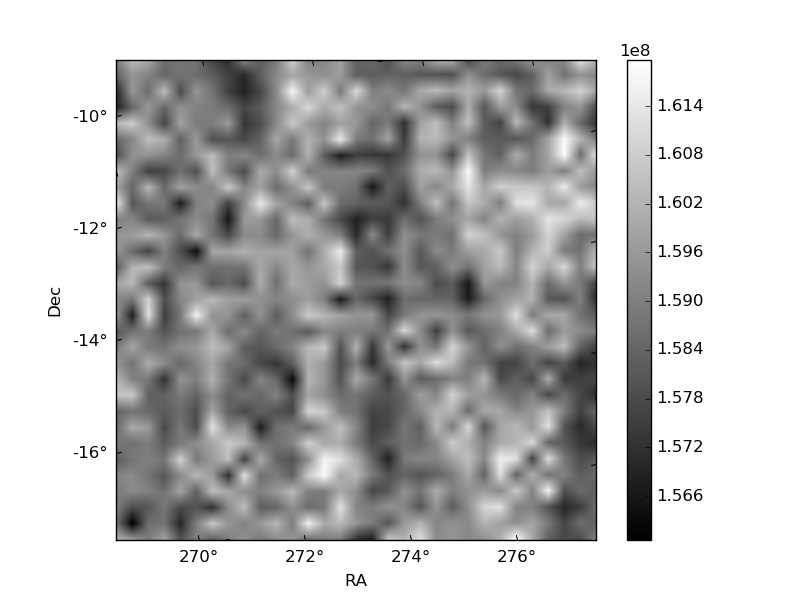
Histogram calculated using DETX and DETY for each event in the final _common_clean file
| Quadrant A | 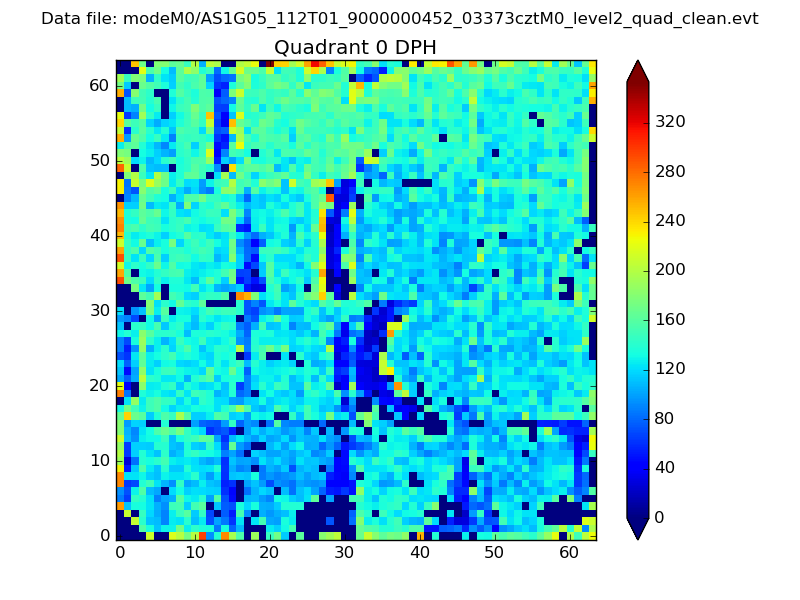 |
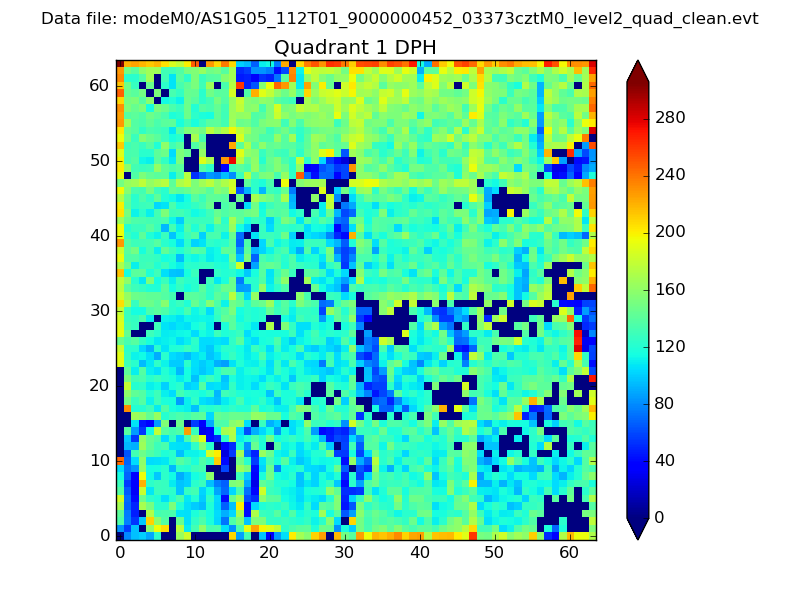 |
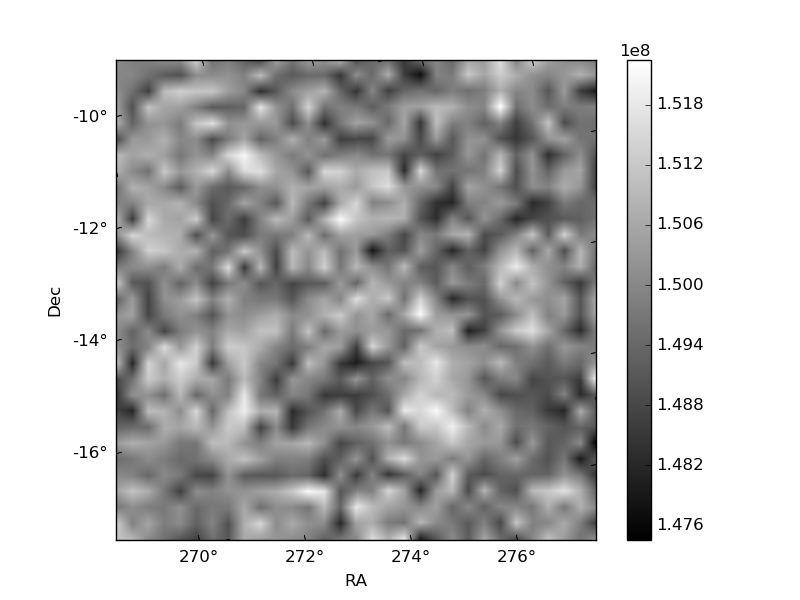
Quadrant B |
|---|---|---|---|
| Quadrant D | 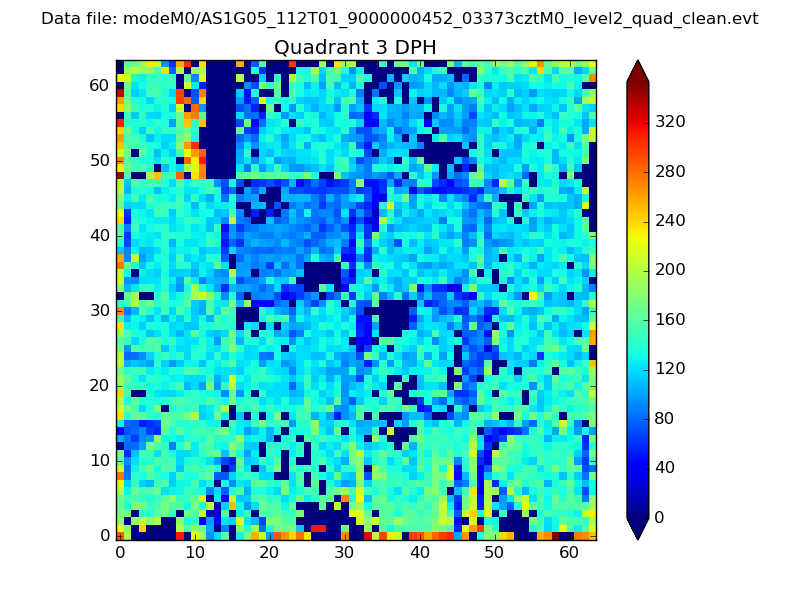 |
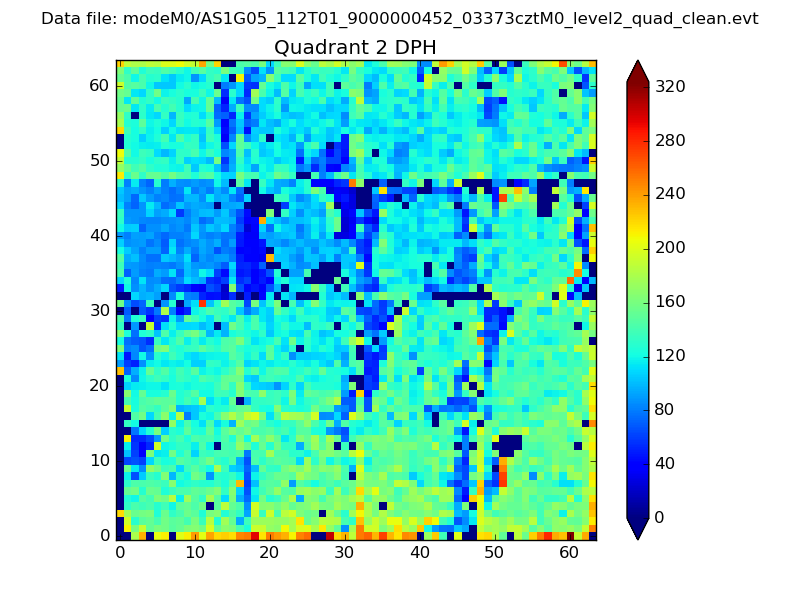 |
Quadrant C |
| Plot type | Count rate plots | Images |
|---|---|---|
| Comparison with Poisson distribution Blue bars denote a histogram of data divided into 1 sec bins. Red curve is a Poisson curve with rate = median count rate of data. |
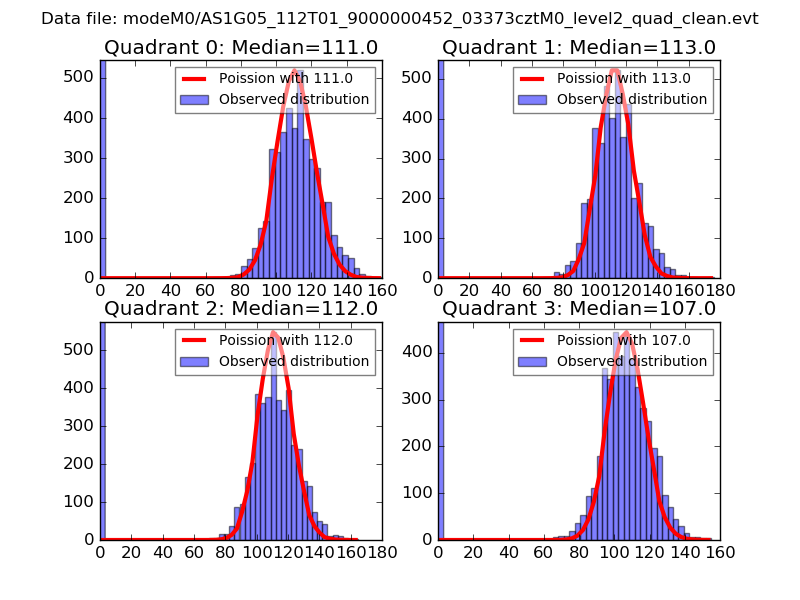 |
 |
| Quadrant-wise count rates Data is divided into 100 sec bins |
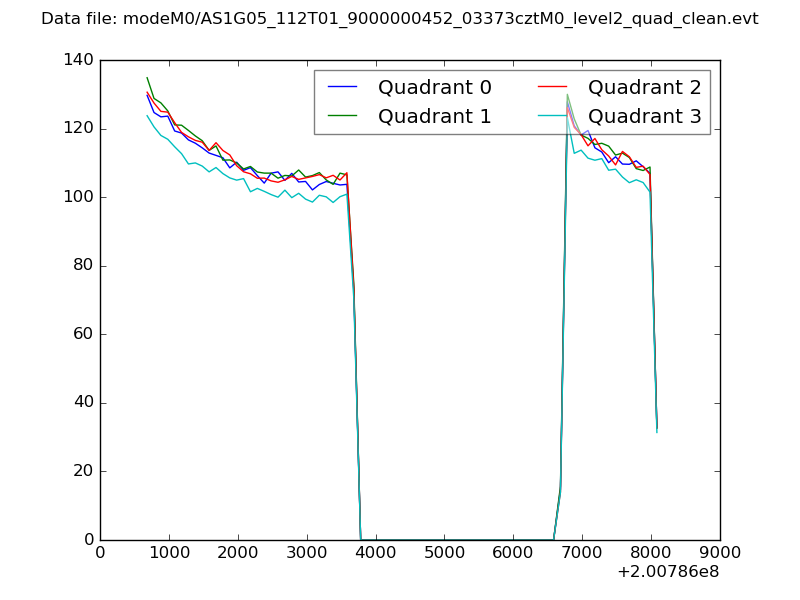 |
|
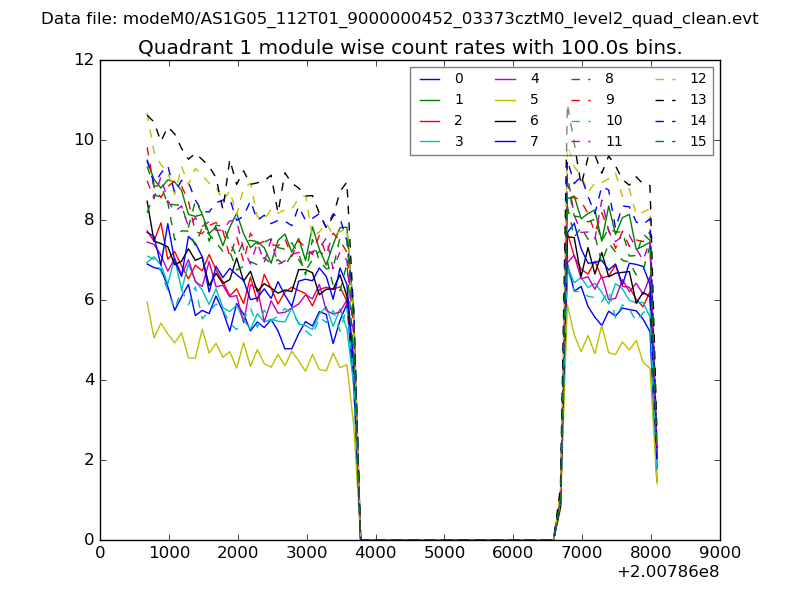
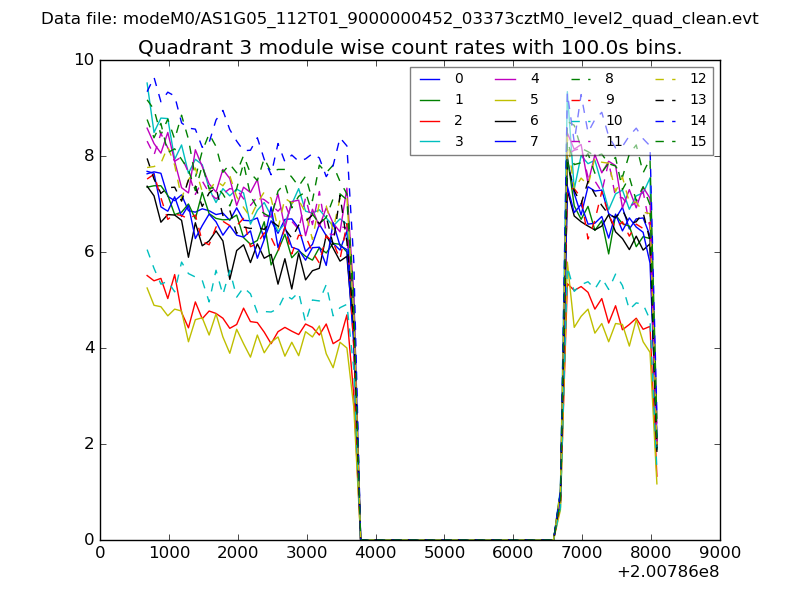
| Module-wise count rates for Quadrant A Data is divided into 100 sec bins |
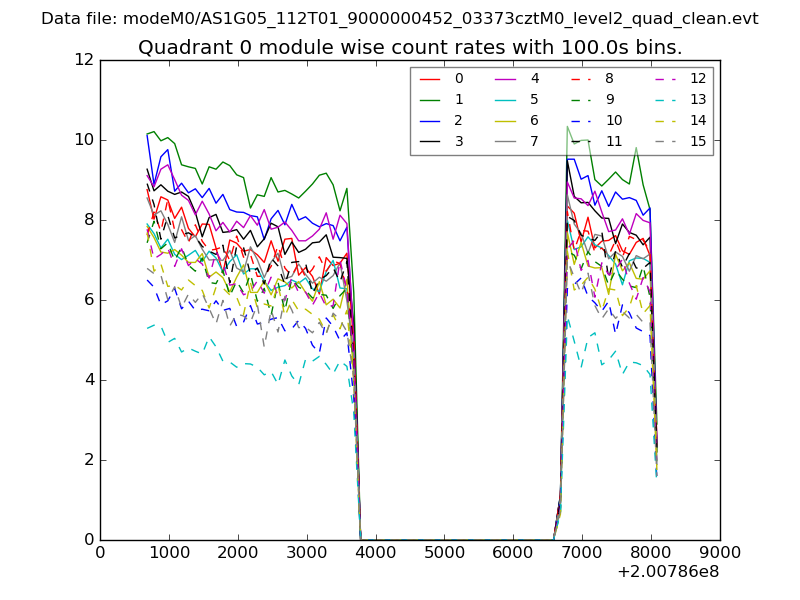 |
 |
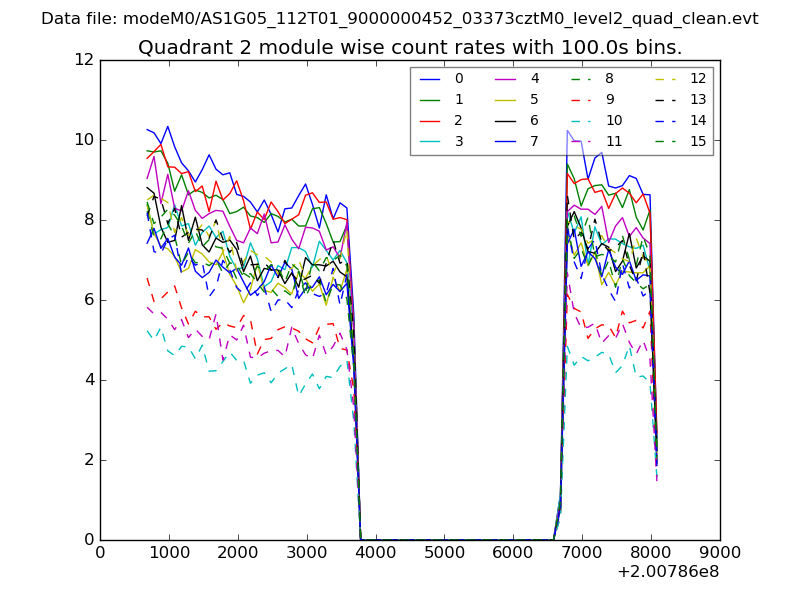
| Module-wise count rates for Quadrant B Data is divided into 100 sec bins |
 |
 |
| Module-wise count rates for Quadrant C Data is divided into 100 sec bins |
 |
 |
| Module-wise count rates for Quadrant D Data is divided into 100 sec bins |
 |
 |
| Parameter | Plot |
|---|---|
| CZT HV Monitor | 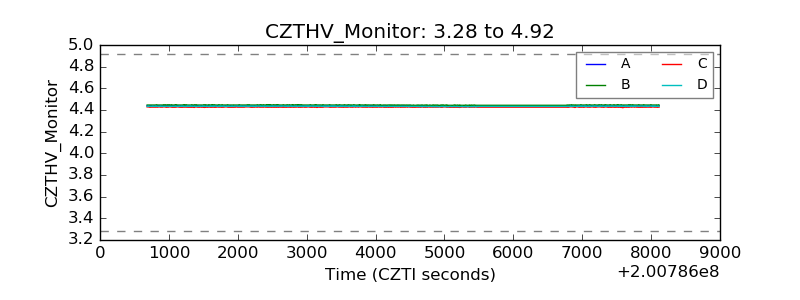 |
| D_VDD | 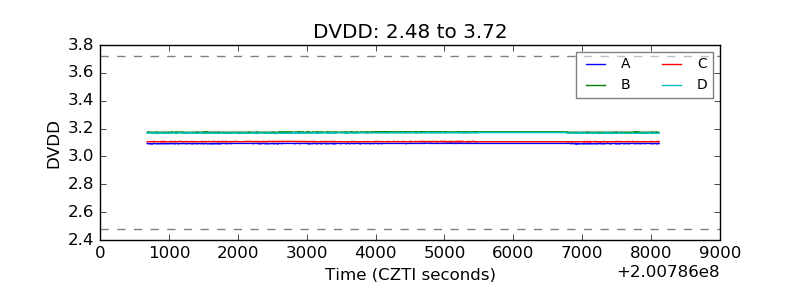 |
| Temperature 1 | 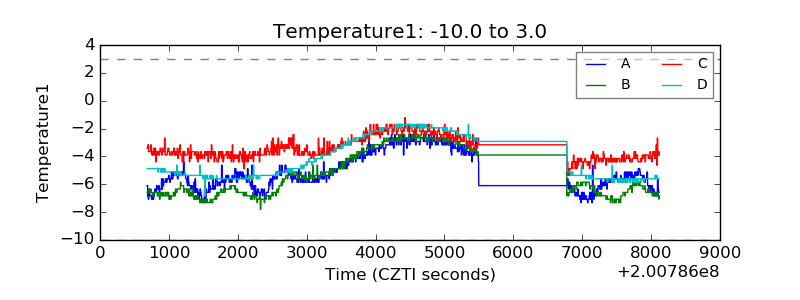 |
| Veto HV Monitor | 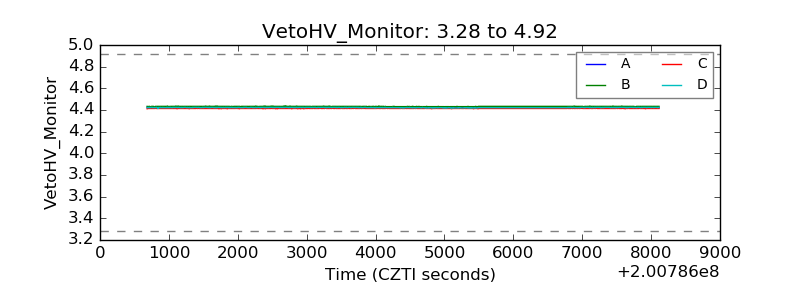 |
| Veto LLD | 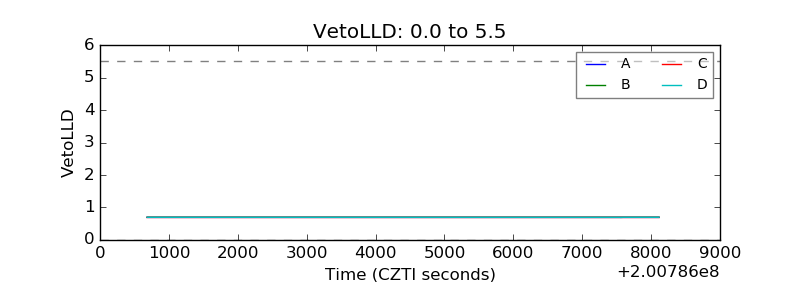 |
| Alpha Counter | 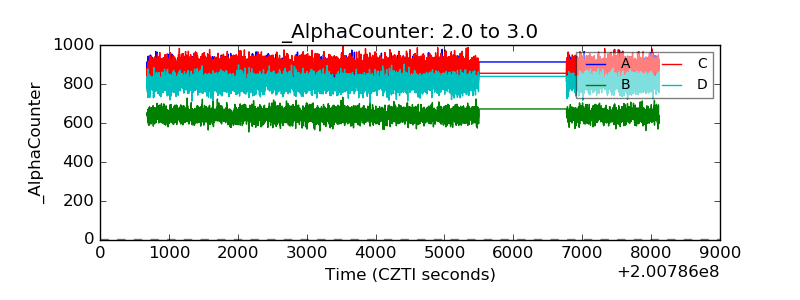 |
| _CPM_Rate | 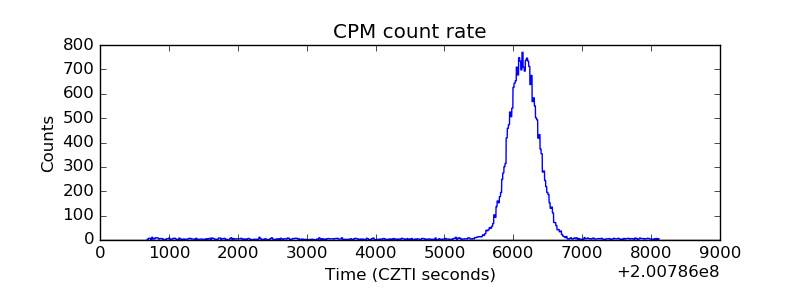 |
| CZT Counter | 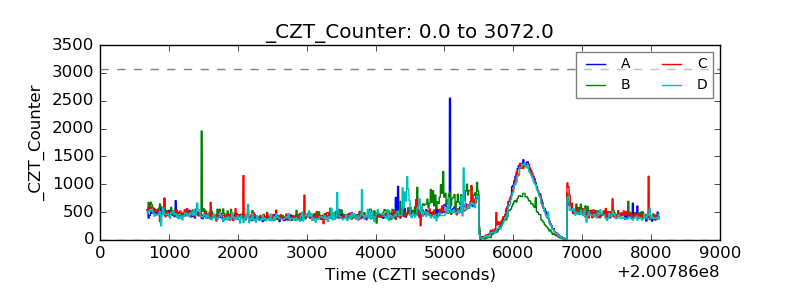 |
| +2.5 Volts monitor |  |
| +5 Volts monitor |  |
| _ROLL_ROT | 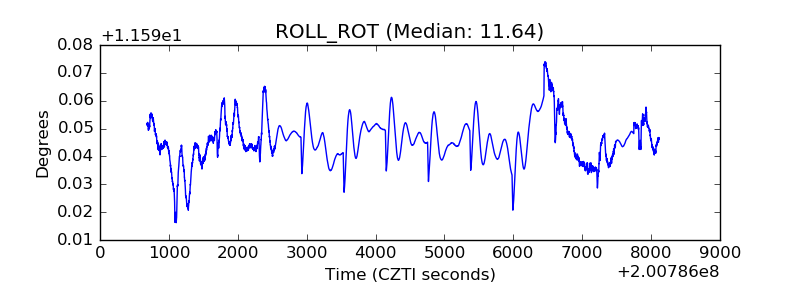 |
| _Roll_DEC | 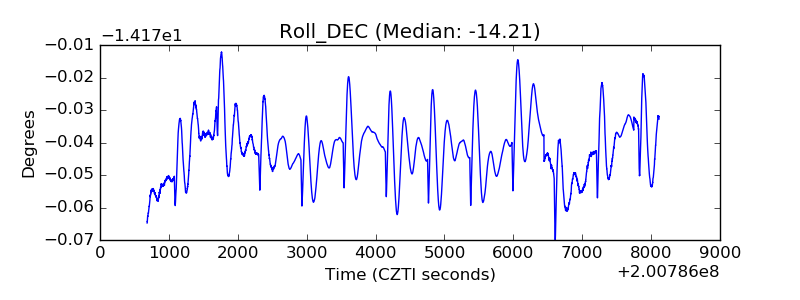 |
| _Roll_RA | 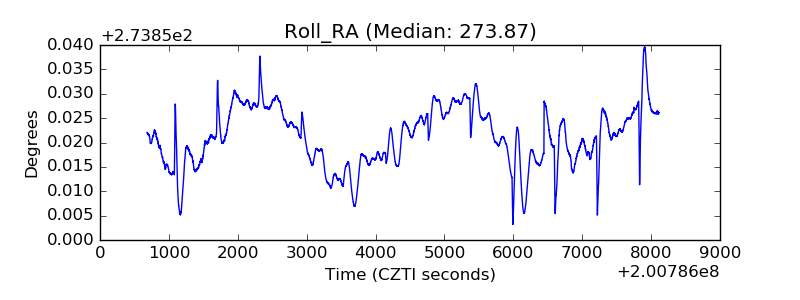 |
| Veto Counter | 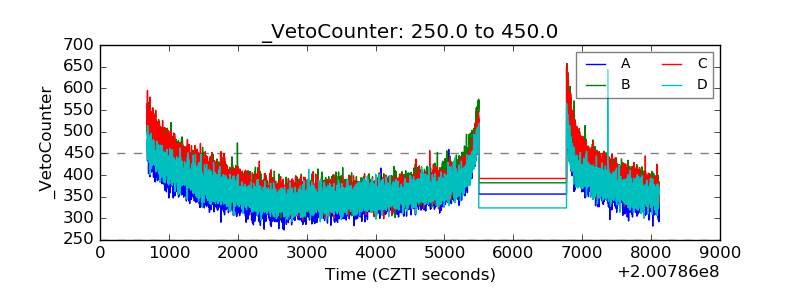 |