| Param | Original file | Final file |
|---|---|---|
| Filename | modeM0/AS1G05_112T01_9000000452_03374cztM0_level2.evt | modeM0/AS1G05_112T01_9000000452_03374cztM0_level2_quad_clean.evt |
| Size (bytes) | 448,807,680 | 74,825,280 |
| Size | 428.0 MB | 71.4 MB |
| Events in quadrant A | 3,056,036 | 455,824 |
| Events in quadrant B | 3,302,479 | 461,732 |
| Events in quadrant C | 3,877,757 | 456,636 |
| Events in quadrant D | 2,915,125 | 439,182 |
| Mode M9 | |||
|---|---|---|---|
| Quadrant | BADHDUFLAG | Total packets | Discarded packets |
| A | 0 | 17 | 0 |
| B | 0 | 17 | 0 |
| C | 0 | 17 | 0 |
| D | 0 | 18 | 0 |
| Mode SS | |||
|---|---|---|---|
| Quadrant | BADHDUFLAG | Total packets | Discarded packets |
| A | 0 | 134 | 0 |
| B | 0 | 134 | 0 |
| C | 0 | 134 | 0 |
| D | 0 | 134 | 0 |
| Mode M0 | |||
|---|---|---|---|
| Quadrant | BADHDUFLAG | Total packets | Discarded packets |
| A | 0 | 13673 | 3 |
| B | 0 | 14093 | 2 |
| C | 0 | 15865 | 2 |
| D | 0 | 13436 | 2 |
| Quadrant | Total seconds | Saturated seconds | Saturation percentage |
|---|---|---|---|
| A | 6477 | 21 | 0.324224% |
| B | 6477 | 48 | 0.741084% |
| C | 6477 | 225 | 3.473830% |
| D | 6477 | 10 | 0.154392% |
Noise dominated data is calculated using 1-second bins in cleaned event files. If a bin has >2000 counts, and if more than 50% of those come from <1% of pixels, then it is considered to be noise-dominated and hence unusable.
| Quadrant | # 1 sec bins | Bins with >0 counts | Bins with >2000 counts | High rate bins dominated by noise | Noise dominated (total time) | Noise dominated (detector-on time) | Marked lightcurve |
|---|---|---|---|---|---|---|---|
| A | 7557 | 6478 | 2 | 2 | 0.03% | 0.03% | 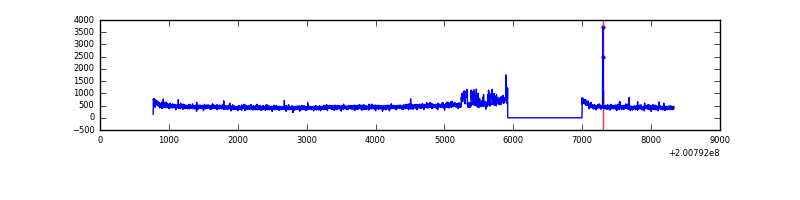 |
| B | 7557 | 6478 | 13 | 13 | 0.17% | 0.20% | 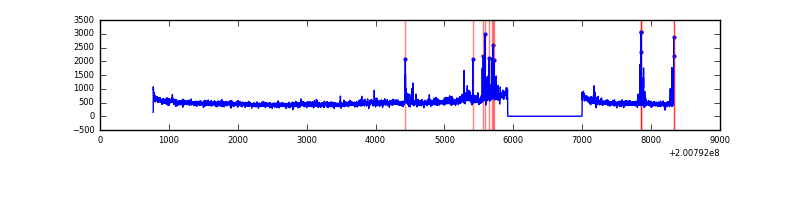 |
| C | 7557 | 6478 | 202 | 202 | 2.67% | 3.12% |  |
| D | 7557 | 6478 | 2 | 2 | 0.03% | 0.03% | 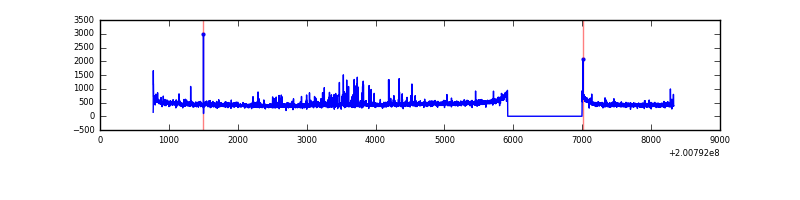 |
Top three noisy pixels from each quadrant. If the there are fewer than three noisy pixels in the level2.evt file, extra rows are filled as -1
| Pixel properties | Quadrant properties | ||||||
|---|---|---|---|---|---|---|---|
| Quadrant | DetID | PixID | Counts | Sigma | Mean | Median | Sigma |
| A | 10 | 220 | 88706 | 565.07 | 757 | 740 | 155.7 |
| A | 0 | 118 | 21885 | 135.83 | 757 | 740 | 155.7 |
| A | 0 | 50 | 15204 | 92.91 | 757 | 740 | 155.7 |
| B | 15 | 204 | 167887 | 1112.93 | 771 | 753 | 150.2 |
| B | 2 | 249 | 126332 | 836.22 | 771 | 753 | 150.2 |
| B | 0 | 229 | 20440 | 131.09 | 771 | 753 | 150.2 |
| C | 15 | 208 | 953043 | 5525.72 | 736 | 740 | 172.3 |
| C | 1 | 16 | 14330 | 78.86 | 736 | 740 | 172.3 |
| C | 12 | 4 | 7964 | 41.92 | 736 | 740 | 172.3 |
| D | 12 | 110 | 74522 | 409.97 | 738 | 718 | 180.0 |
| D | 13 | 223 | 26324 | 142.24 | 738 | 718 | 180.0 |
| D | 2 | 37 | 10345 | 53.48 | 738 | 718 | 180.0 |
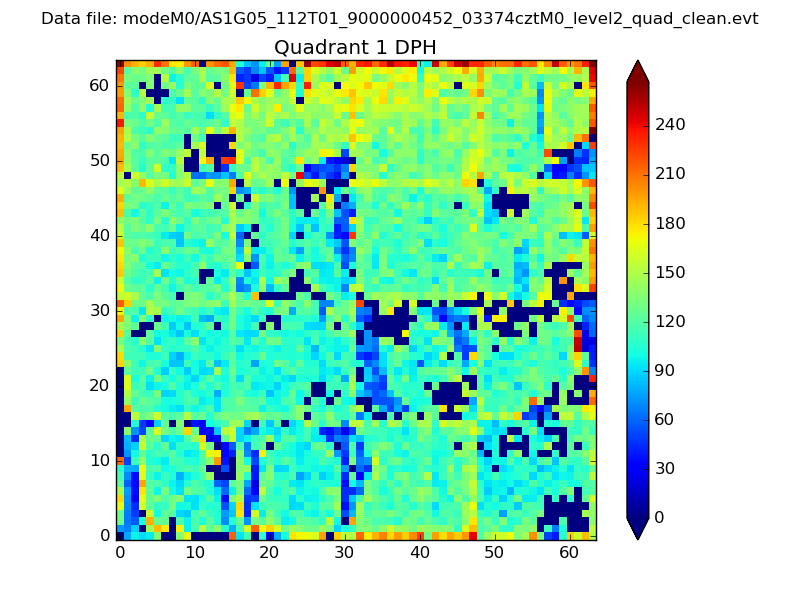
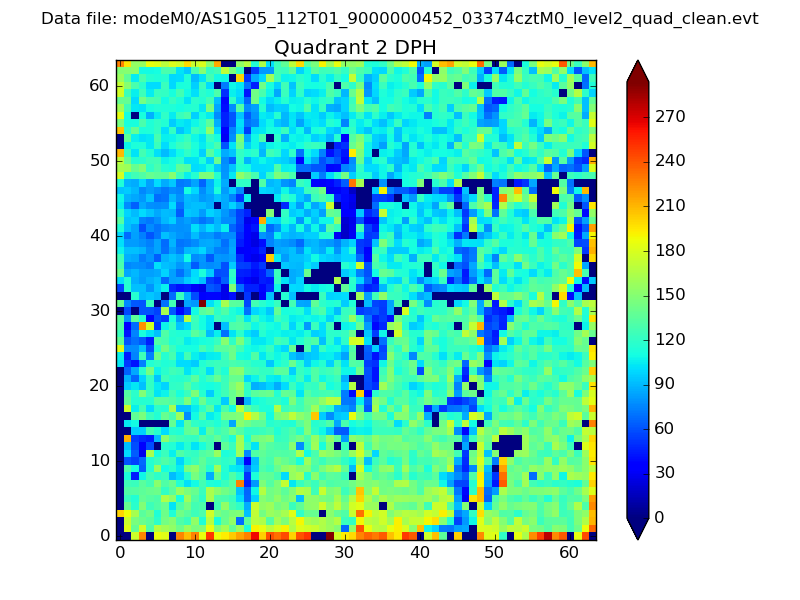
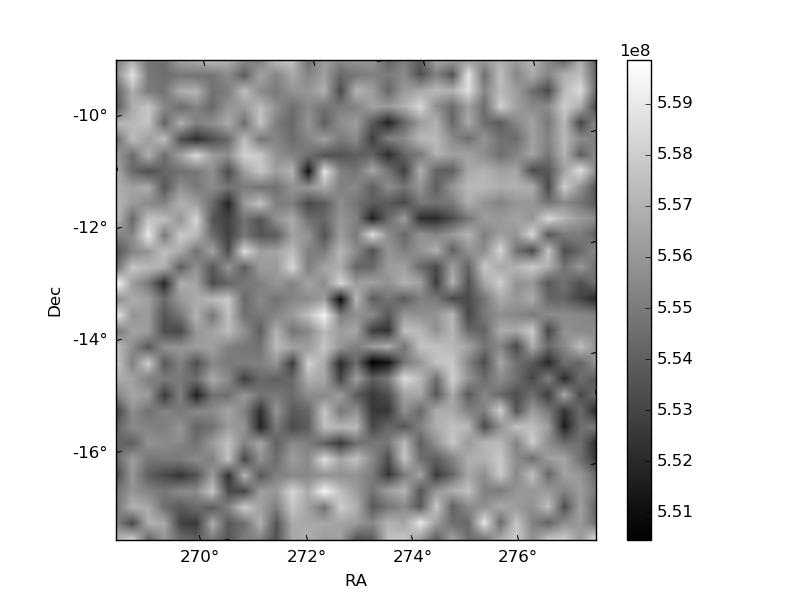
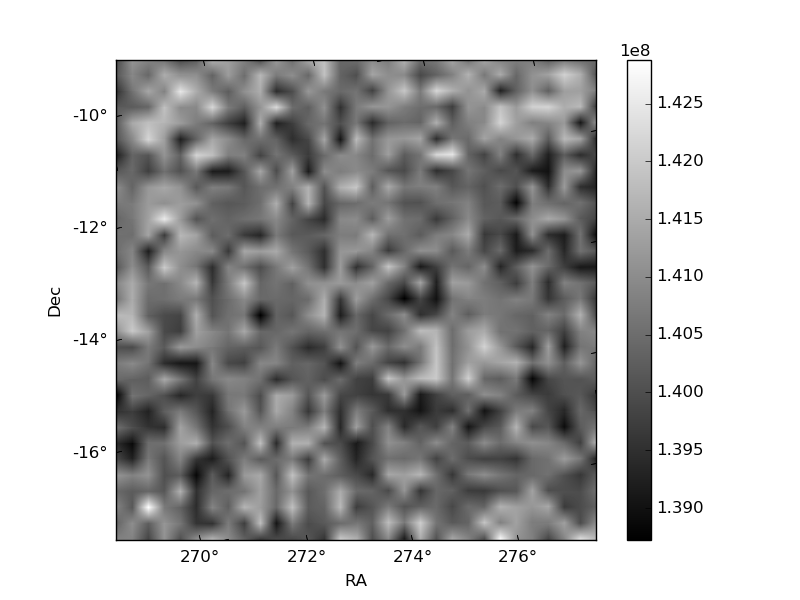
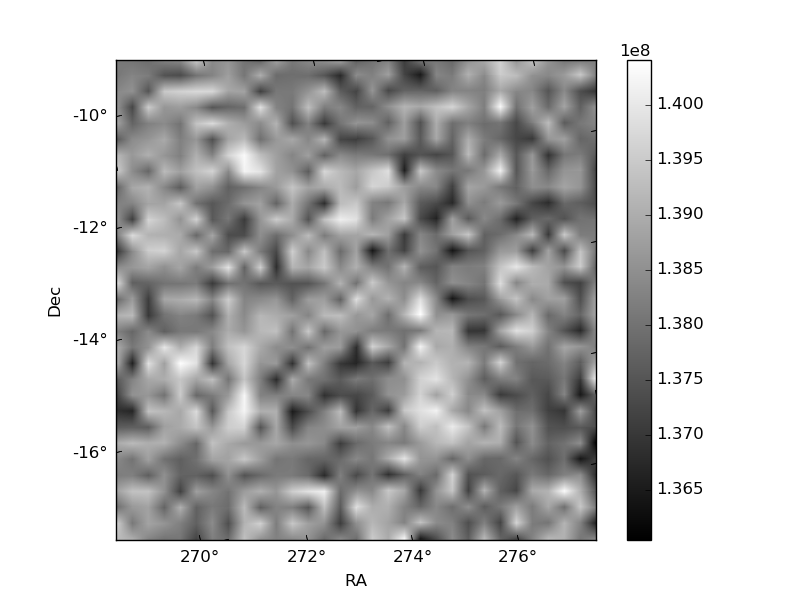
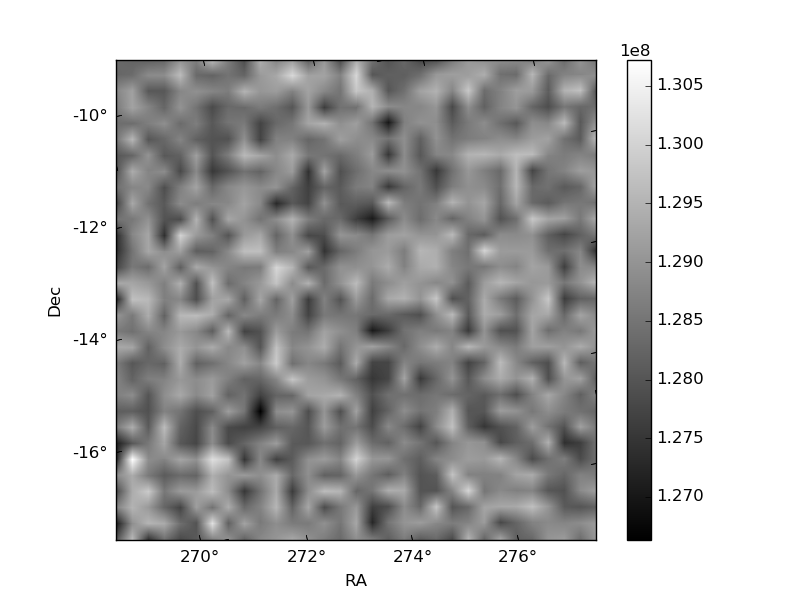
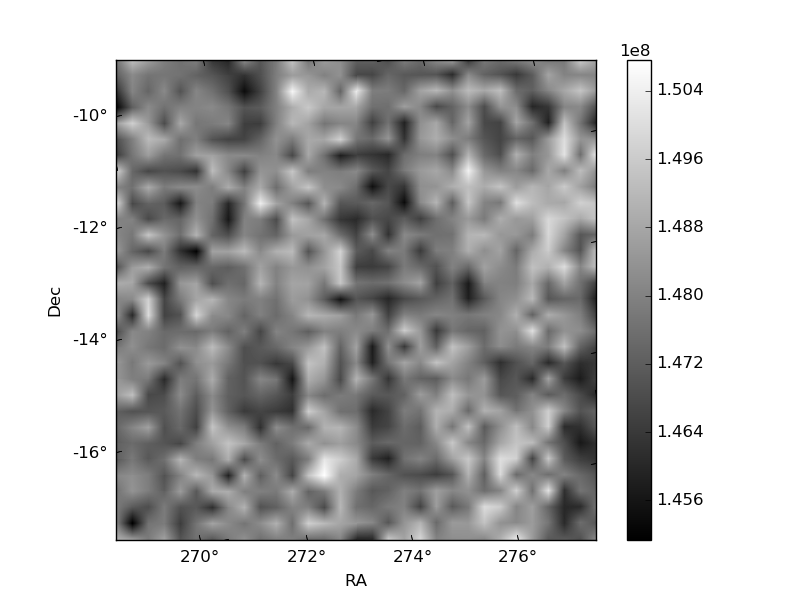
Histogram calculated using DETX and DETY for each event in the final _common_clean file
| Quadrant A | 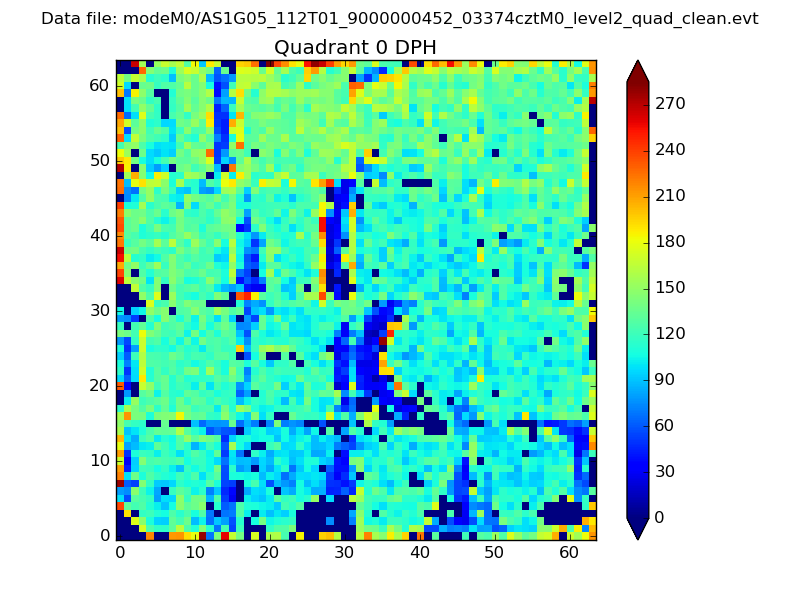 |
 |
Quadrant B |
|---|---|---|---|
| Quadrant D | 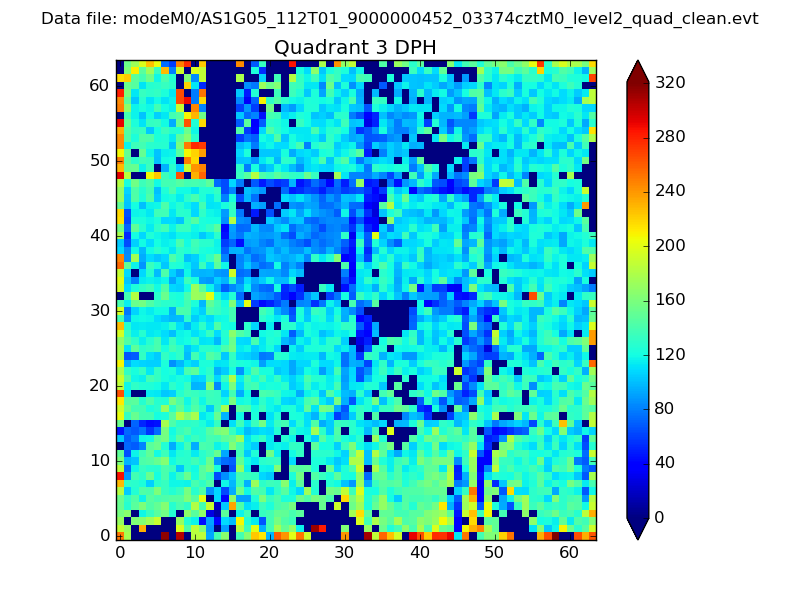 |
 |
Quadrant C |
| Plot type | Count rate plots | Images |
|---|---|---|
| Comparison with Poisson distribution Blue bars denote a histogram of data divided into 1 sec bins. Red curve is a Poisson curve with rate = median count rate of data. |
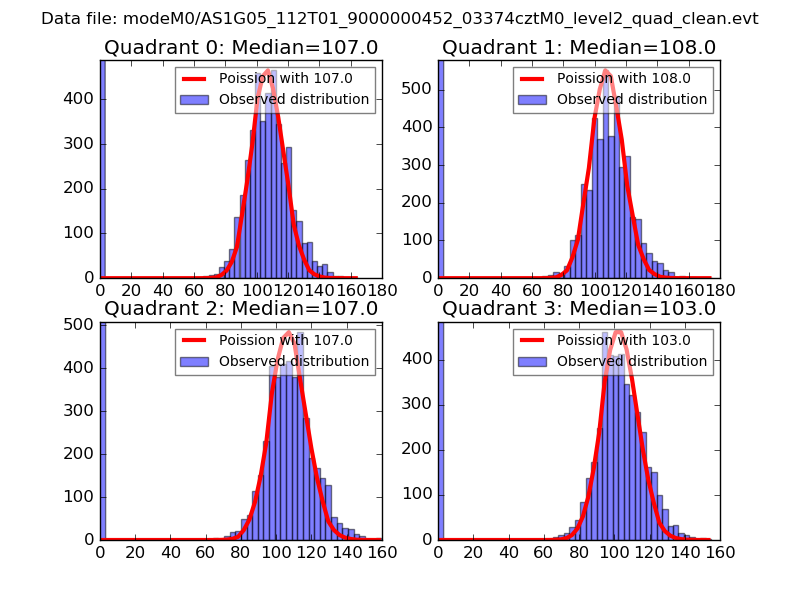 |
 |
| Quadrant-wise count rates Data is divided into 100 sec bins |
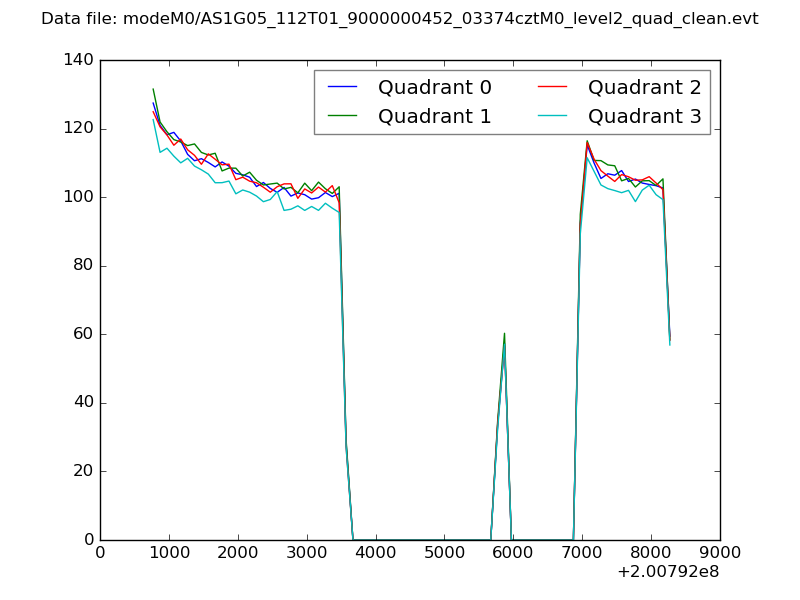 |
|
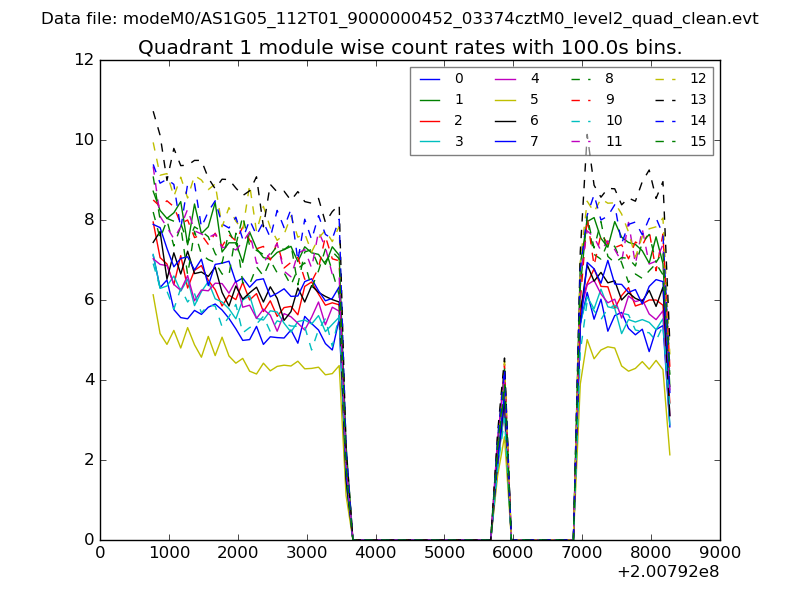
| Module-wise count rates for Quadrant A Data is divided into 100 sec bins |
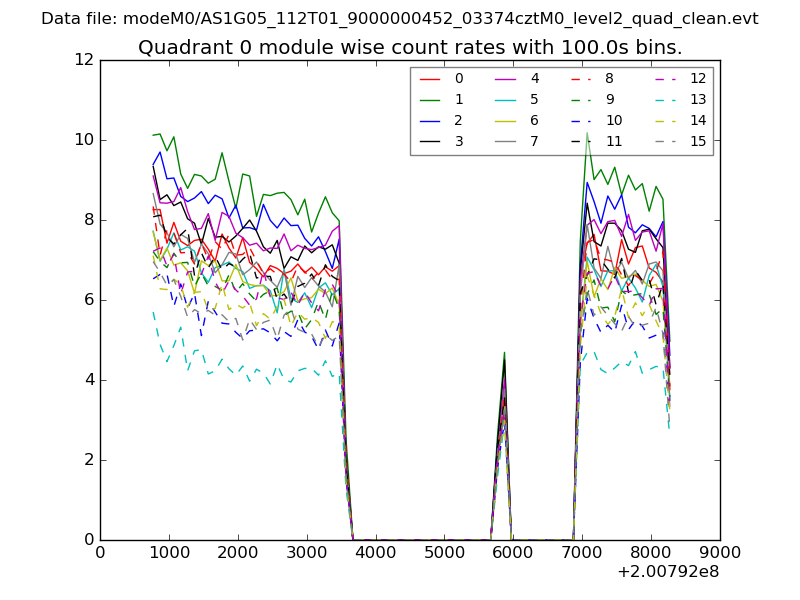 |
 |
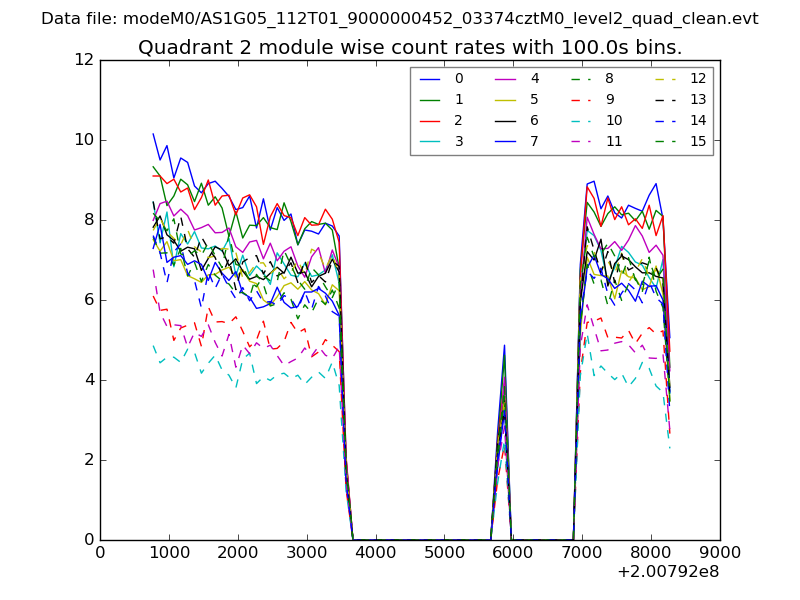
| Module-wise count rates for Quadrant B Data is divided into 100 sec bins |
 |
 |
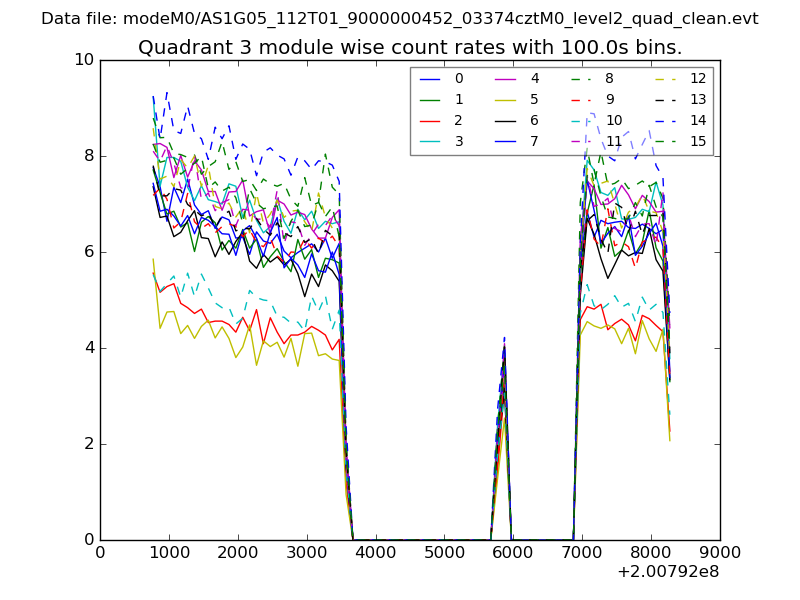
| Module-wise count rates for Quadrant C Data is divided into 100 sec bins |
 |
 |
| Module-wise count rates for Quadrant D Data is divided into 100 sec bins |
 |
 |
| Parameter | Plot |
|---|---|
| CZT HV Monitor | 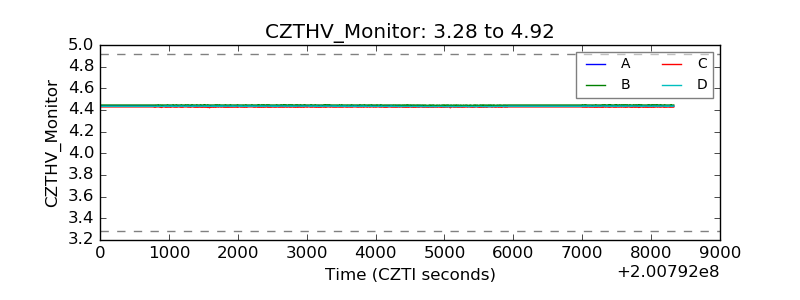 |
| D_VDD | 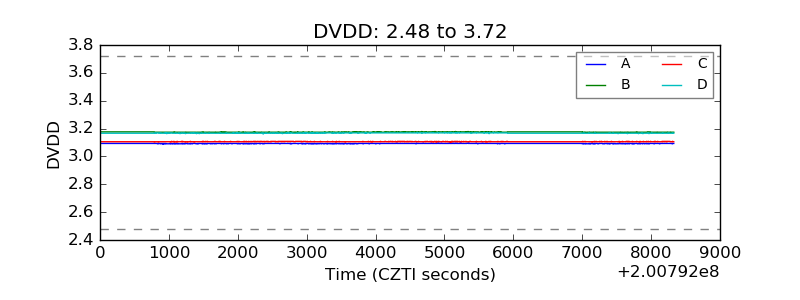 |
| Temperature 1 | 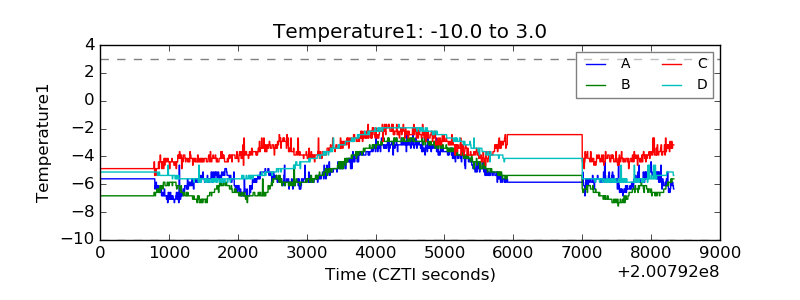 |
| Veto HV Monitor | 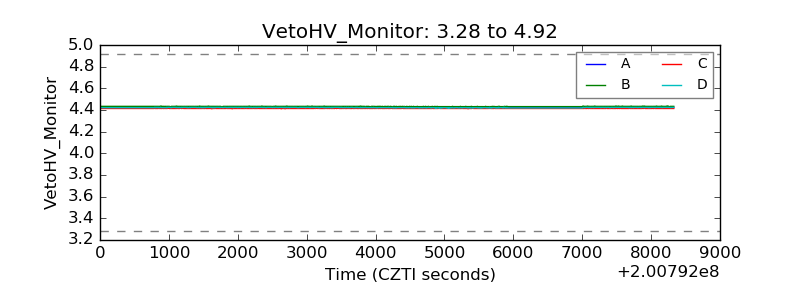 |
| Veto LLD | 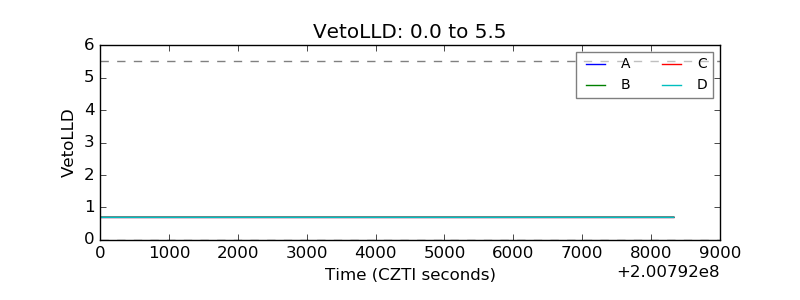 |
| Alpha Counter | 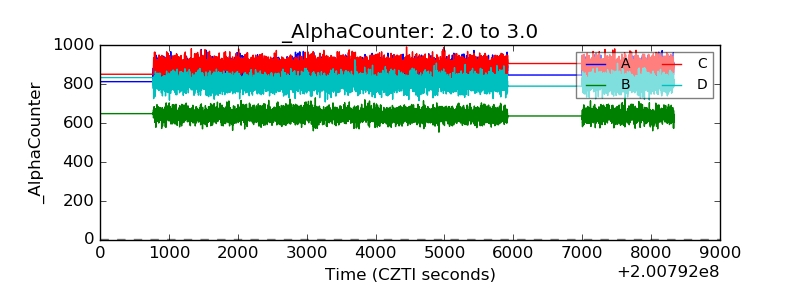 |
| _CPM_Rate | 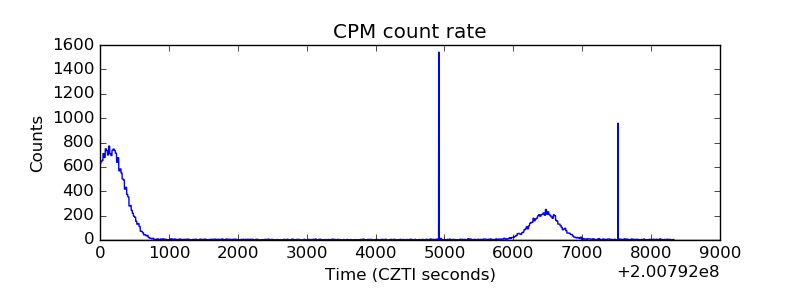 |
| CZT Counter | 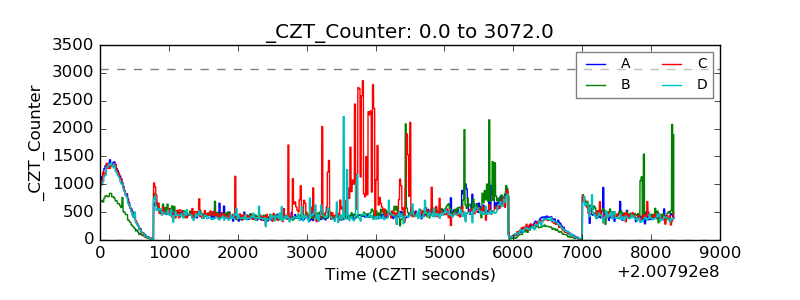 |
| +2.5 Volts monitor | 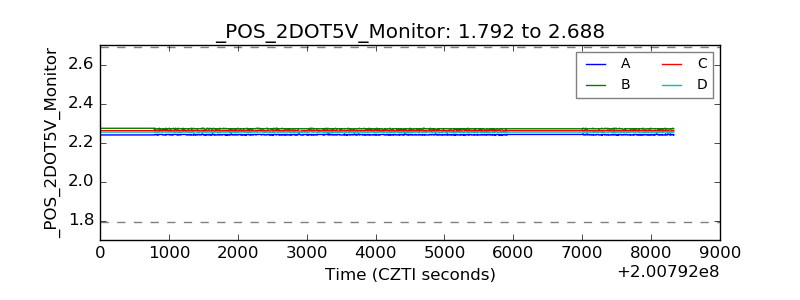 |
| +5 Volts monitor |  |
| _ROLL_ROT | 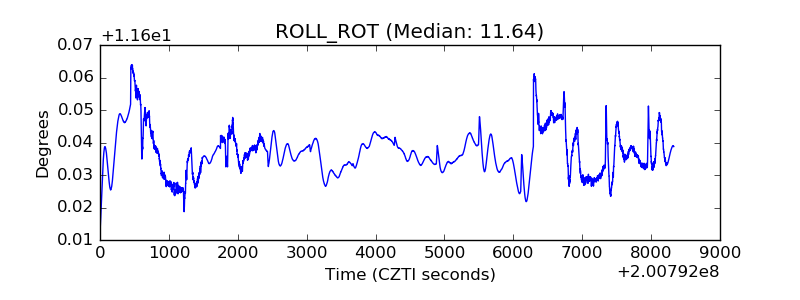 |
| _Roll_DEC | 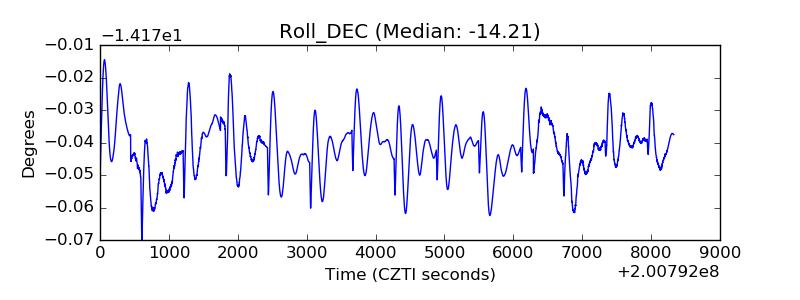 |
| _Roll_RA | 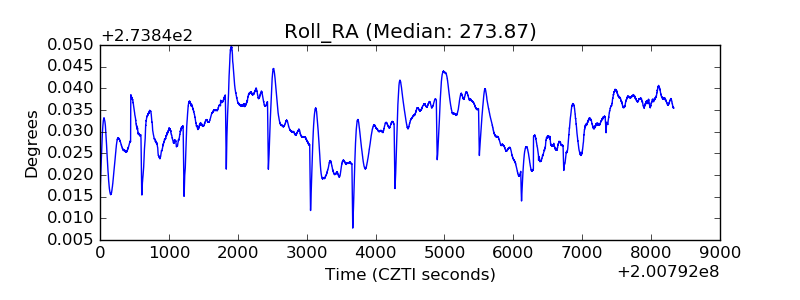 |
| Veto Counter | 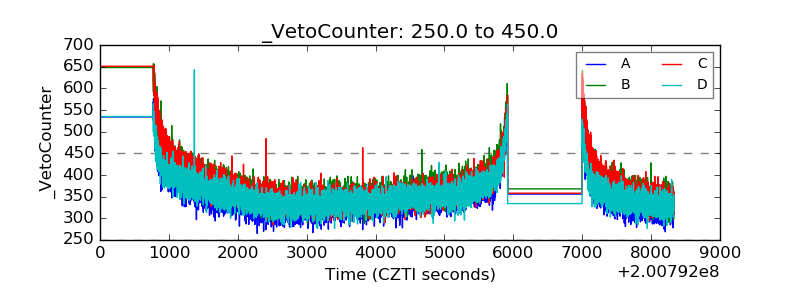 |