| Param | Original file | Final file |
|---|---|---|
| Filename | modeM0/AS1G05_112T01_9000000452_03375cztM0_level2.evt | modeM0/AS1G05_112T01_9000000452_03375cztM0_level2_quad_clean.evt |
| Size (bytes) | 2,381,760 | 884,160 |
| Size | 2.3 MB | 863.4 KB |
| Events in quadrant A | 18,557 | 4,606 |
| Events in quadrant B | 16,517 | 3,837 |
| Events in quadrant C | 18,313 | 4,169 |
| Events in quadrant D | 13,018 | 3,151 |
| Mode SS | |||
|---|---|---|---|
| Quadrant | BADHDUFLAG | Total packets | Discarded packets |
| A | 0 | 29 | 29 |
| B | 0 | 30 | 28 |
| C | 0 | 34 | 32 |
| D | 0 | 31 | 28 |
| Mode M0 | |||
|---|---|---|---|
| Quadrant | BADHDUFLAG | Total packets | Discarded packets |
| A | 0 | 2997 | 2907 |
| B | 0 | 3181 | 3107 |
| C | 0 | 3463 | 3380 |
| D | 0 | 3032 | 2965 |
| Quadrant | Total seconds | Saturated seconds | Saturation percentage |
|---|---|---|---|
| A | 45 | 0 | 0.000000% |
| B | 37 | 0 | 0.000000% |
| C | 41 | 0 | 0.000000% |
| D | 34 | 0 | 0.000000% |
Noise dominated data is calculated using 1-second bins in cleaned event files. If a bin has >2000 counts, and if more than 50% of those come from <1% of pixels, then it is considered to be noise-dominated and hence unusable.
| Quadrant | # 1 sec bins | Bins with >0 counts | Bins with >2000 counts | High rate bins dominated by noise | Noise dominated (total time) | Noise dominated (detector-on time) | Marked lightcurve |
|---|---|---|---|---|---|---|---|
| A | 654 | 84 | 0 | 0 | 0.00% | 0.00% | 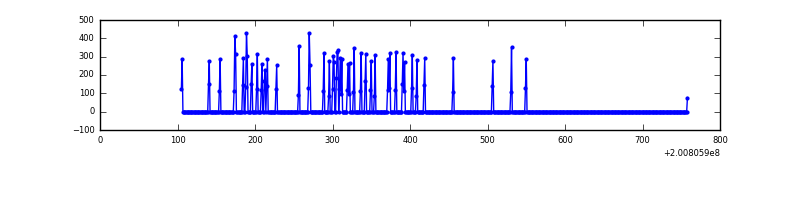 |
| B | 596 | 68 | 0 | 0 | 0.00% | 0.00% | 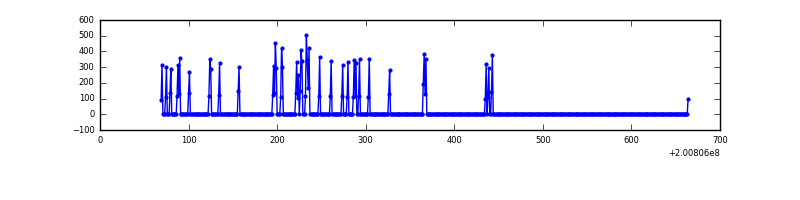 |
| C | 436 | 73 | 0 | 0 | 0.00% | 0.00% | 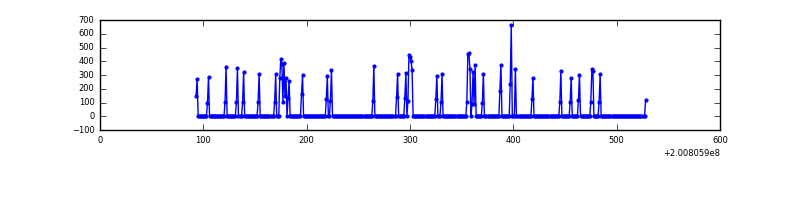 |
| D | 657 | 65 | 0 | 0 | 0.00% | 0.00% | 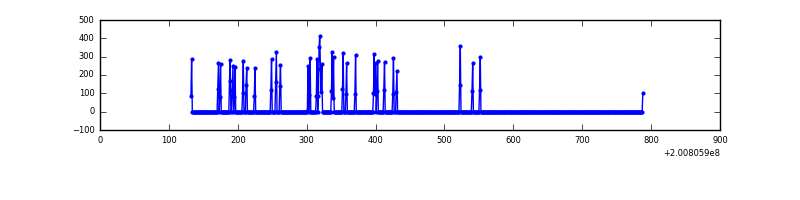 |
Top three noisy pixels from each quadrant. If the there are fewer than three noisy pixels in the level2.evt file, extra rows are filled as -1
| Pixel properties | Quadrant properties | ||||||
|---|---|---|---|---|---|---|---|
| Quadrant | DetID | PixID | Counts | Sigma | Mean | Median | Sigma |
| A | 14 | 249 | 47 | 19.01 | 4 | 4 | 2.3 |
| A | 10 | 220 | 44 | 17.68 | 4 | 4 | 2.3 |
| A | 0 | 226 | 42 | 16.8 | 4 | 4 | 2.3 |
| B | 2 | 249 | 548 | 277.01 | 3 | 3 | 2.0 |
| B | 0 | 229 | 325 | 163.66 | 3 | 3 | 2.0 |
| B | 15 | 204 | 148 | 73.7 | 3 | 3 | 2.0 |
| C | 6 | 80 | 1050 | 462.69 | 4 | 4 | 2.3 |
| C | 12 | 4 | 54 | 22.12 | 4 | 4 | 2.3 |
| C | 15 | 208 | 29 | 11.06 | 4 | 4 | 2.3 |
| D | 14 | 226 | 35 | 17.45 | 3 | 3 | 1.8 |
| D | 2 | 37 | 29 | 14.18 | 3 | 3 | 1.8 |
| D | 13 | 137 | 25 | 12.0 | 3 | 3 | 1.8 |
Histogram calculated using DETX and DETY for each event in the final _common_clean file
| Quadrant A | 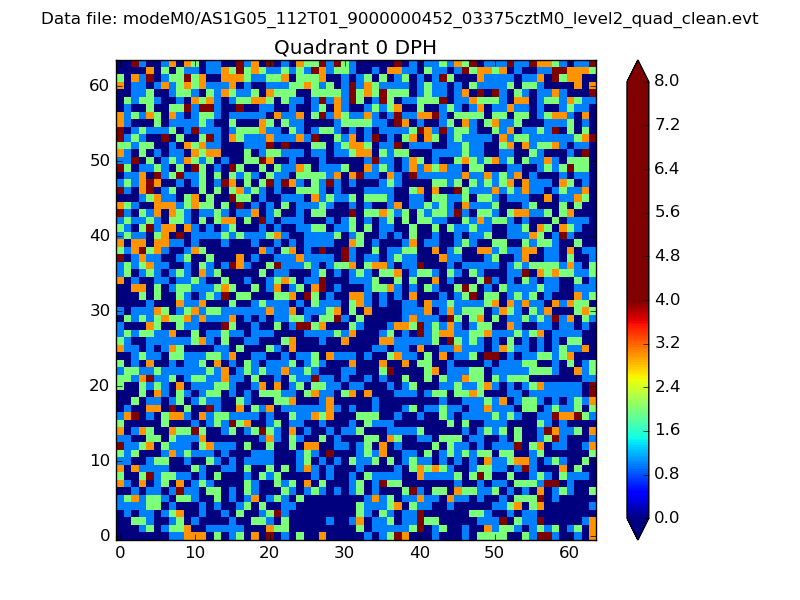 |
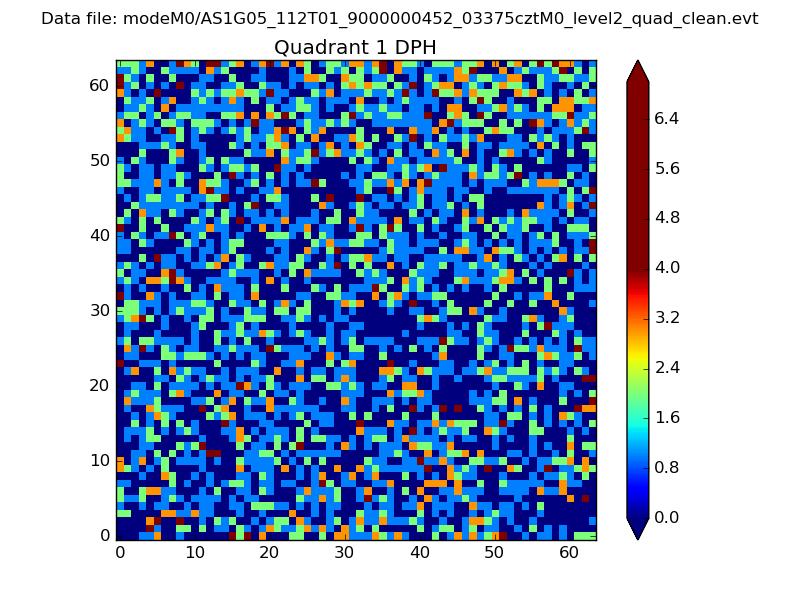 |
Quadrant B |
|---|---|---|---|
| Quadrant D |  |
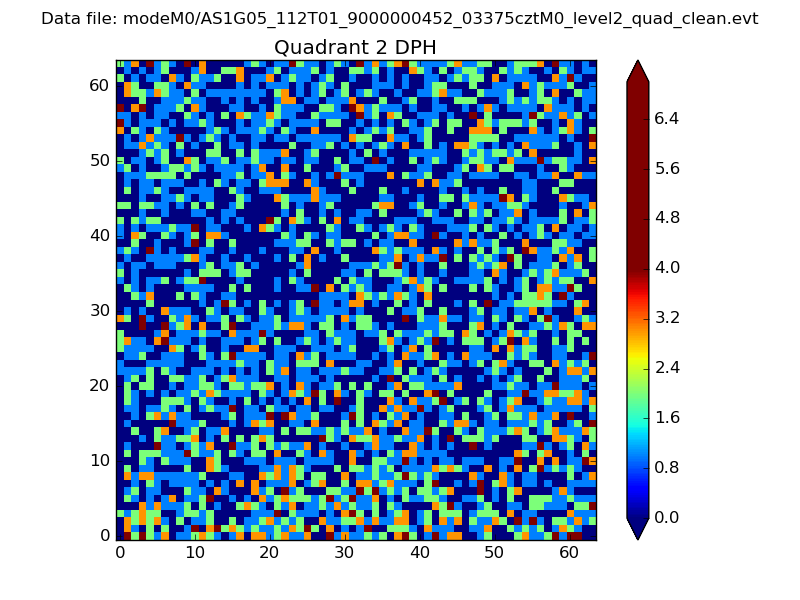 |
Quadrant C |
| Plot type | Count rate plots | Images |
|---|---|---|
| Comparison with Poisson distribution Blue bars denote a histogram of data divided into 1 sec bins. Red curve is a Poisson curve with rate = median count rate of data. |
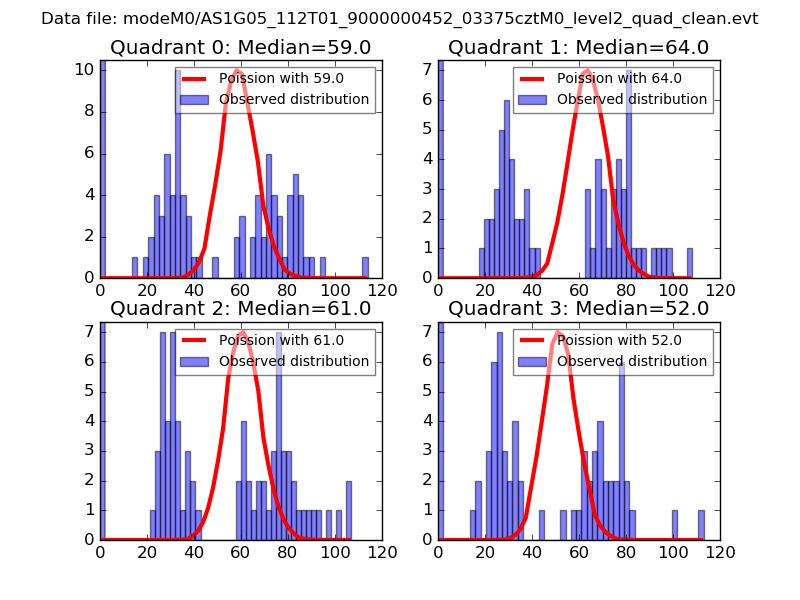 |
 |
| Quadrant-wise count rates Data is divided into 100 sec bins |
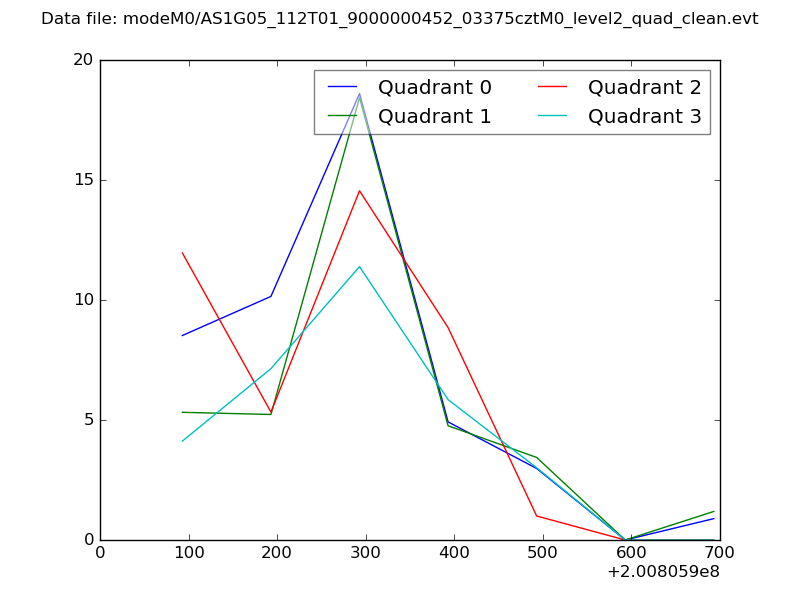 |
|
| Module-wise count rates for Quadrant A Data is divided into 100 sec bins |
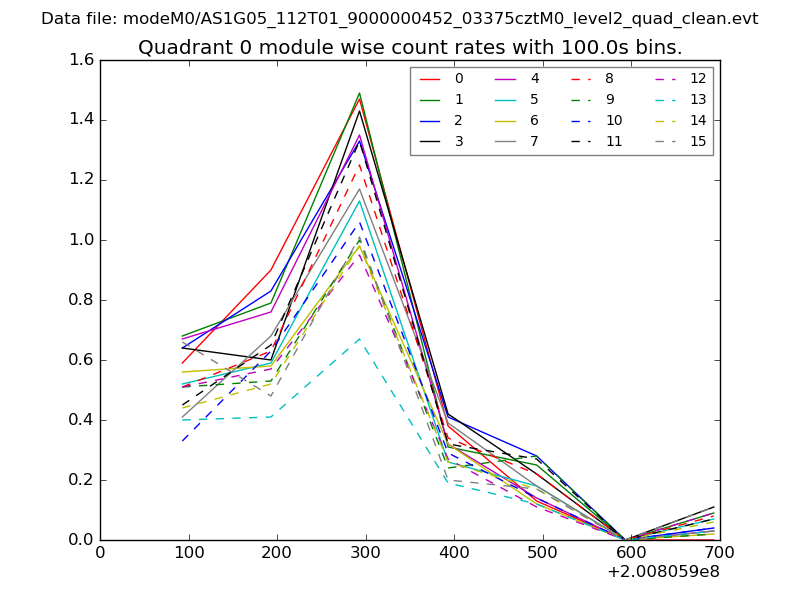 |
 |
| Module-wise count rates for Quadrant B Data is divided into 100 sec bins |
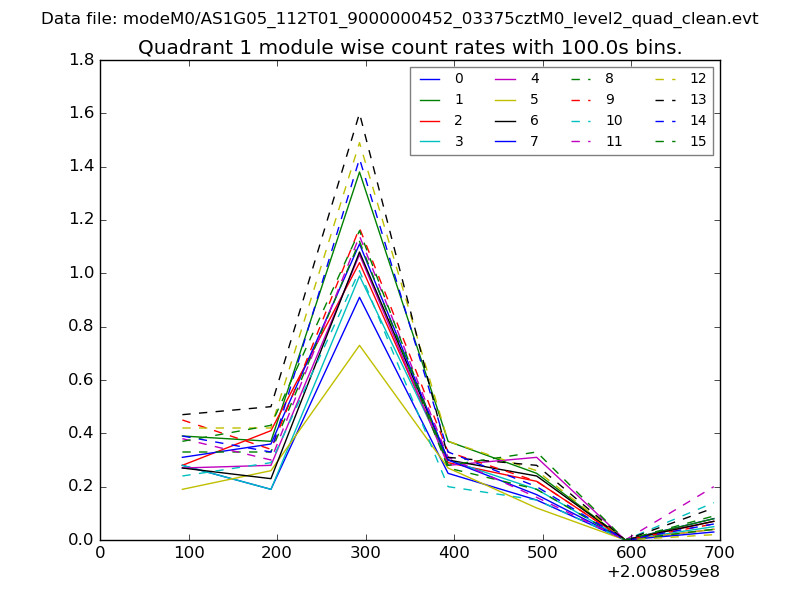 |
 |
| Module-wise count rates for Quadrant C Data is divided into 100 sec bins |
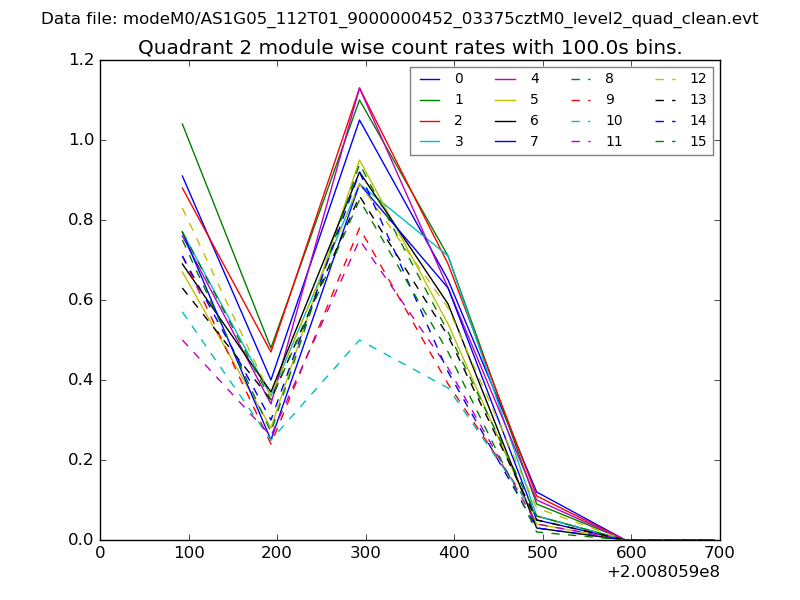 |
 |
| Module-wise count rates for Quadrant D Data is divided into 100 sec bins |
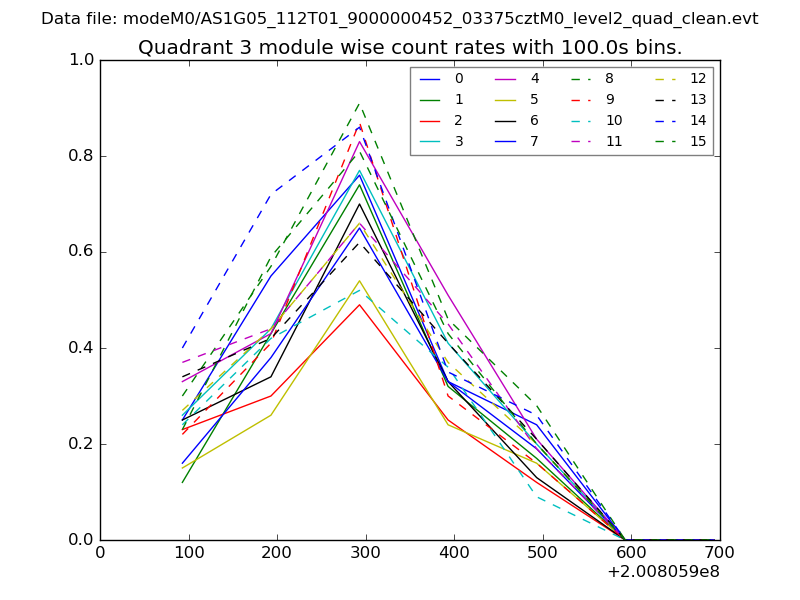 |
 |
| Parameter | Plot |
|---|---|
| CZT HV Monitor | 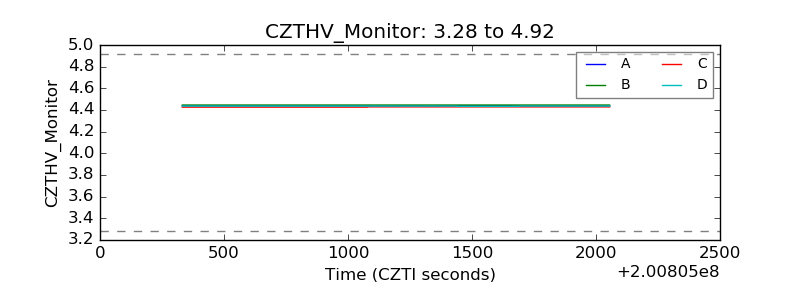 |
| D_VDD |  |
| Temperature 1 | 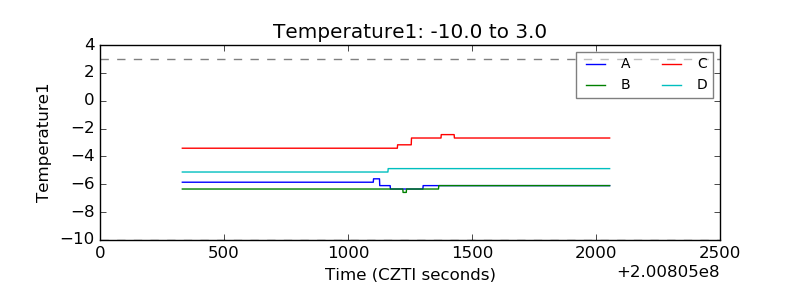 |
| Veto HV Monitor | 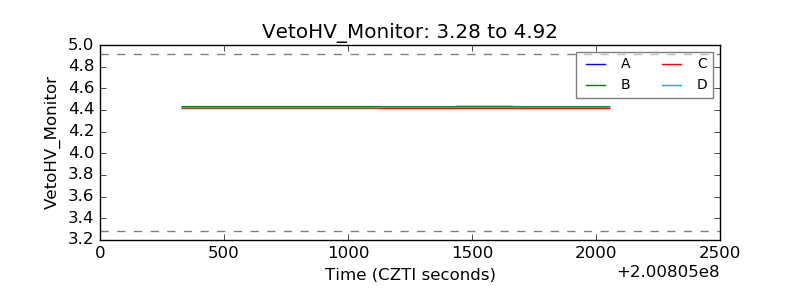 |
| Veto LLD | 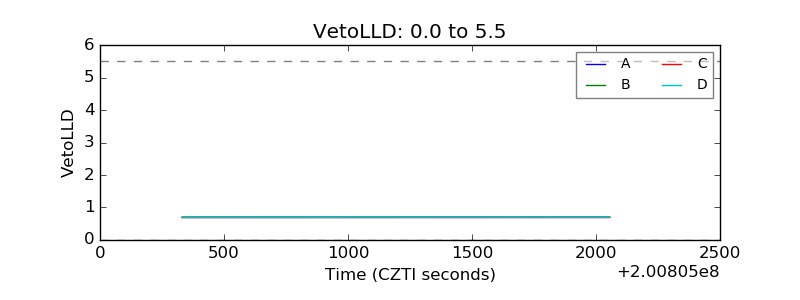 |
| Alpha Counter | 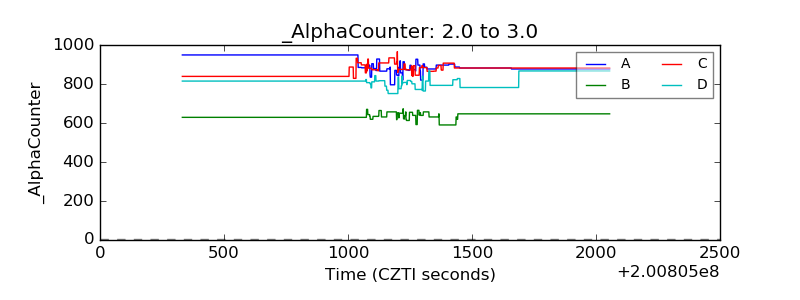 |
| _CPM_Rate | 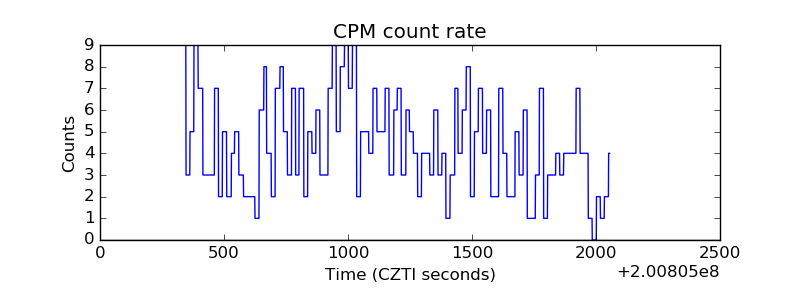 |
| CZT Counter |  |
| +2.5 Volts monitor |  |
| +5 Volts monitor |  |
| Veto Counter | 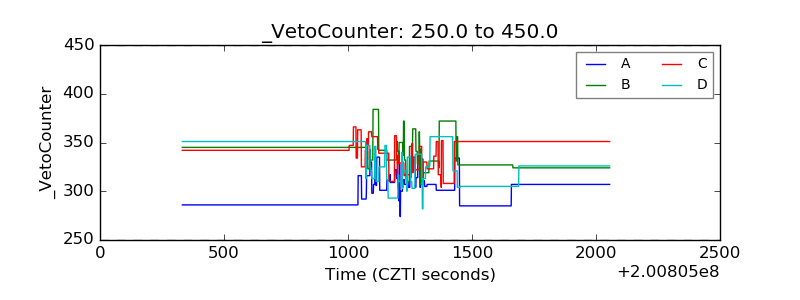 |