| Param | Original file | Final file |
|---|---|---|
| Filename | modeM0/AS1G05_112T01_9000000452_03377cztM0_level2.evt | modeM0/AS1G05_112T01_9000000452_03377cztM0_level2_quad_clean.evt |
| Size (bytes) | 574,683,840 | 86,794,560 |
| Size | 548.1 MB | 82.8 MB |
| Events in quadrant A | 3,911,419 | 520,299 |
| Events in quadrant B | 5,806,659 | 523,917 |
| Events in quadrant C | 3,678,943 | 527,927 |
| Events in quadrant D | 3,473,166 | 508,772 |
| Mode SS | |||
|---|---|---|---|
| Quadrant | BADHDUFLAG | Total packets | Discarded packets |
| A | 0 | 158 | 0 |
| B | 0 | 158 | 0 |
| C | 0 | 158 | 0 |
| D | 0 | 158 | 0 |
| Mode M0 | |||
|---|---|---|---|
| Quadrant | BADHDUFLAG | Total packets | Discarded packets |
| A | 0 | 17175 | 1 |
| B | 0 | 22910 | 0 |
| C | 0 | 16630 | 0 |
| D | 0 | 16351 | 0 |
| Quadrant | Total seconds | Saturated seconds | Saturation percentage |
|---|---|---|---|
| A | 7868 | 294 | 3.736655% |
| B | 7868 | 488 | 6.202339% |
| C | 7868 | 118 | 1.499746% |
| D | 7868 | 127 | 1.614133% |
Noise dominated data is calculated using 1-second bins in cleaned event files. If a bin has >2000 counts, and if more than 50% of those come from <1% of pixels, then it is considered to be noise-dominated and hence unusable.
| Quadrant | # 1 sec bins | Bins with >0 counts | Bins with >2000 counts | High rate bins dominated by noise | Noise dominated (total time) | Noise dominated (detector-on time) | Marked lightcurve |
|---|---|---|---|---|---|---|---|
| A | 7868 | 7868 | 73 | 73 | 0.93% | 0.93% | 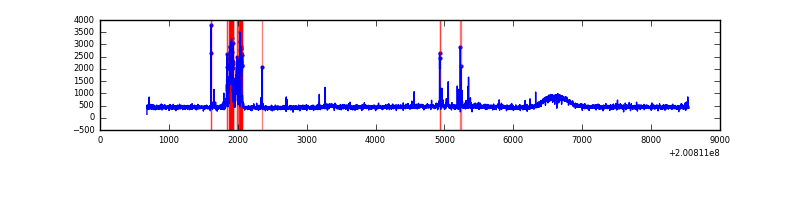 |
| B | 7868 | 7868 | 140 | 140 | 1.78% | 1.78% | 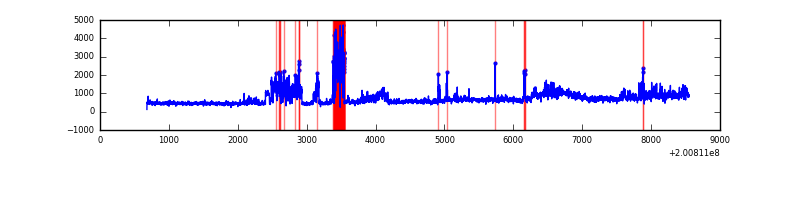 |
| C | 7868 | 7868 | 22 | 22 | 0.28% | 0.28% | 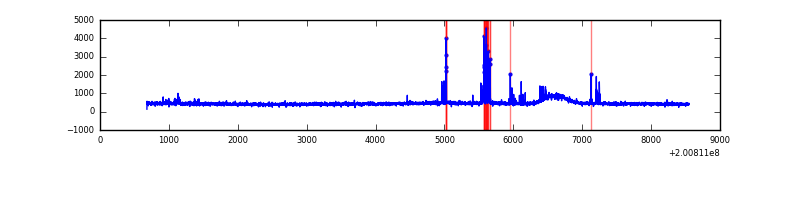 |
| D | 7868 | 7868 | 8 | 8 | 0.10% | 0.10% | 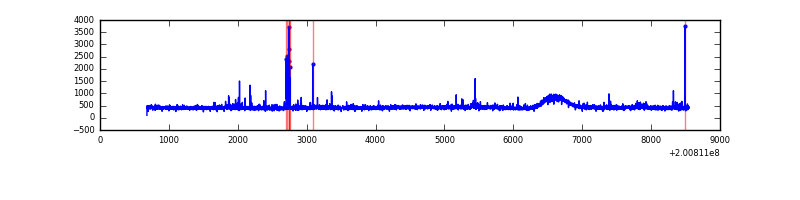 |
Top three noisy pixels from each quadrant. If the there are fewer than three noisy pixels in the level2.evt file, extra rows are filled as -1
| Pixel properties | Quadrant properties | ||||||
|---|---|---|---|---|---|---|---|
| Quadrant | DetID | PixID | Counts | Sigma | Mean | Median | Sigma |
| A | 0 | 50 | 347000 | 1833.95 | 914 | 891 | 188.7 |
| A | 14 | 249 | 19330 | 97.7 | 914 | 891 | 188.7 |
| A | 0 | 118 | 10879 | 52.92 | 914 | 891 | 188.7 |
| B | 4 | 170 | 1262096 | 7155.93 | 905 | 879 | 176.2 |
| B | 14 | 167 | 566754 | 3210.68 | 905 | 879 | 176.2 |
| B | 15 | 204 | 369119 | 2089.33 | 905 | 879 | 176.2 |
| C | 15 | 208 | 115703 | 545.65 | 895 | 897 | 210.4 |
| C | 6 | 80 | 29249 | 134.75 | 895 | 897 | 210.4 |
| C | 1 | 192 | 18369 | 83.04 | 895 | 897 | 210.4 |
| D | 13 | 223 | 53446 | 224.26 | 888 | 865 | 234.5 |
| D | 2 | 206 | 25339 | 104.38 | 888 | 865 | 234.5 |
| D | 10 | 34 | 12074 | 47.81 | 888 | 865 | 234.5 |
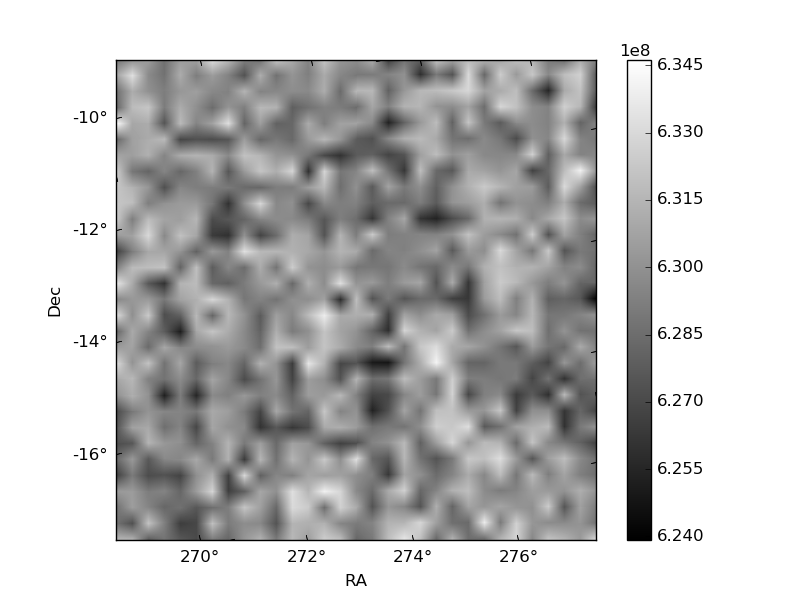
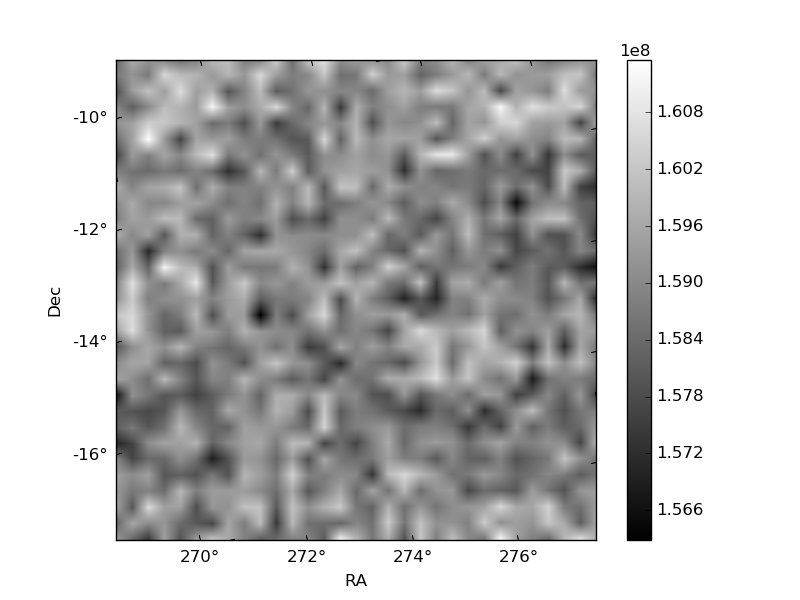
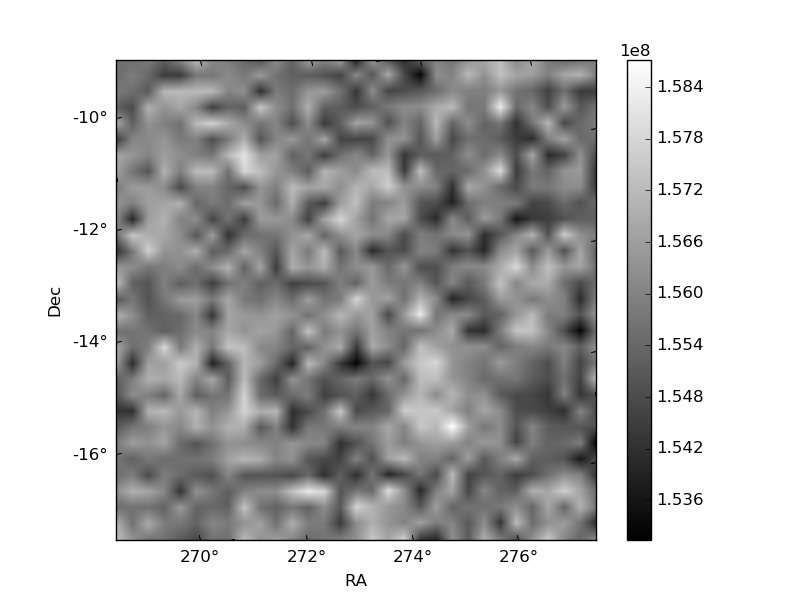
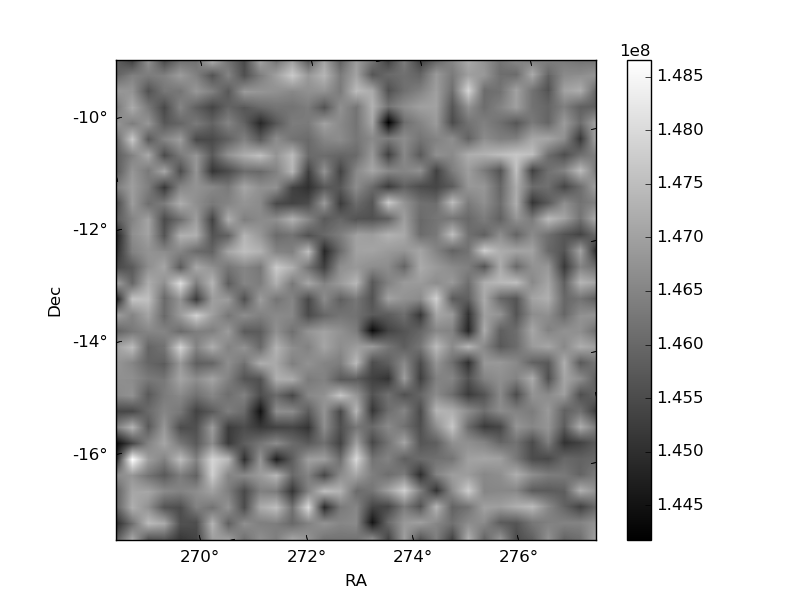
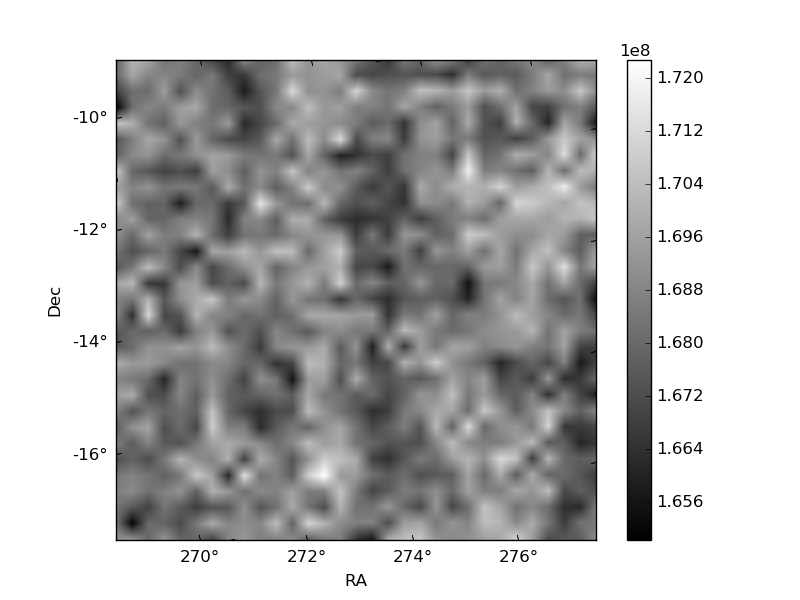
Histogram calculated using DETX and DETY for each event in the final _common_clean file
| Quadrant A | 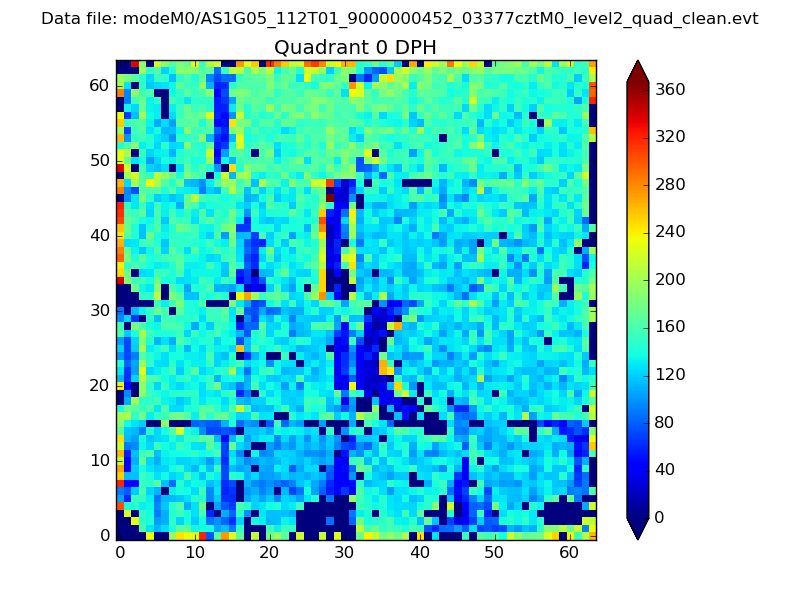 |
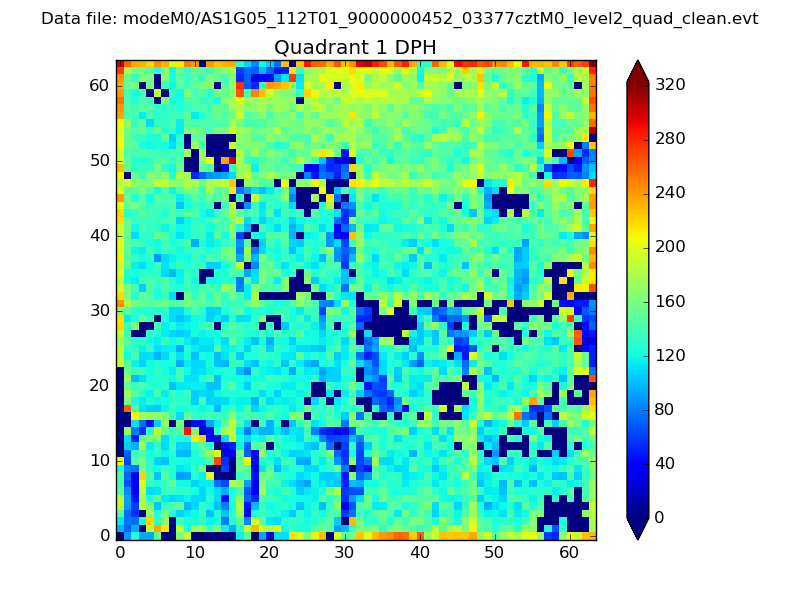 |
Quadrant B |
|---|---|---|---|
| Quadrant D | 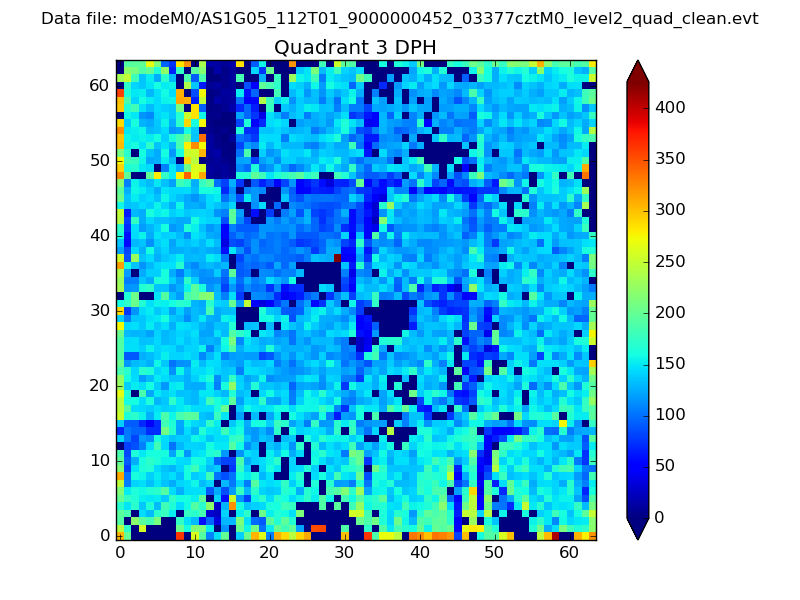 |
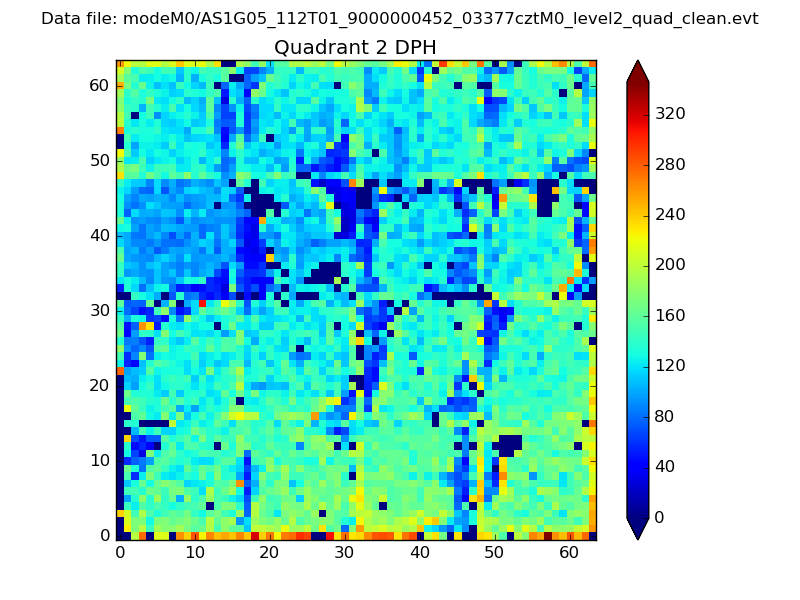 |
Quadrant C |
| Plot type | Count rate plots | Images |
|---|---|---|
| Comparison with Poisson distribution Blue bars denote a histogram of data divided into 1 sec bins. Red curve is a Poisson curve with rate = median count rate of data. |
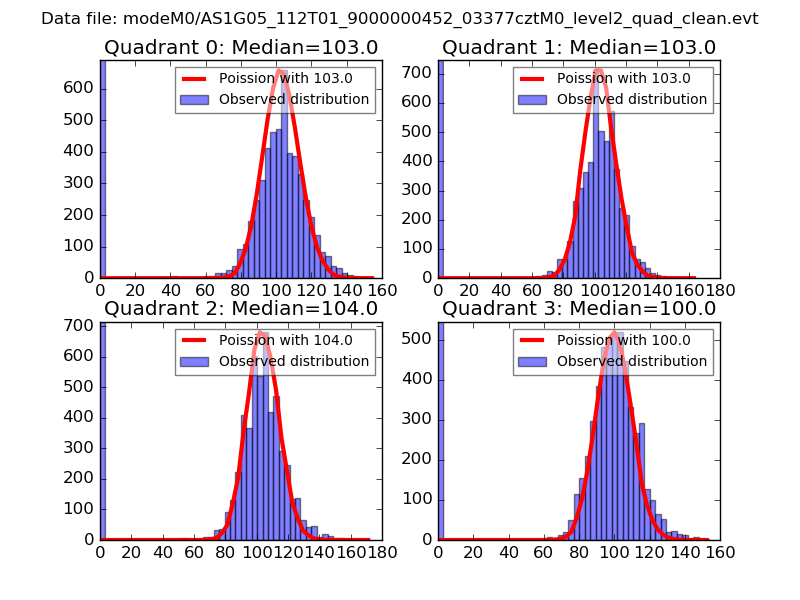 |
 |
| Quadrant-wise count rates Data is divided into 100 sec bins |
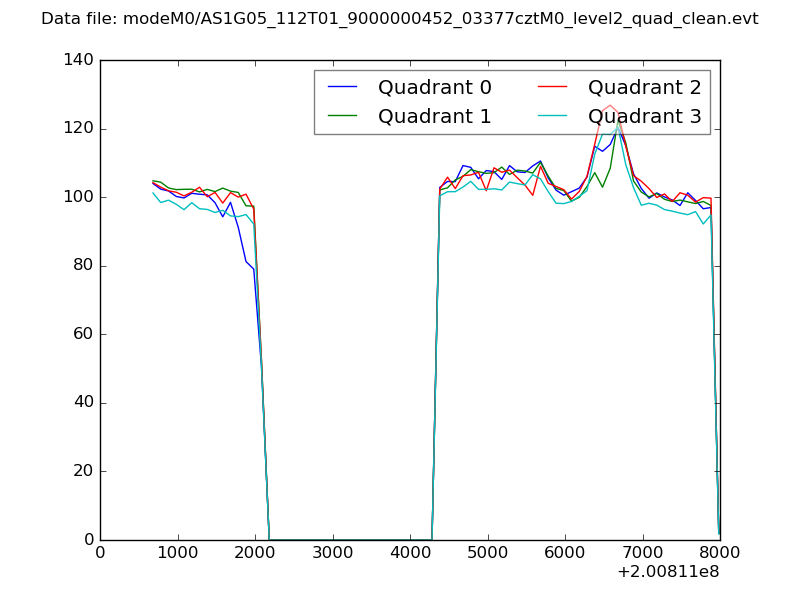 |
|
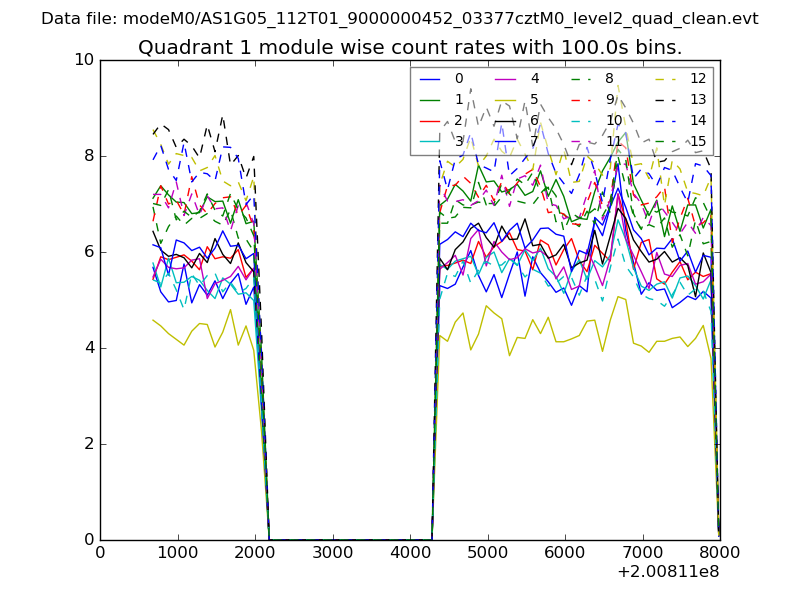
| Module-wise count rates for Quadrant A Data is divided into 100 sec bins |
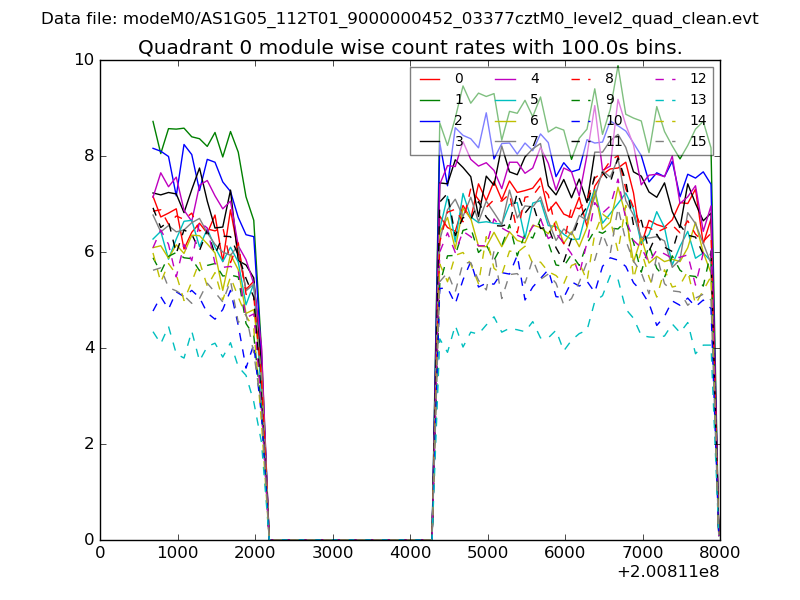 |
 |
| Module-wise count rates for Quadrant B Data is divided into 100 sec bins |
 |
 |
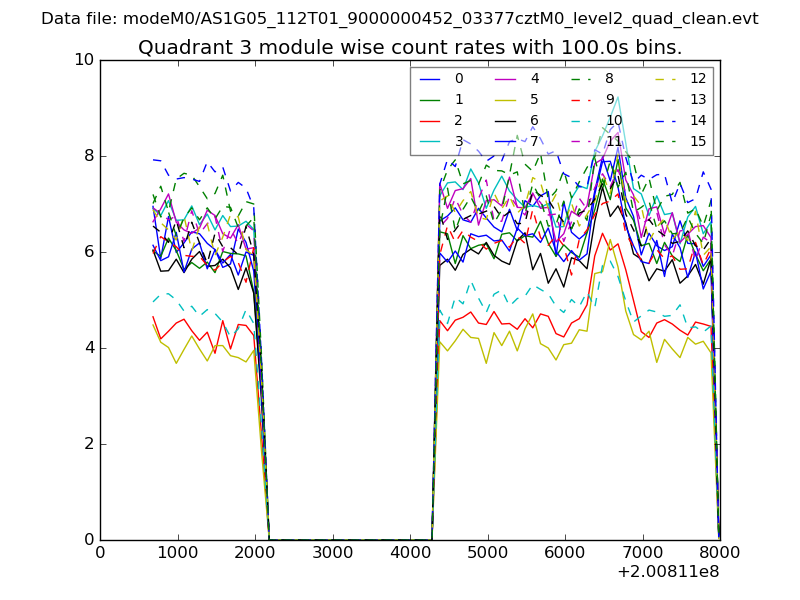
| Module-wise count rates for Quadrant C Data is divided into 100 sec bins |
 |
 |
| Module-wise count rates for Quadrant D Data is divided into 100 sec bins |
 |
 |
| Parameter | Plot |
|---|---|
| CZT HV Monitor |  |
| D_VDD | 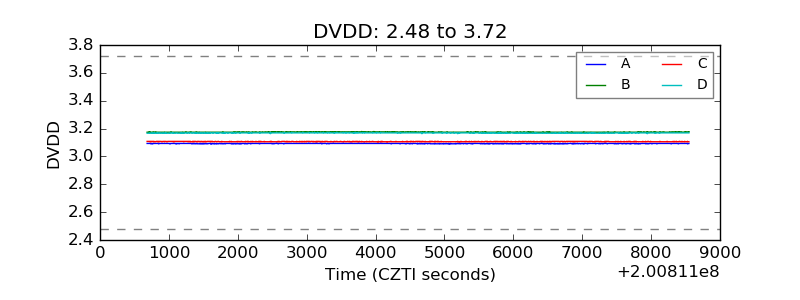 |
| Temperature 1 | 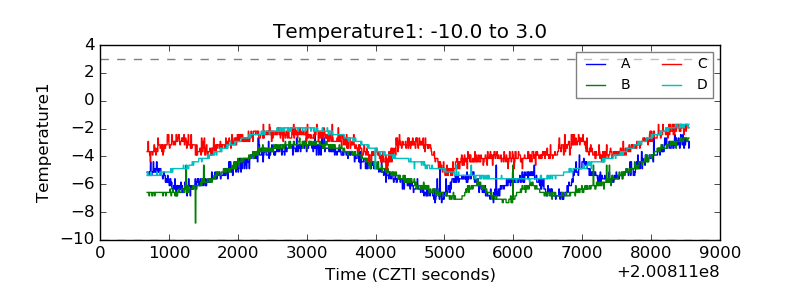 |
| Veto HV Monitor | 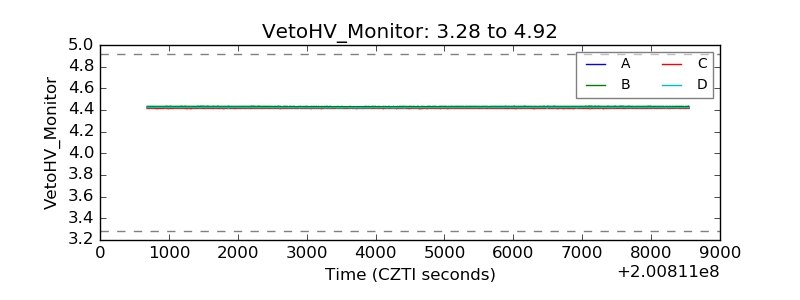 |
| Veto LLD | 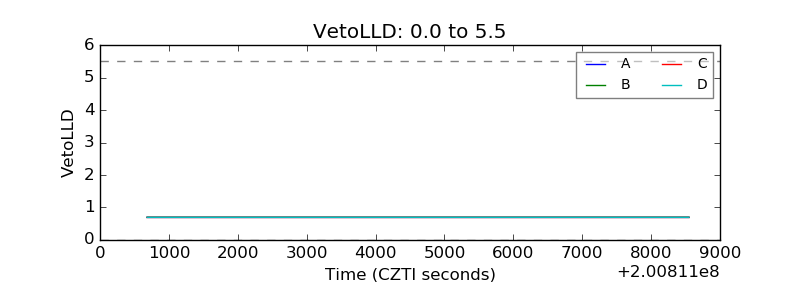 |
| Alpha Counter | 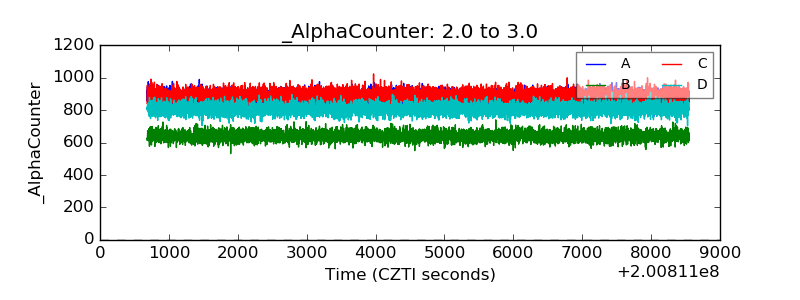 |
| _CPM_Rate | 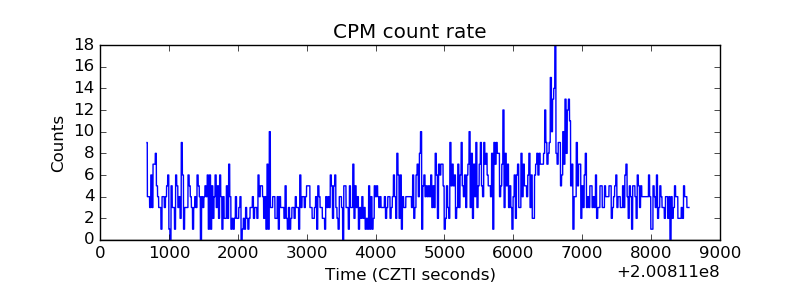 |
| CZT Counter | 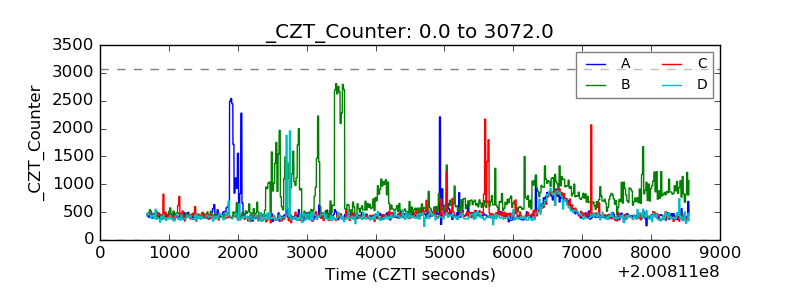 |
| +2.5 Volts monitor |  |
| +5 Volts monitor |  |
| _ROLL_ROT | 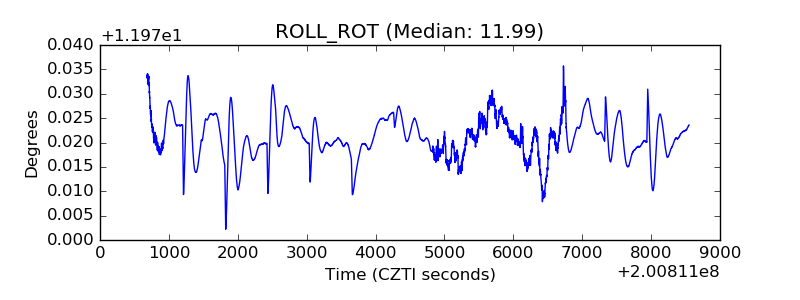 |
| _Roll_DEC | 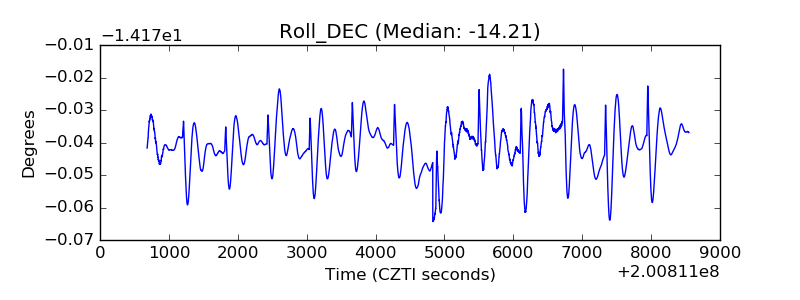 |
| _Roll_RA | 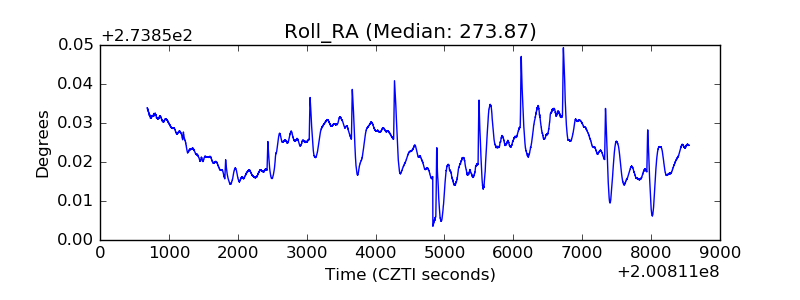 |
| Veto Counter | 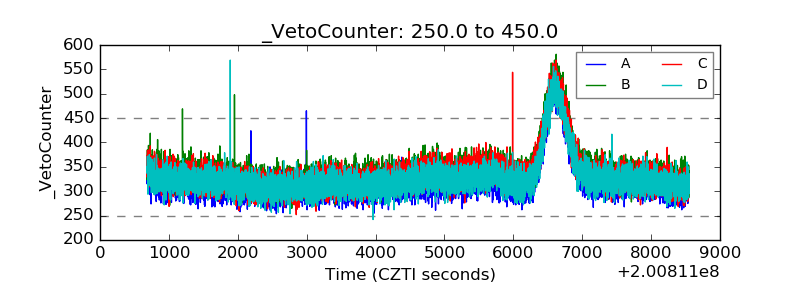 |