| Param | Original file | Final file |
|---|---|---|
| Filename | modeM0/AS1G05_112T01_9000000452_03381cztM0_level2.evt | modeM0/AS1G05_112T01_9000000452_03381cztM0_level2_quad_clean.evt |
| Size (bytes) | 1,704,136,320 | 235,710,720 |
| Size | 1.6 GB | 224.8 MB |
| Events in quadrant A | 11,173,183 | 1,399,465 |
| Events in quadrant B | 15,592,019 | 1,382,274 |
| Events in quadrant C | 12,126,609 | 1,373,168 |
| Events in quadrant D | 11,106,065 | 1,340,936 |
| Mode M9 | |||
|---|---|---|---|
| Quadrant | BADHDUFLAG | Total packets | Discarded packets |
| A | 0 | 22 | 0 |
| B | 0 | 22 | 0 |
| C | 0 | 22 | 0 |
| D | 0 | 22 | 0 |
| Mode SS | |||
|---|---|---|---|
| Quadrant | BADHDUFLAG | Total packets | Discarded packets |
| A | 0 | 482 | 0 |
| B | 0 | 482 | 0 |
| C | 0 | 482 | 0 |
| D | 0 | 482 | 0 |
| Mode M0 | |||
|---|---|---|---|
| Quadrant | BADHDUFLAG | Total packets | Discarded packets |
| A | 0 | 49800 | 6 |
| B | 0 | 62534 | 5 |
| C | 0 | 53077 | 7 |
| D | 0 | 50699 | 5 |
| Quadrant | Total seconds | Saturated seconds | Saturation percentage |
|---|---|---|---|
| A | 23869 | 493 | 2.065441% |
| B | 23869 | 733 | 3.070929% |
| C | 23868 | 489 | 2.048768% |
| D | 23869 | 502 | 2.103146% |
Noise dominated data is calculated using 1-second bins in cleaned event files. If a bin has >2000 counts, and if more than 50% of those come from <1% of pixels, then it is considered to be noise-dominated and hence unusable.
| Quadrant | # 1 sec bins | Bins with >0 counts | Bins with >2000 counts | High rate bins dominated by noise | Noise dominated (total time) | Noise dominated (detector-on time) | Marked lightcurve |
|---|---|---|---|---|---|---|---|
| A | 26094 | 23875 | 40 | 40 | 0.15% | 0.17% | 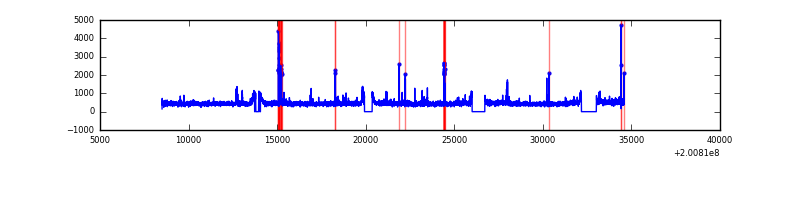 |
| B | 26094 | 23875 | 129 | 129 | 0.49% | 0.54% | 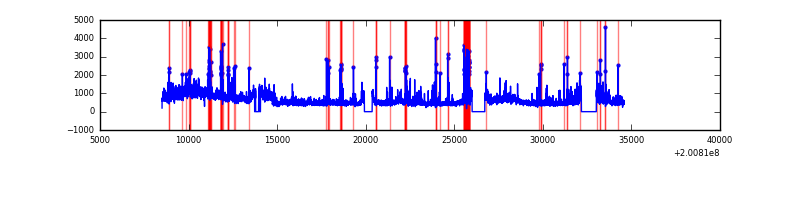 |
| C | 26094 | 23875 | 150 | 150 | 0.57% | 0.63% | 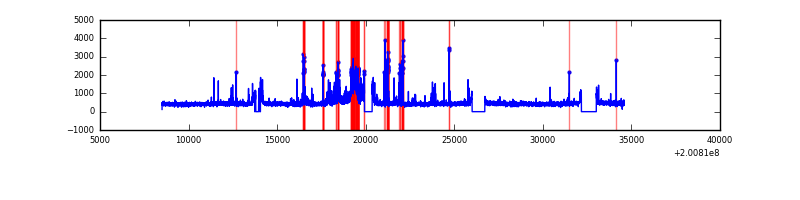 |
| D | 26094 | 23875 | 143 | 143 | 0.55% | 0.60% | 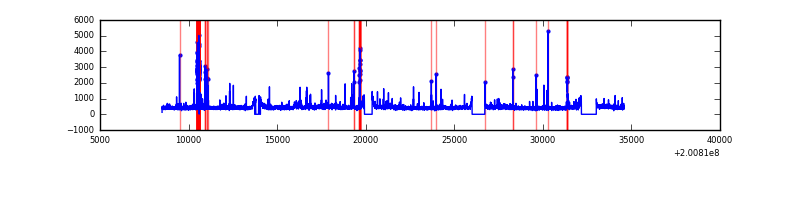 |
Top three noisy pixels from each quadrant. If the there are fewer than three noisy pixels in the level2.evt file, extra rows are filled as -1
| Pixel properties | Quadrant properties | ||||||
|---|---|---|---|---|---|---|---|
| Quadrant | DetID | PixID | Counts | Sigma | Mean | Median | Sigma |
| A | 0 | 118 | 215168 | 375.01 | 2761 | 2694 | 566.6 |
| A | 8 | 15 | 105491 | 181.43 | 2761 | 2694 | 566.6 |
| A | 14 | 249 | 100820 | 173.19 | 2761 | 2694 | 566.6 |
| B | 4 | 170 | 2195019 | 4069.07 | 2786 | 2715 | 538.8 |
| B | 15 | 204 | 929114 | 1719.46 | 2786 | 2715 | 538.8 |
| B | 2 | 249 | 580997 | 1073.33 | 2786 | 2715 | 538.8 |
| C | 1 | 192 | 1383354 | 2191.47 | 2686 | 2701 | 630.0 |
| C | 6 | 80 | 56310 | 85.09 | 2686 | 2701 | 630.0 |
| C | 15 | 208 | 35840 | 52.6 | 2686 | 2701 | 630.0 |
| D | 12 | 79 | 532996 | 806.02 | 2679 | 2596 | 658.0 |
| D | 13 | 223 | 141443 | 211.0 | 2679 | 2596 | 658.0 |
| D | 2 | 118 | 65360 | 95.38 | 2679 | 2596 | 658.0 |
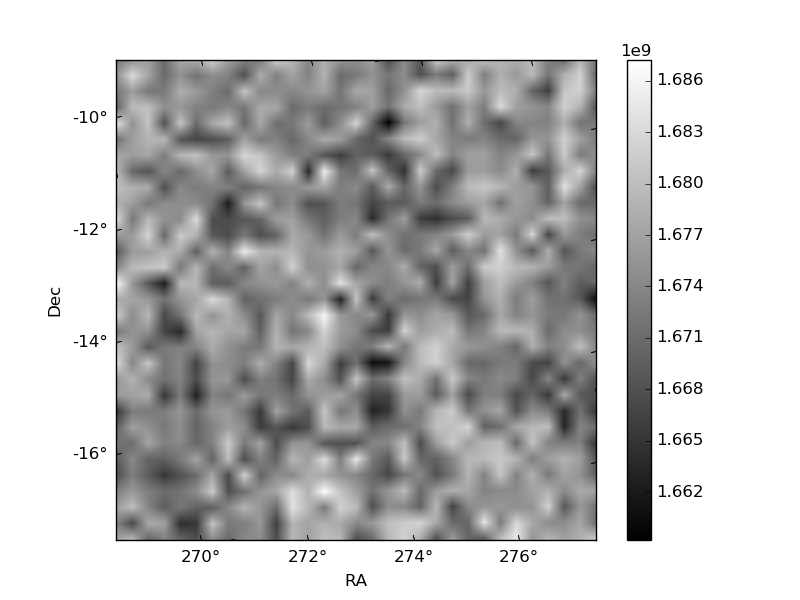
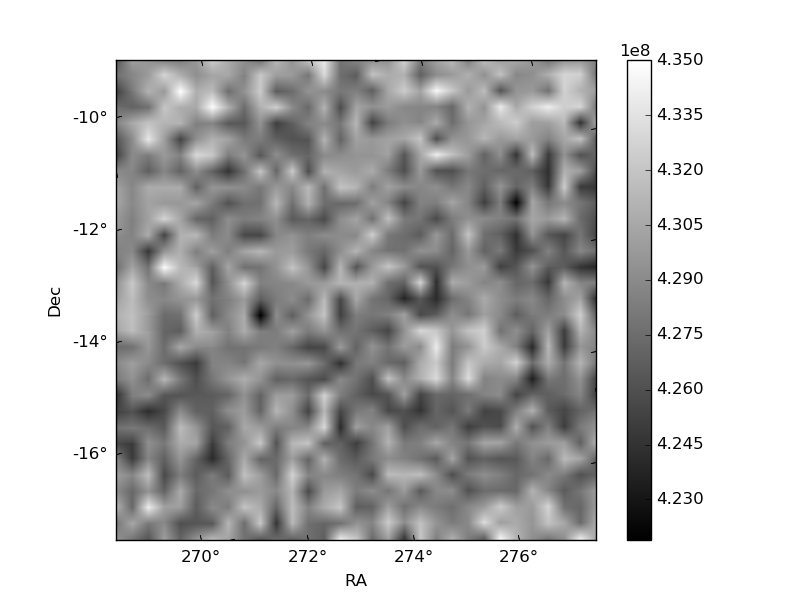
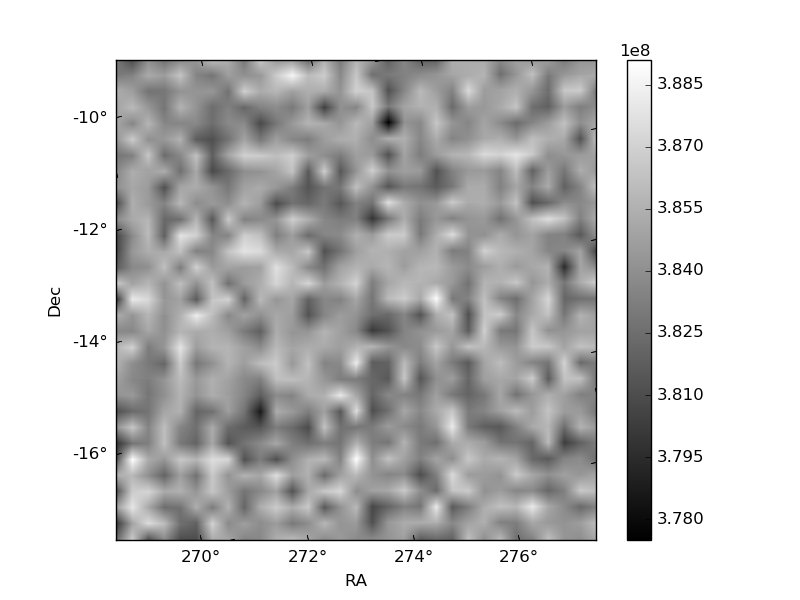
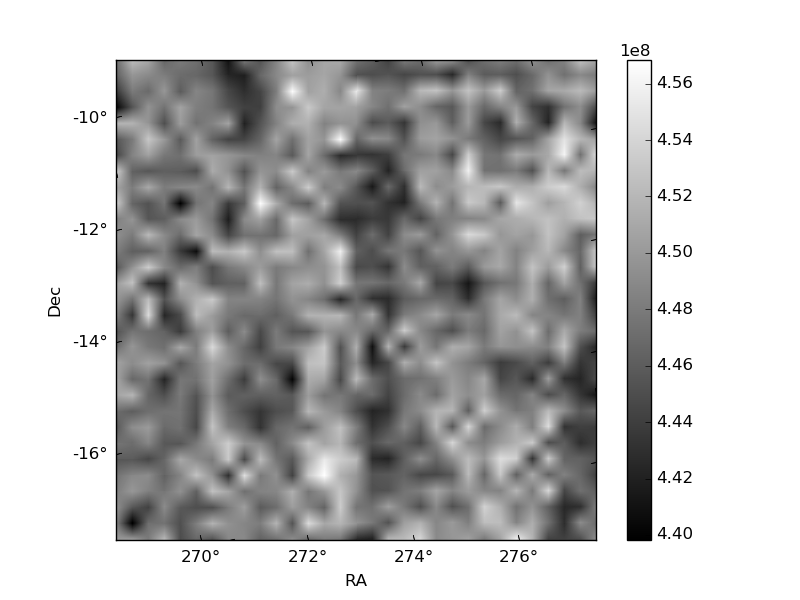
Histogram calculated using DETX and DETY for each event in the final _common_clean file
| Quadrant A | 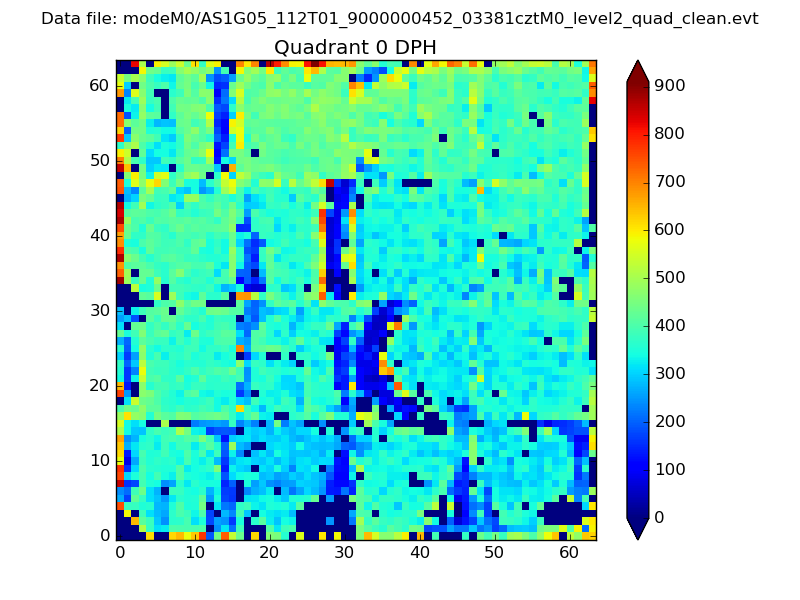 |
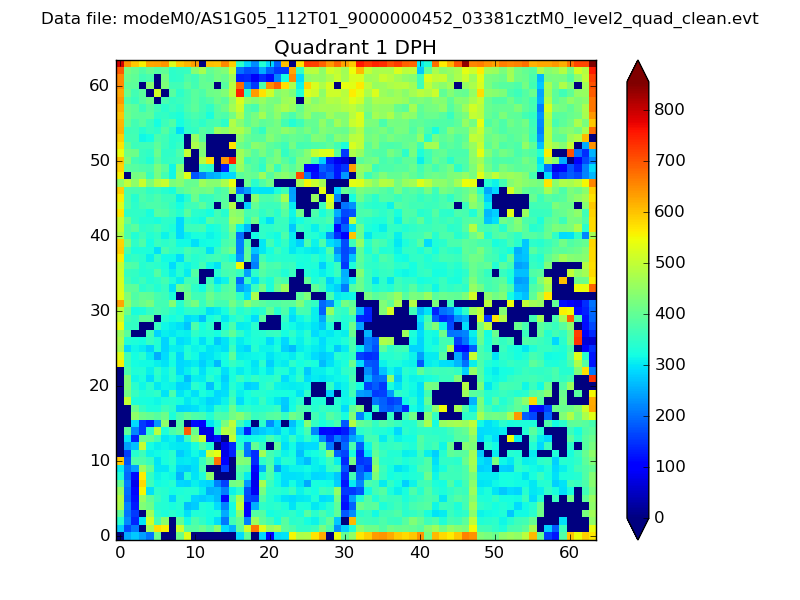 |
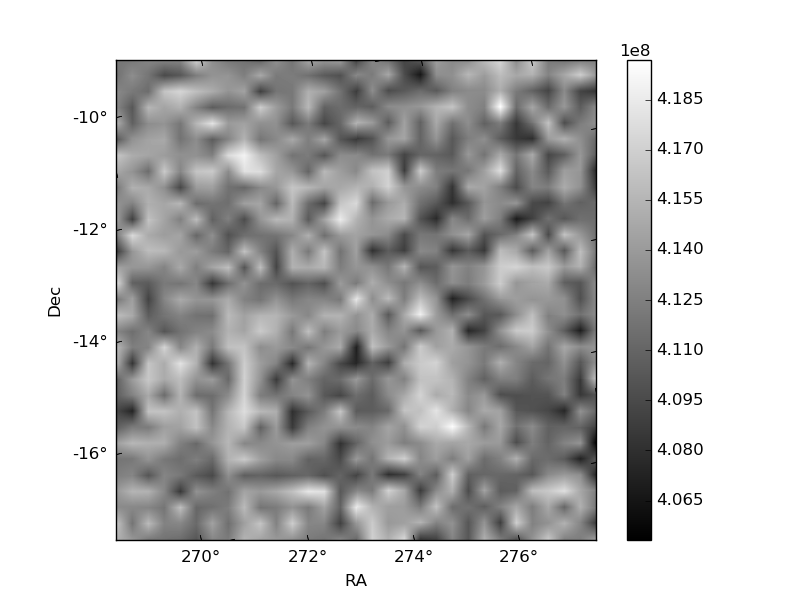
Quadrant B |
|---|---|---|---|
| Quadrant D | 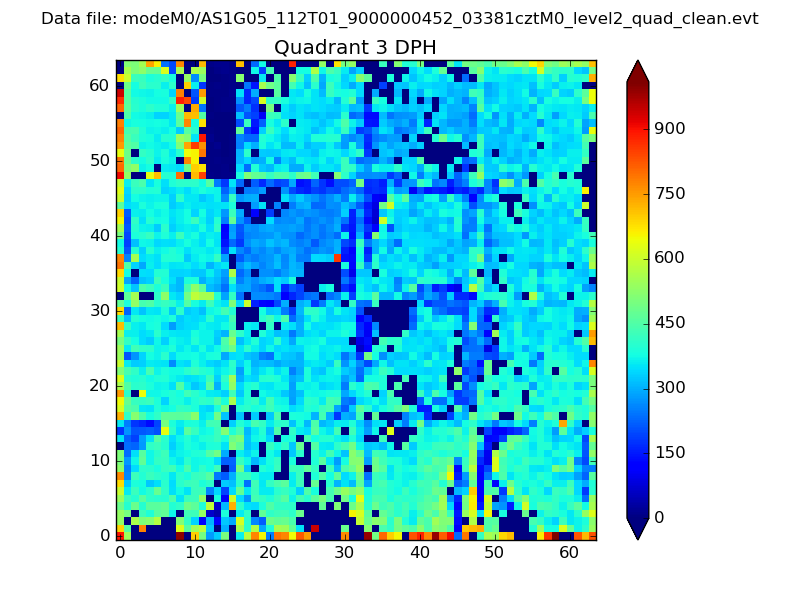 |
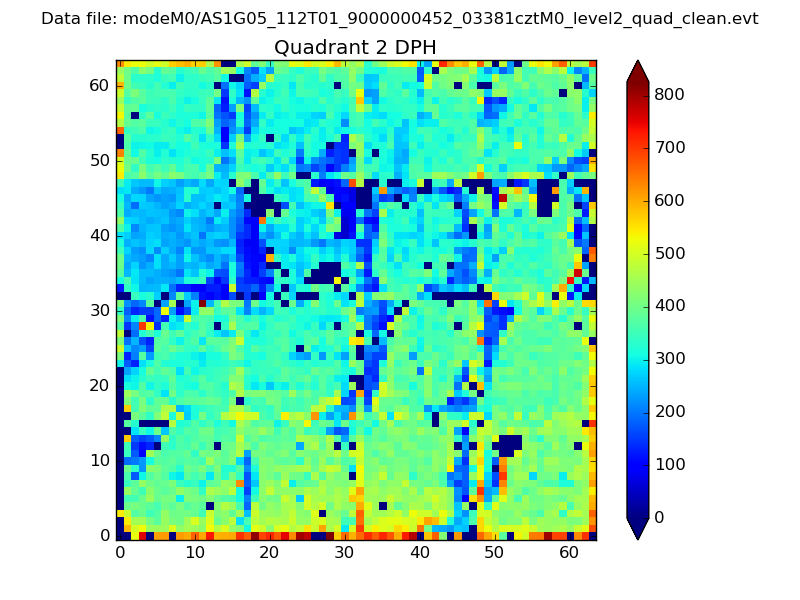 |
Quadrant C |
| Plot type | Count rate plots | Images |
|---|---|---|
| Comparison with Poisson distribution Blue bars denote a histogram of data divided into 1 sec bins. Red curve is a Poisson curve with rate = median count rate of data. |
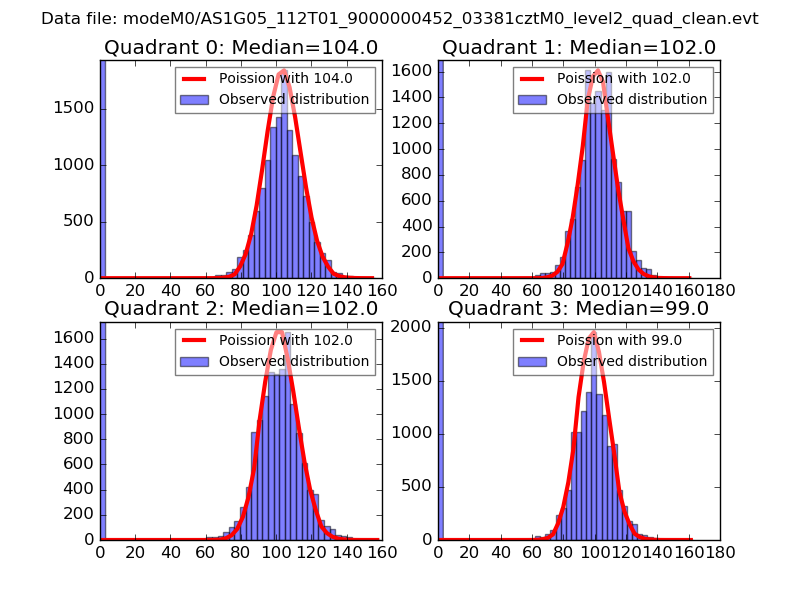 |
 |
| Quadrant-wise count rates Data is divided into 100 sec bins |
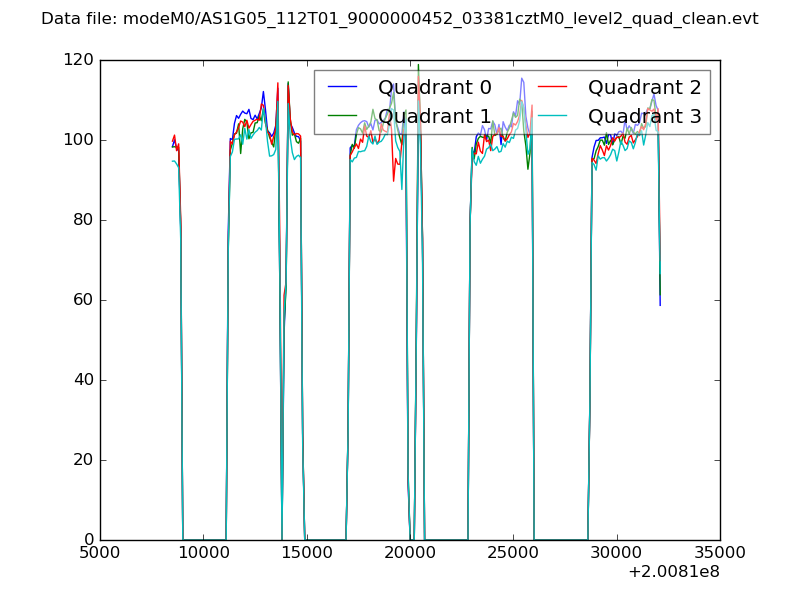 |
|
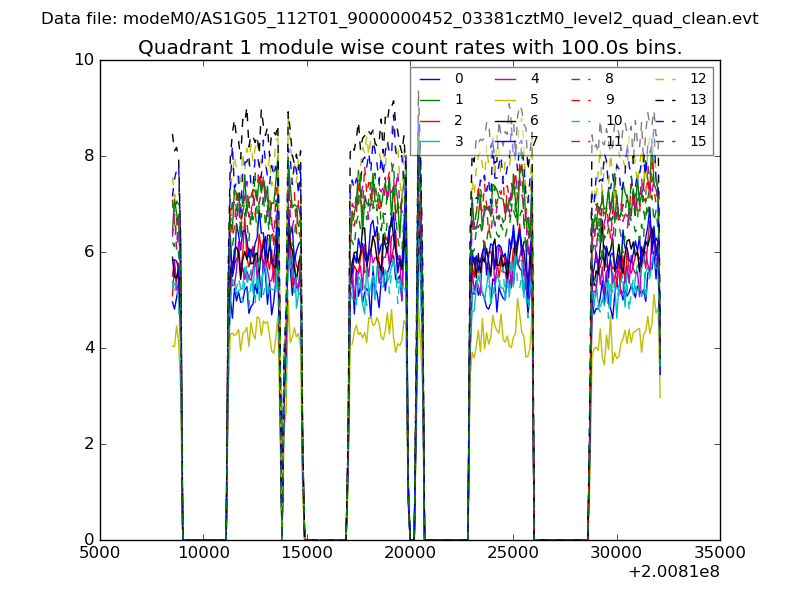
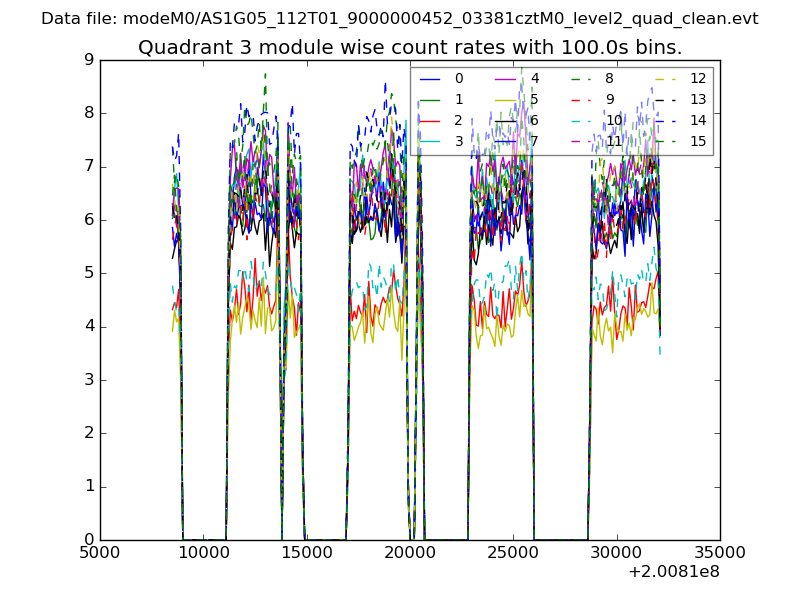
| Module-wise count rates for Quadrant A Data is divided into 100 sec bins |
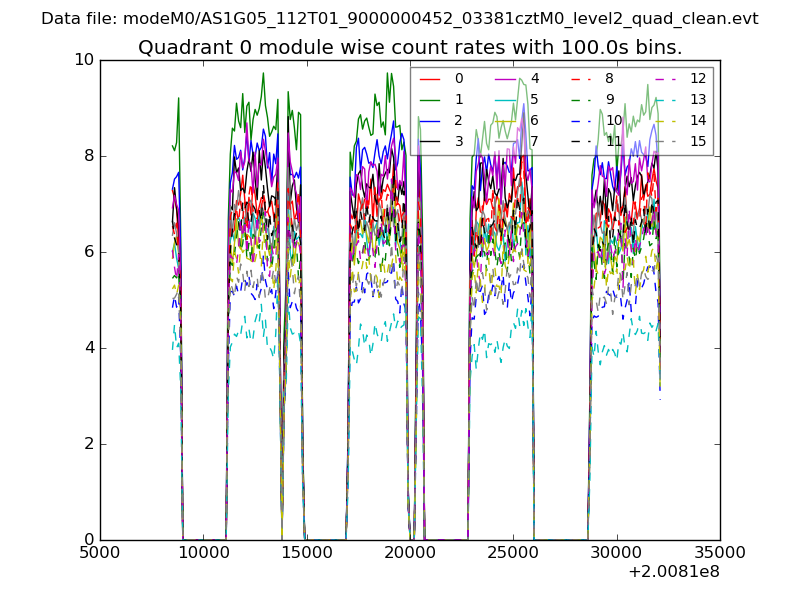 |
 |
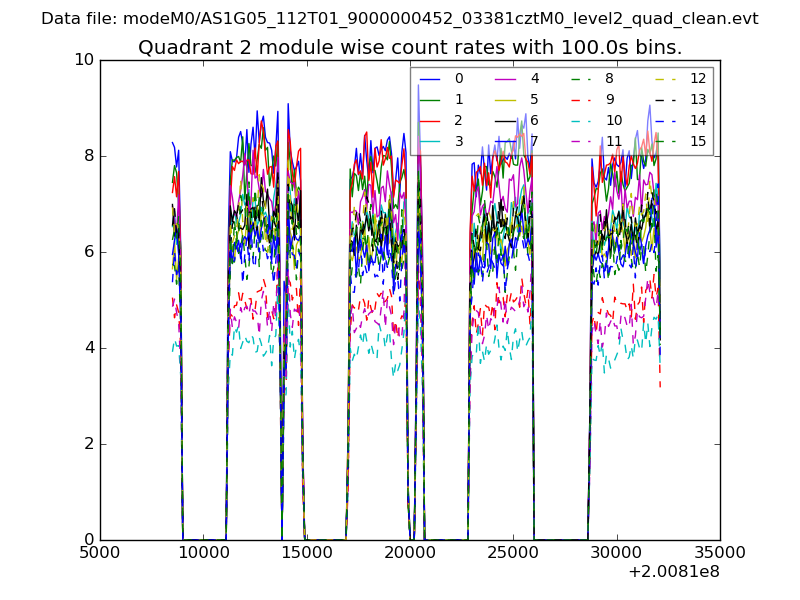
| Module-wise count rates for Quadrant B Data is divided into 100 sec bins |
 |
 |
| Module-wise count rates for Quadrant C Data is divided into 100 sec bins |
 |
 |
| Module-wise count rates for Quadrant D Data is divided into 100 sec bins |
 |
 |
| Parameter | Plot |
|---|---|
| CZT HV Monitor | 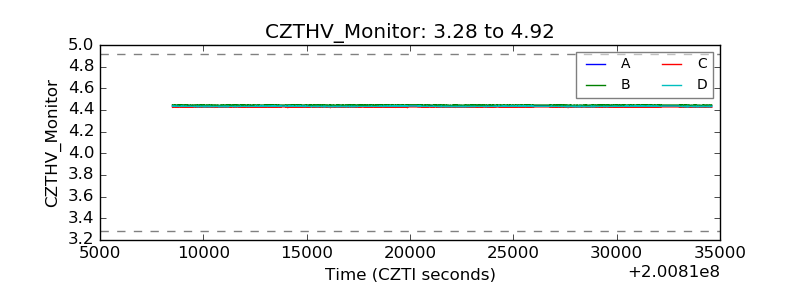 |
| D_VDD | 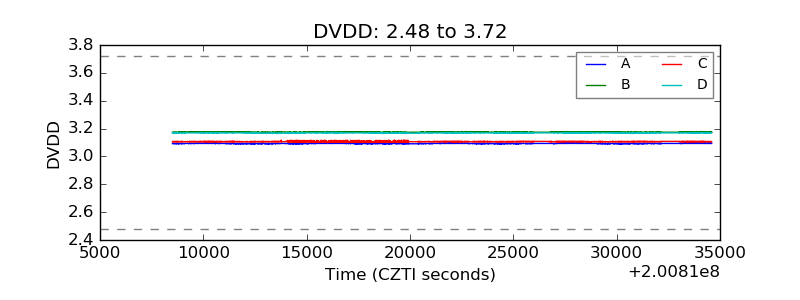 |
| Temperature 1 | 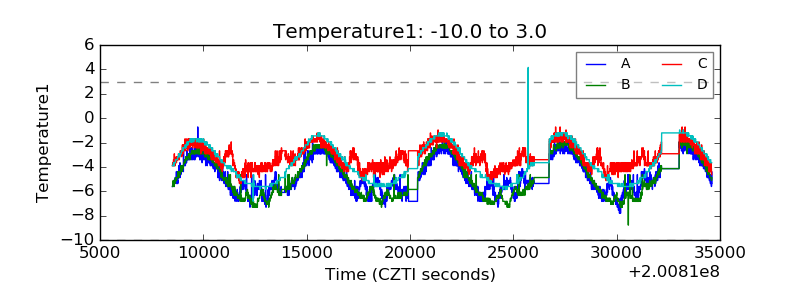 |
| Veto HV Monitor | 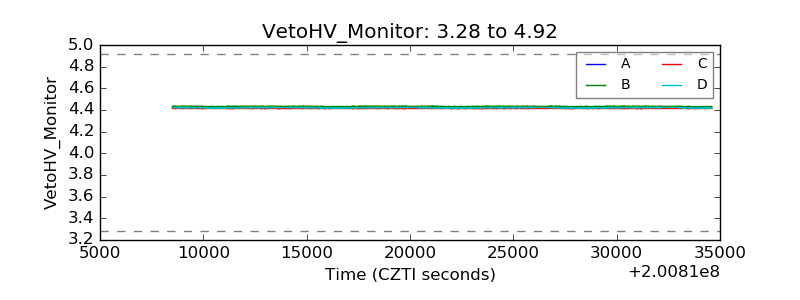 |
| Veto LLD | 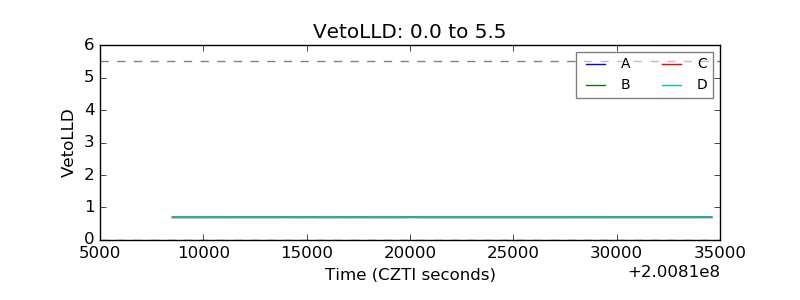 |
| Alpha Counter | 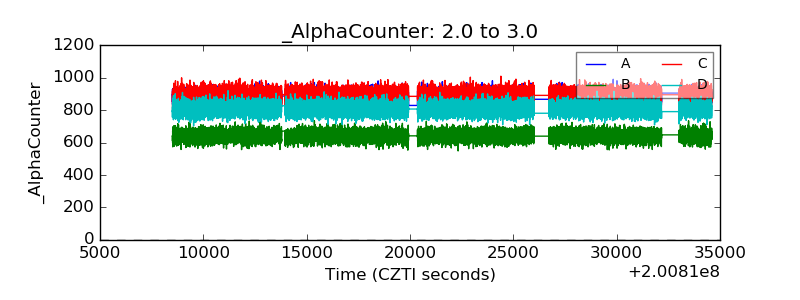 |
| _CPM_Rate | 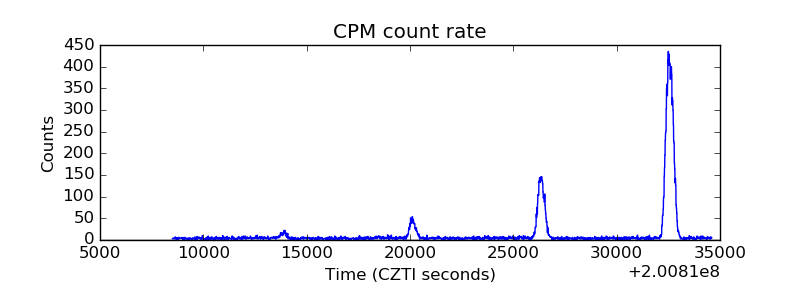 |
| CZT Counter | 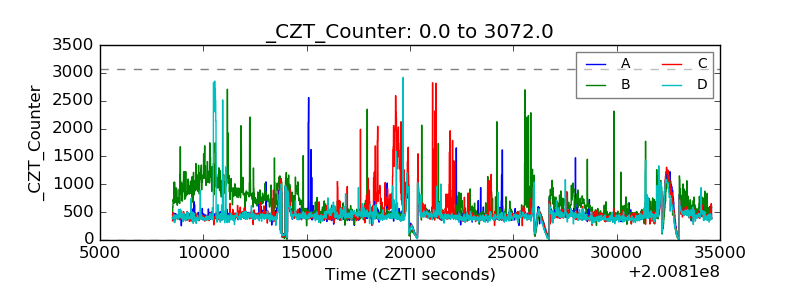 |
| +2.5 Volts monitor | 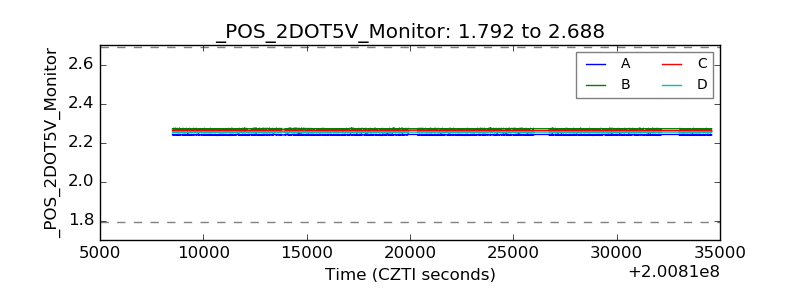 |
| +5 Volts monitor | 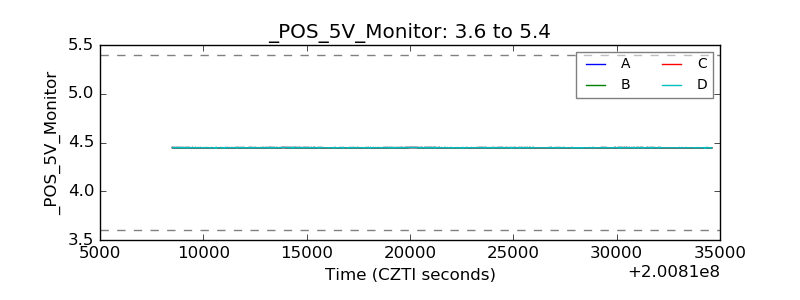 |
| _ROLL_ROT |  |
| _Roll_DEC | 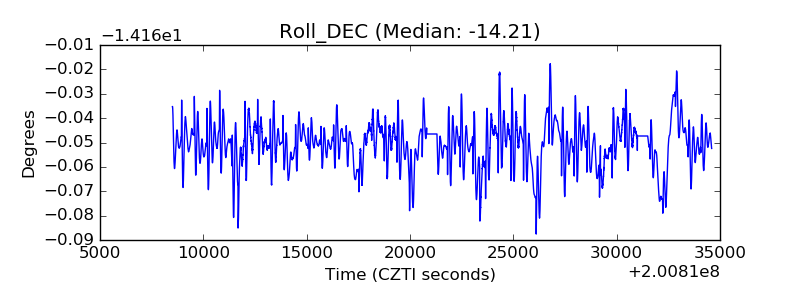 |
| _Roll_RA | 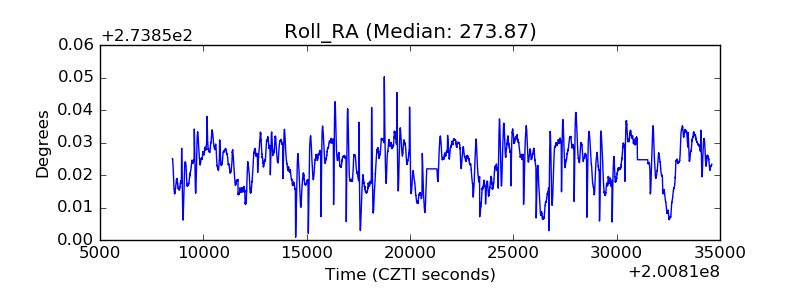 |
| Veto Counter | 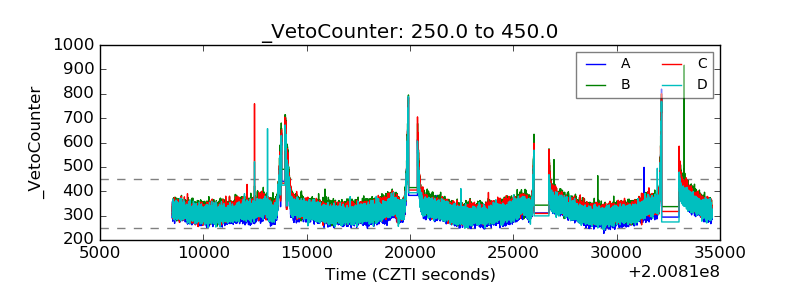 |