| Param | Original file | Final file |
|---|---|---|
| Filename | modeM0/AS1G05_112T01_9000000452_03382cztM0_level2.evt | modeM0/AS1G05_112T01_9000000452_03382cztM0_level2_quad_clean.evt |
| Size (bytes) | 499,288,320 | 78,261,120 |
| Size | 476.2 MB | 74.6 MB |
| Events in quadrant A | 3,652,720 | 475,601 |
| Events in quadrant B | 4,199,768 | 465,696 |
| Events in quadrant C | 3,403,302 | 466,197 |
| Events in quadrant D | 3,367,151 | 451,834 |
| Mode M9 | |||
|---|---|---|---|
| Quadrant | BADHDUFLAG | Total packets | Discarded packets |
| A | 0 | 20 | 0 |
| B | 0 | 20 | 0 |
| C | 0 | 20 | 0 |
| D | 0 | 20 | 0 |
| Mode SS | |||
|---|---|---|---|
| Quadrant | BADHDUFLAG | Total packets | Discarded packets |
| A | 0 | 148 | 0 |
| B | 0 | 148 | 0 |
| C | 0 | 148 | 0 |
| D | 0 | 148 | 0 |
| Mode M0 | |||
|---|---|---|---|
| Quadrant | BADHDUFLAG | Total packets | Discarded packets |
| A | 0 | 15677 | 3 |
| B | 0 | 17440 | 2 |
| C | 0 | 15159 | 2 |
| D | 0 | 15370 | 2 |
| Quadrant | Total seconds | Saturated seconds | Saturation percentage |
|---|---|---|---|
| A | 7339 | 121 | 1.648726% |
| B | 7339 | 226 | 3.079439% |
| C | 7339 | 84 | 1.144570% |
| D | 7339 | 96 | 1.308080% |
Noise dominated data is calculated using 1-second bins in cleaned event files. If a bin has >2000 counts, and if more than 50% of those come from <1% of pixels, then it is considered to be noise-dominated and hence unusable.
| Quadrant | # 1 sec bins | Bins with >0 counts | Bins with >2000 counts | High rate bins dominated by noise | Noise dominated (total time) | Noise dominated (detector-on time) | Marked lightcurve |
|---|---|---|---|---|---|---|---|
| A | 9209 | 7341 | 7 | 7 | 0.08% | 0.10% | 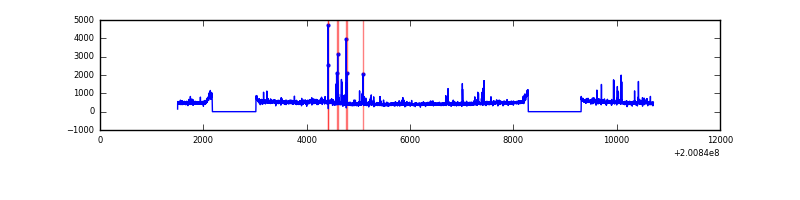 |
| B | 9209 | 7341 | 54 | 54 | 0.59% | 0.74% | 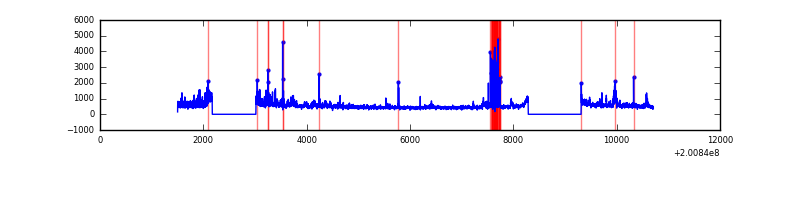 |
| C | 9209 | 7341 | 1 | 1 | 0.01% | 0.01% | 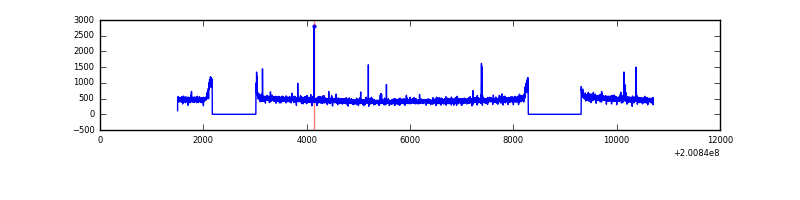 |
| D | 9209 | 7341 | 7 | 7 | 0.08% | 0.10% | 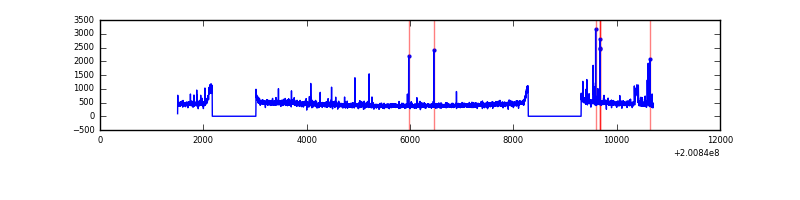 |
Top three noisy pixels from each quadrant. If the there are fewer than three noisy pixels in the level2.evt file, extra rows are filled as -1
| Pixel properties | Quadrant properties | ||||||
|---|---|---|---|---|---|---|---|
| Quadrant | DetID | PixID | Counts | Sigma | Mean | Median | Sigma |
| A | 0 | 118 | 108156 | 589.04 | 881 | 861 | 182.2 |
| A | 8 | 15 | 93216 | 507.02 | 881 | 861 | 182.2 |
| A | 14 | 249 | 41230 | 221.62 | 881 | 861 | 182.2 |
| B | 2 | 249 | 258371 | 1489.19 | 886 | 865 | 172.9 |
| B | 15 | 204 | 216931 | 1249.54 | 886 | 865 | 172.9 |
| B | 3 | 0 | 104178 | 597.47 | 886 | 865 | 172.9 |
| C | 1 | 192 | 18327 | 87.04 | 855 | 860 | 200.7 |
| C | 12 | 4 | 13252 | 61.75 | 855 | 860 | 200.7 |
| C | 1 | 16 | 12525 | 58.13 | 855 | 860 | 200.7 |
| D | 13 | 223 | 66413 | 314.02 | 853 | 825 | 208.9 |
| D | 14 | 34 | 27976 | 129.99 | 853 | 825 | 208.9 |
| D | 5 | 233 | 25771 | 119.43 | 853 | 825 | 208.9 |
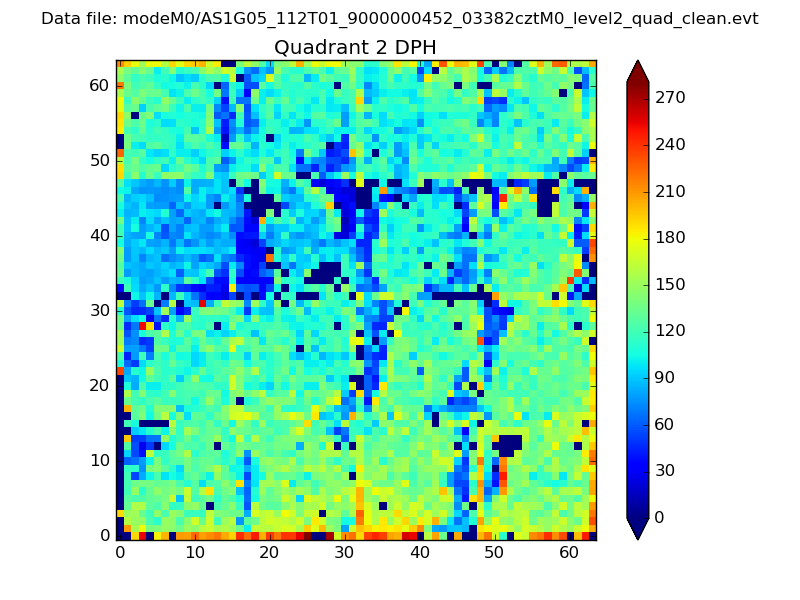
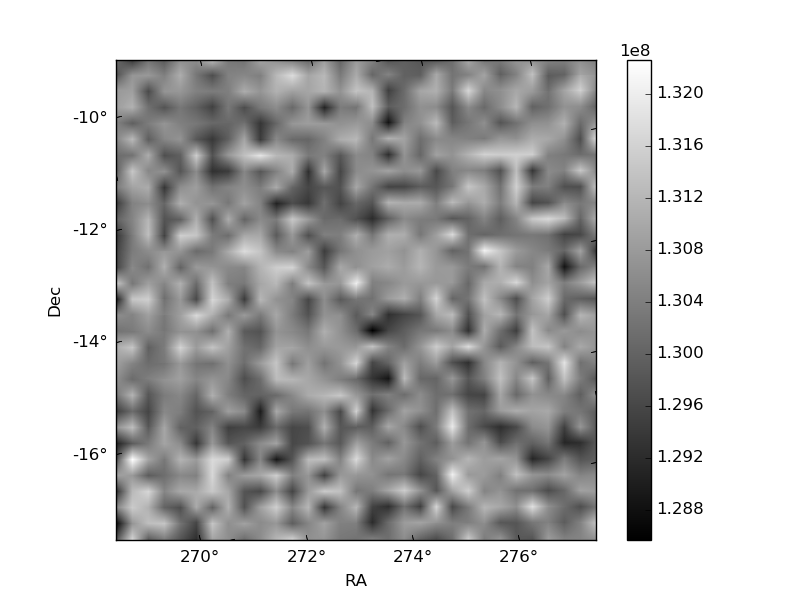
Histogram calculated using DETX and DETY for each event in the final _common_clean file
| Quadrant A |  |
 |
Quadrant B |
|---|---|---|---|
| Quadrant D | 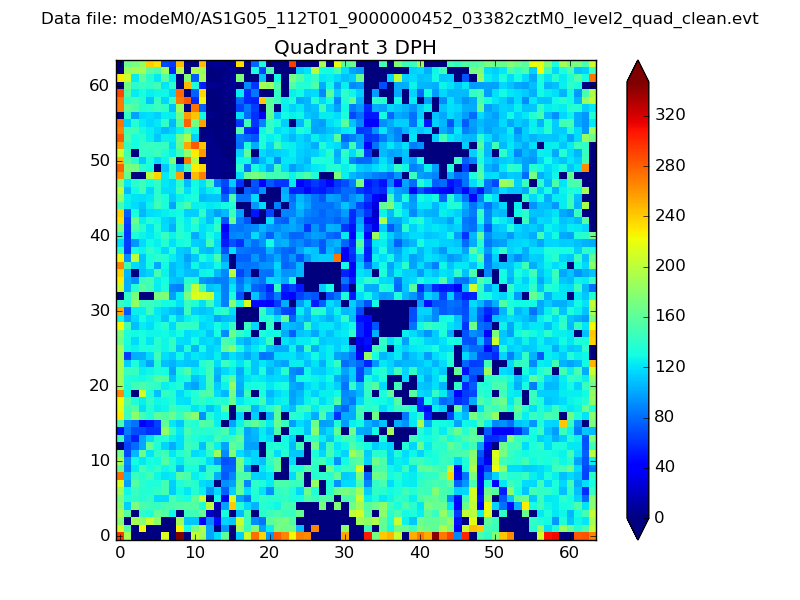 |
 |
Quadrant C |
| Plot type | Count rate plots | Images |
|---|---|---|
| Comparison with Poisson distribution Blue bars denote a histogram of data divided into 1 sec bins. Red curve is a Poisson curve with rate = median count rate of data. |
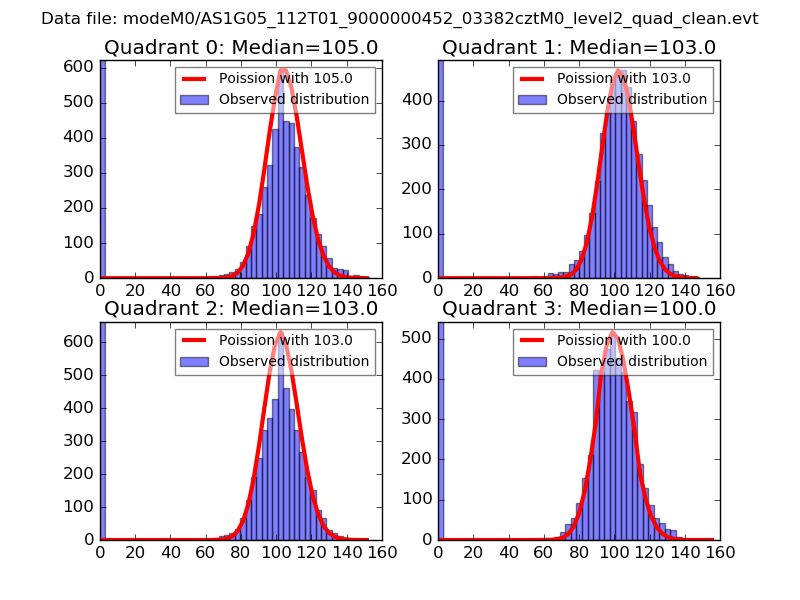 |
 |
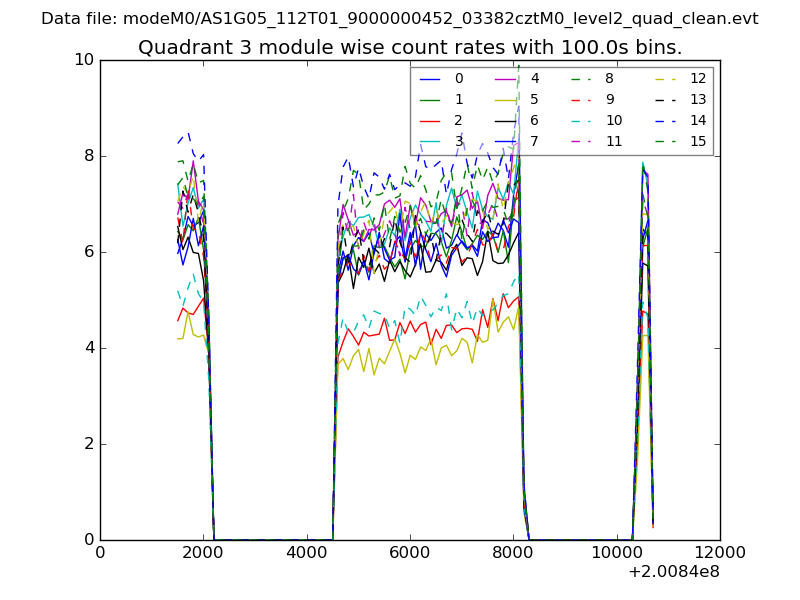
| Quadrant-wise count rates Data is divided into 100 sec bins |
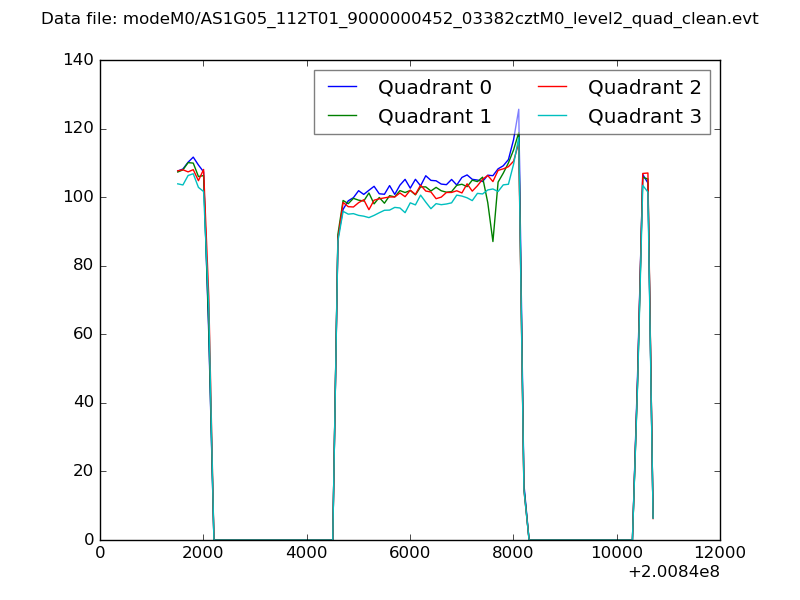 |
|
| Module-wise count rates for Quadrant A Data is divided into 100 sec bins |
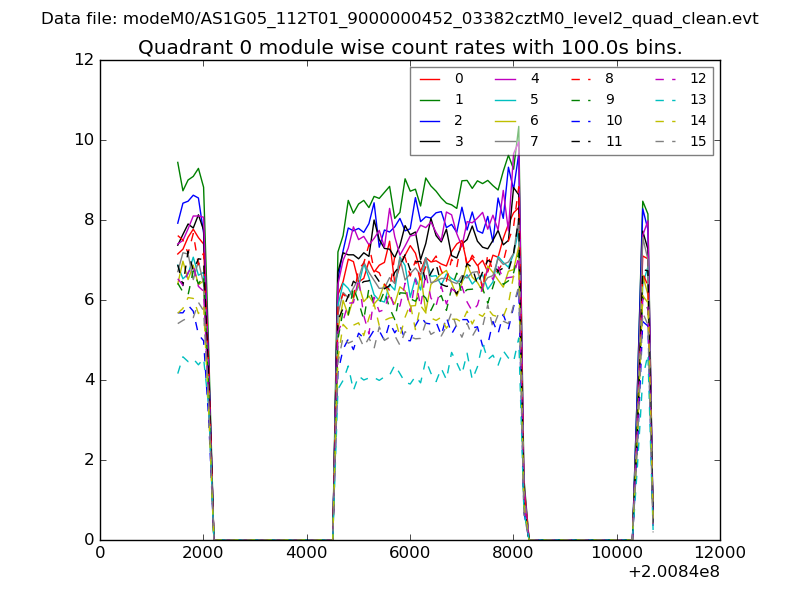 |
 |
| Module-wise count rates for Quadrant B Data is divided into 100 sec bins |
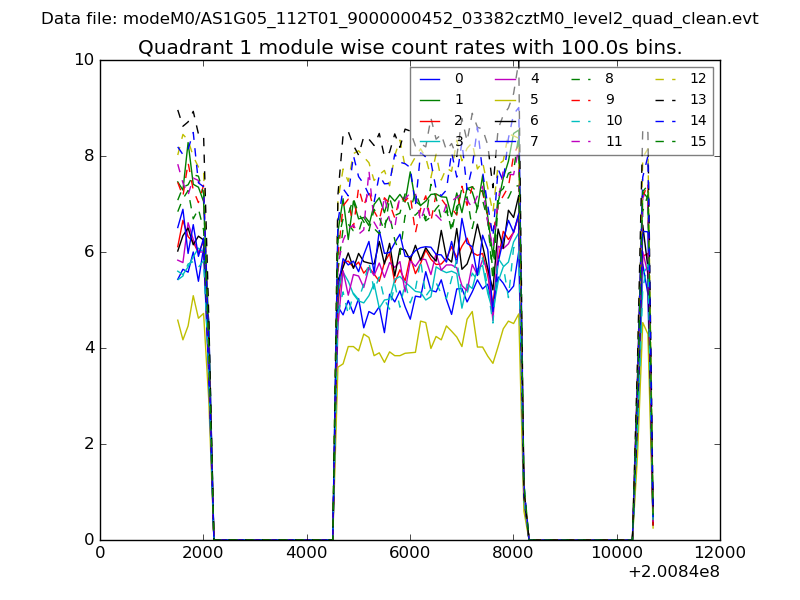 |
 |
| Module-wise count rates for Quadrant C Data is divided into 100 sec bins |
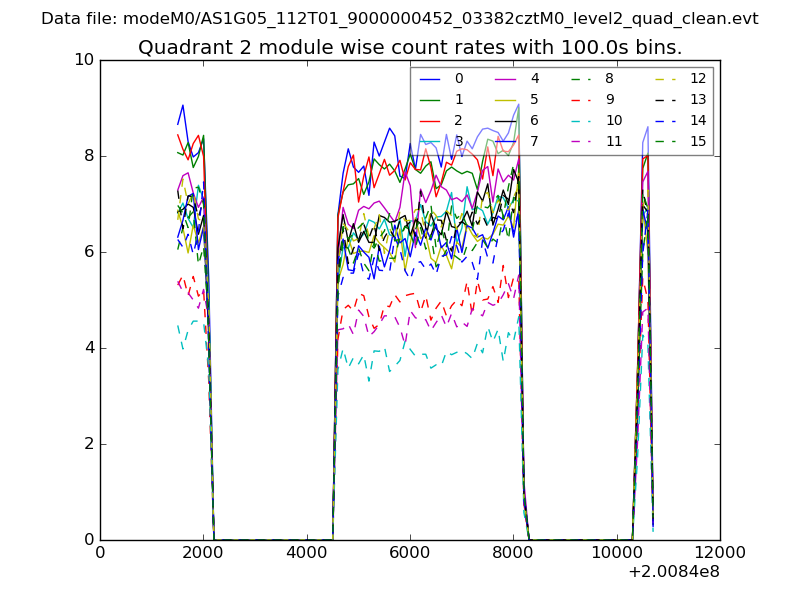 |
 |
| Module-wise count rates for Quadrant D Data is divided into 100 sec bins |
 |
 |
| Parameter | Plot |
|---|---|
| CZT HV Monitor | 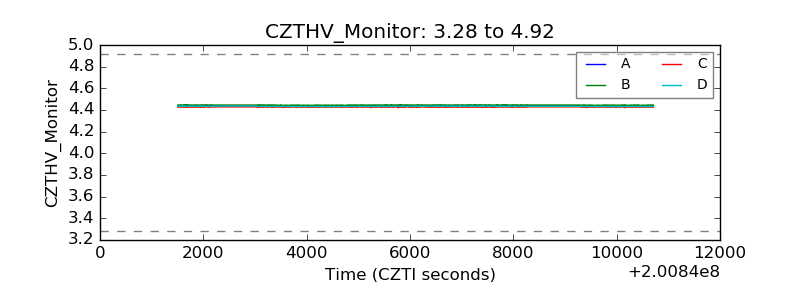 |
| D_VDD | 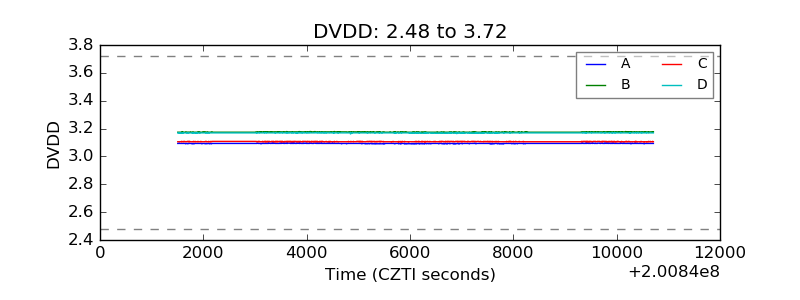 |
| Temperature 1 | 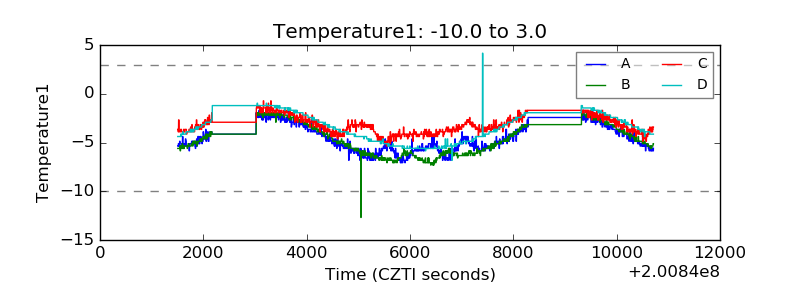 |
| Veto HV Monitor | 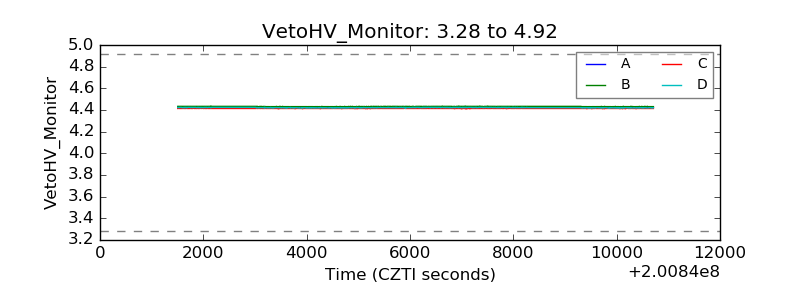 |
| Veto LLD | 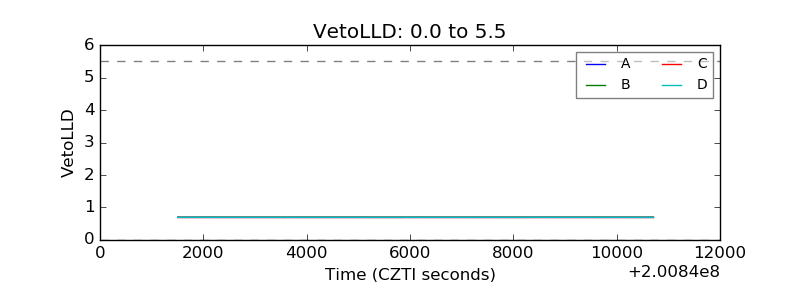 |
| Alpha Counter | 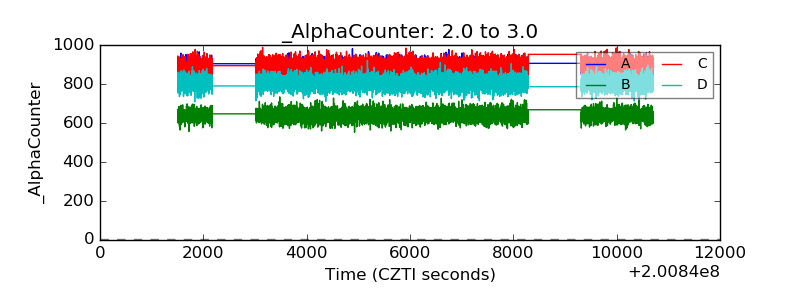 |
| _CPM_Rate | 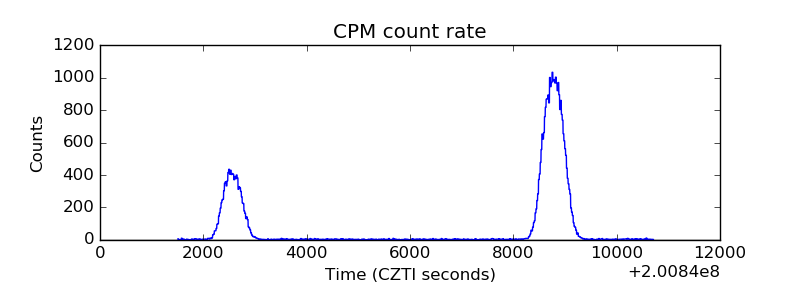 |
| CZT Counter | 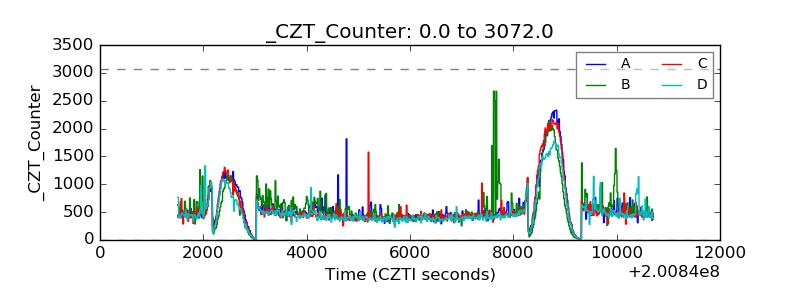 |
| +2.5 Volts monitor |  |
| +5 Volts monitor |  |
| _ROLL_ROT | 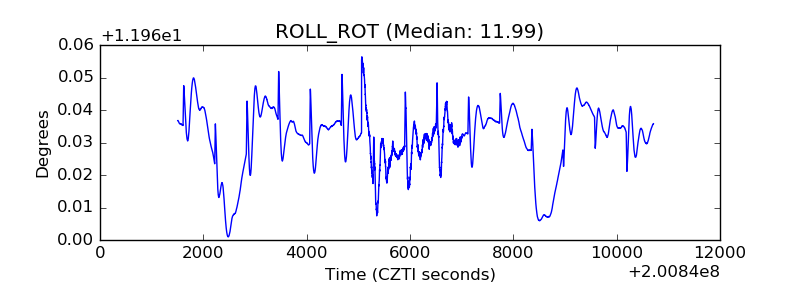 |
| _Roll_DEC | 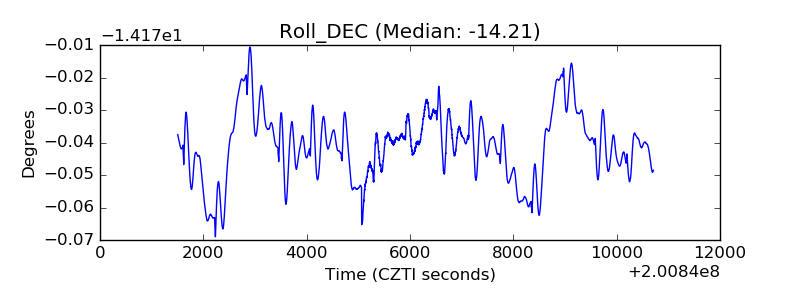 |
| _Roll_RA | 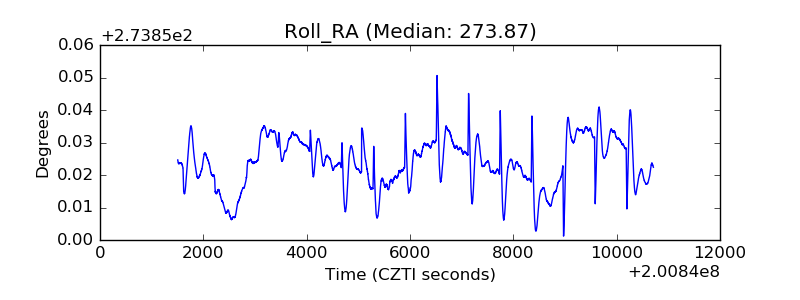 |
| Veto Counter | 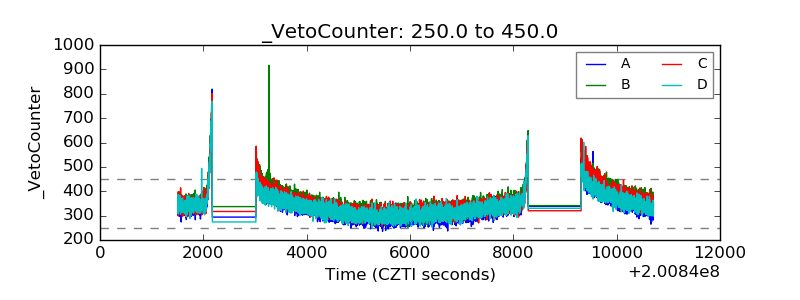 |