| Param | Original file | Final file |
|---|---|---|
| Filename | modeM0/AS1G05_112T01_9000000452_03384cztM0_level2.evt | modeM0/AS1G05_112T01_9000000452_03384cztM0_level2_quad_clean.evt |
| Size (bytes) | 434,620,800 | 72,889,920 |
| Size | 414.5 MB | 69.5 MB |
| Events in quadrant A | 3,190,974 | 446,745 |
| Events in quadrant B | 3,306,863 | 446,309 |
| Events in quadrant C | 3,194,091 | 440,887 |
| Events in quadrant D | 3,033,249 | 424,444 |
| Mode M9 | |||
|---|---|---|---|
| Quadrant | BADHDUFLAG | Total packets | Discarded packets |
| A | 0 | 12 | 0 |
| B | 0 | 12 | 0 |
| C | 0 | 12 | 0 |
| D | 0 | 13 | 0 |
| Mode SS | |||
|---|---|---|---|
| Quadrant | BADHDUFLAG | Total packets | Discarded packets |
| A | 0 | 132 | 0 |
| B | 0 | 132 | 0 |
| C | 0 | 132 | 0 |
| D | 0 | 132 | 0 |
| Mode M0 | |||
|---|---|---|---|
| Quadrant | BADHDUFLAG | Total packets | Discarded packets |
| A | 0 | 13757 | 3 |
| B | 0 | 14104 | 2 |
| C | 0 | 13728 | 2 |
| D | 0 | 13672 | 2 |
| Quadrant | Total seconds | Saturated seconds | Saturation percentage |
|---|---|---|---|
| A | 6427 | 58 | 0.902443% |
| B | 6427 | 59 | 0.918002% |
| C | 6427 | 24 | 0.373425% |
| D | 6427 | 41 | 0.637934% |
Noise dominated data is calculated using 1-second bins in cleaned event files. If a bin has >2000 counts, and if more than 50% of those come from <1% of pixels, then it is considered to be noise-dominated and hence unusable.
| Quadrant | # 1 sec bins | Bins with >0 counts | Bins with >2000 counts | High rate bins dominated by noise | Noise dominated (total time) | Noise dominated (detector-on time) | Marked lightcurve |
|---|---|---|---|---|---|---|---|
| A | 7592 | 6428 | 10 | 10 | 0.13% | 0.16% | 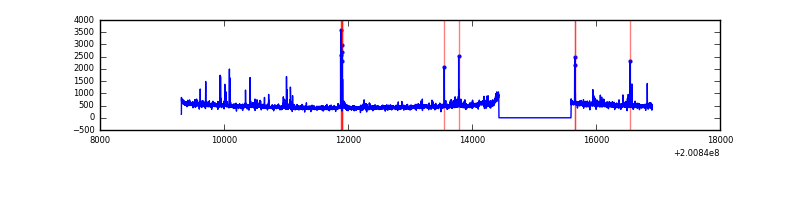 |
| B | 7592 | 6428 | 5 | 5 | 0.07% | 0.08% | 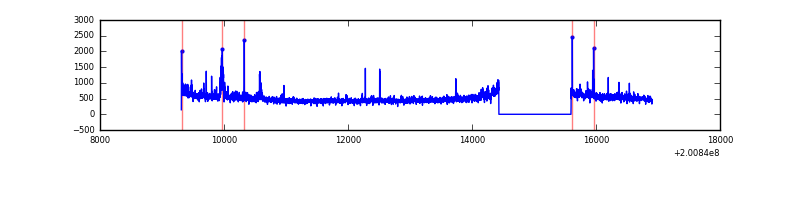 |
| C | 7592 | 6428 | 5 | 5 | 0.07% | 0.08% | 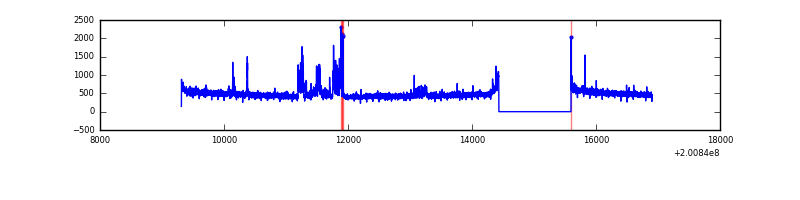 |
| D | 7592 | 6428 | 18 | 18 | 0.24% | 0.28% | 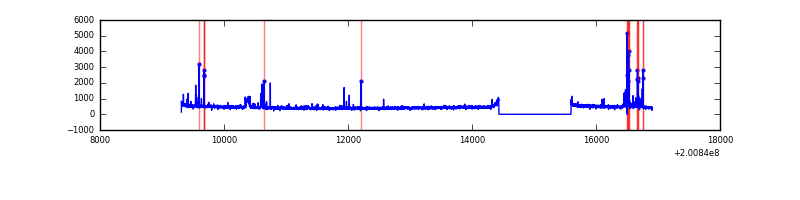 |
Top three noisy pixels from each quadrant. If the there are fewer than three noisy pixels in the level2.evt file, extra rows are filled as -1
| Pixel properties | Quadrant properties | ||||||
|---|---|---|---|---|---|---|---|
| Quadrant | DetID | PixID | Counts | Sigma | Mean | Median | Sigma |
| A | 8 | 15 | 117227 | 744.06 | 768 | 751 | 156.5 |
| A | 0 | 118 | 40891 | 256.42 | 768 | 751 | 156.5 |
| A | 14 | 249 | 34313 | 214.4 | 768 | 751 | 156.5 |
| B | 15 | 204 | 123933 | 818.88 | 781 | 762 | 150.4 |
| B | 14 | 167 | 69397 | 456.31 | 781 | 762 | 150.4 |
| B | 0 | 229 | 45363 | 296.52 | 781 | 762 | 150.4 |
| C | 14 | 48 | 199100 | 1130.92 | 750 | 757 | 175.4 |
| C | 12 | 4 | 18822 | 103.0 | 750 | 757 | 175.4 |
| C | 1 | 192 | 16844 | 91.73 | 750 | 757 | 175.4 |
| D | 13 | 223 | 165380 | 923.85 | 742 | 723 | 178.2 |
| D | 14 | 34 | 25650 | 139.86 | 742 | 723 | 178.2 |
| D | 13 | 137 | 9250 | 47.84 | 742 | 723 | 178.2 |
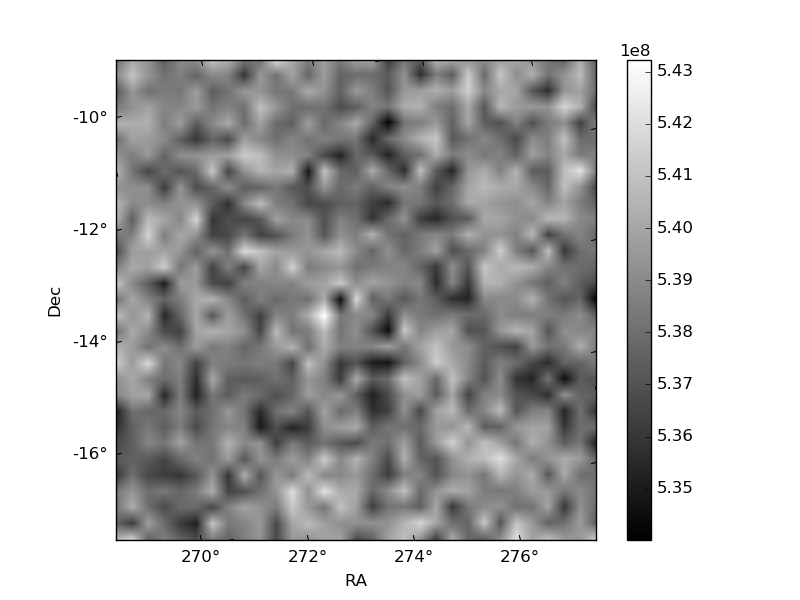
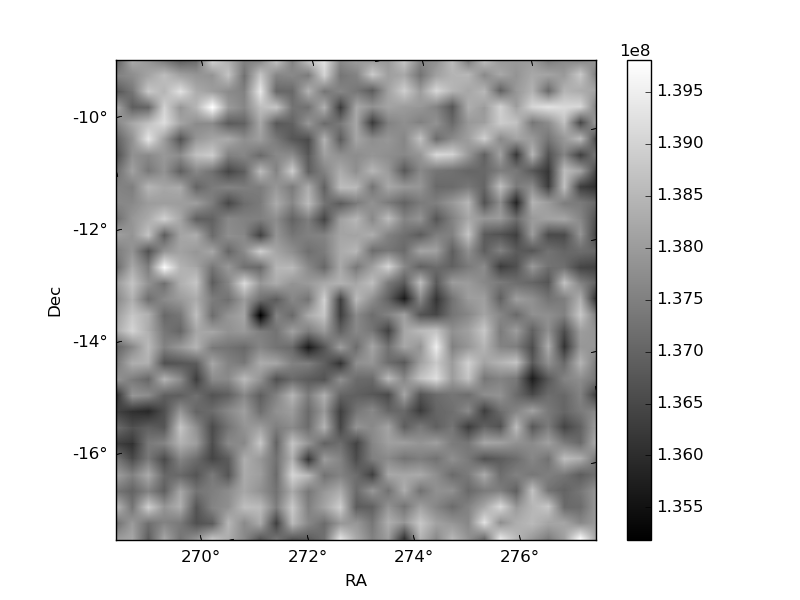
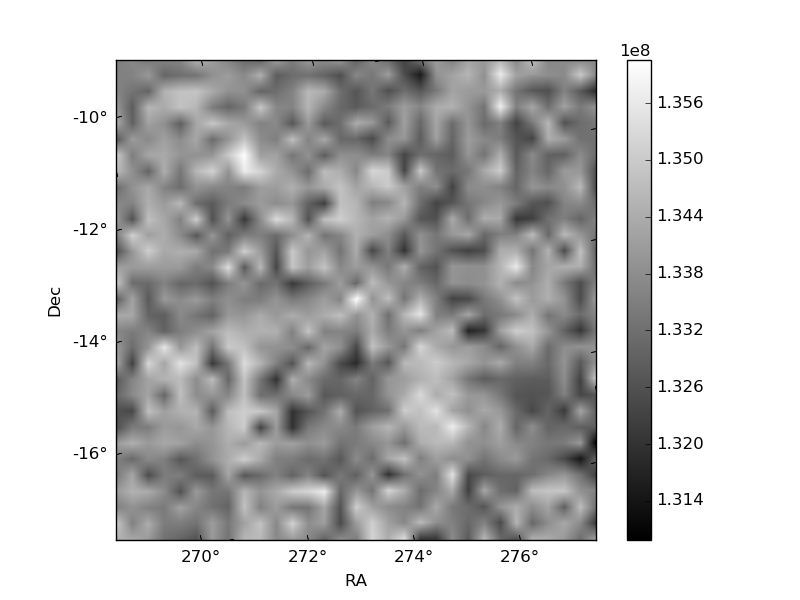
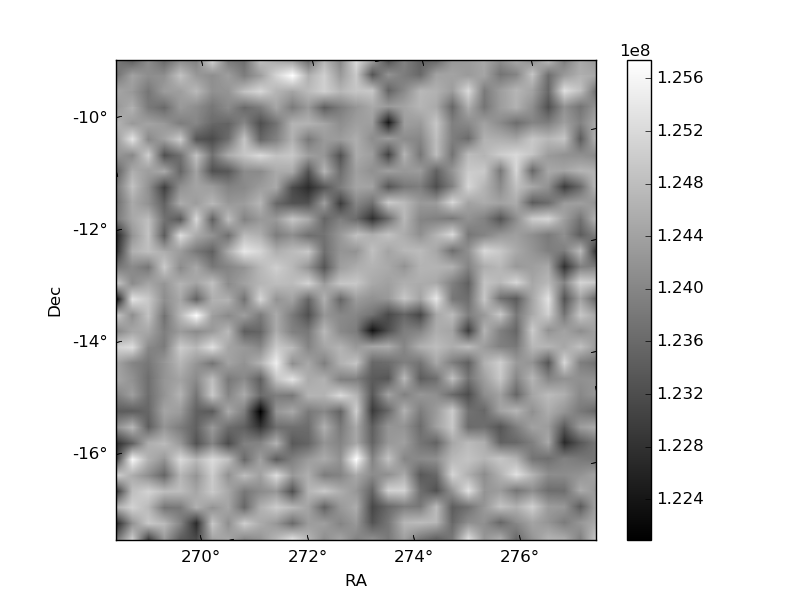
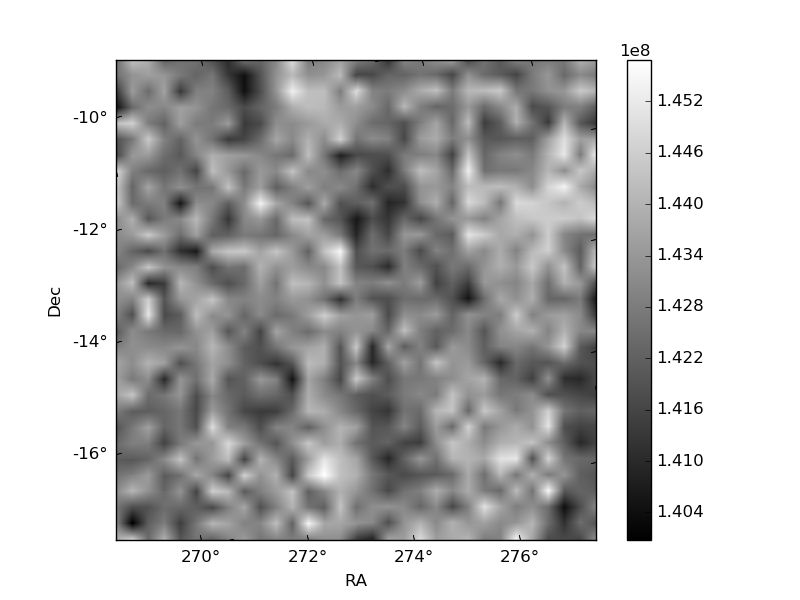
Histogram calculated using DETX and DETY for each event in the final _common_clean file
| Quadrant A | 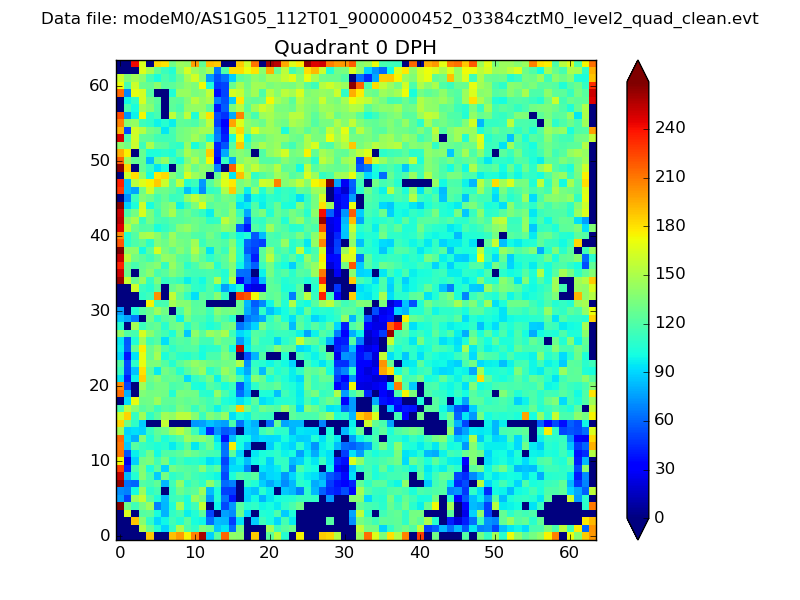 |
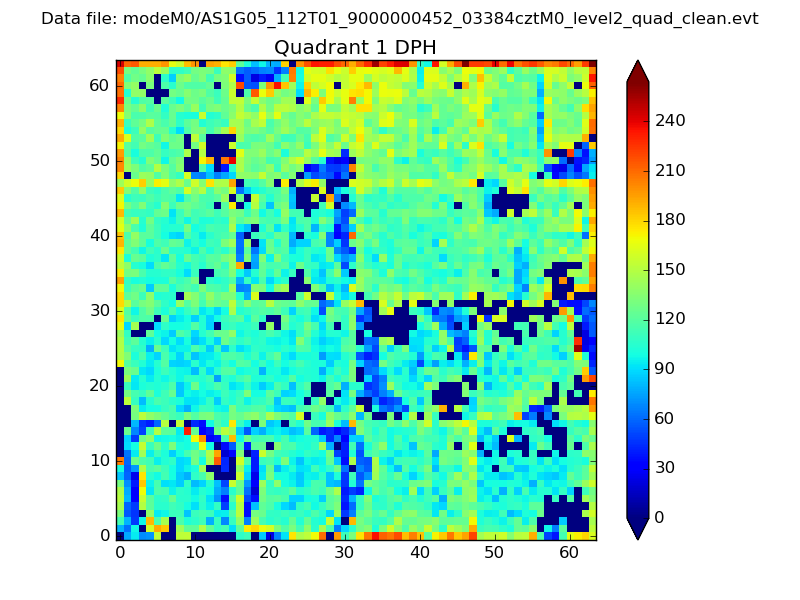 |
Quadrant B |
|---|---|---|---|
| Quadrant D | 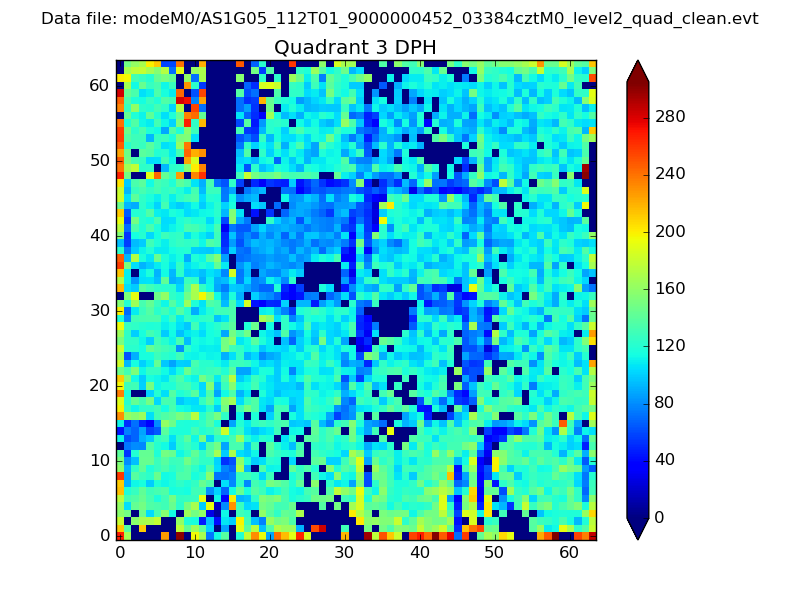 |
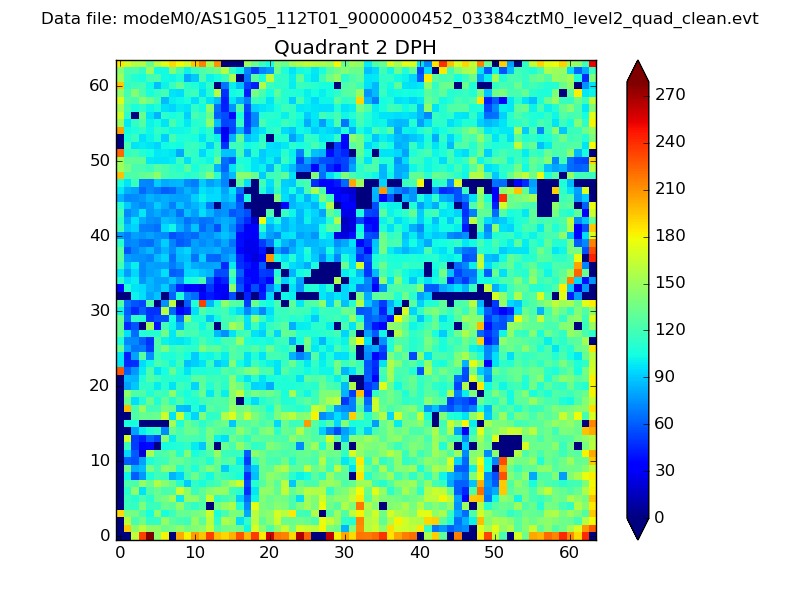 |
Quadrant C |
| Plot type | Count rate plots | Images |
|---|---|---|
| Comparison with Poisson distribution Blue bars denote a histogram of data divided into 1 sec bins. Red curve is a Poisson curve with rate = median count rate of data. |
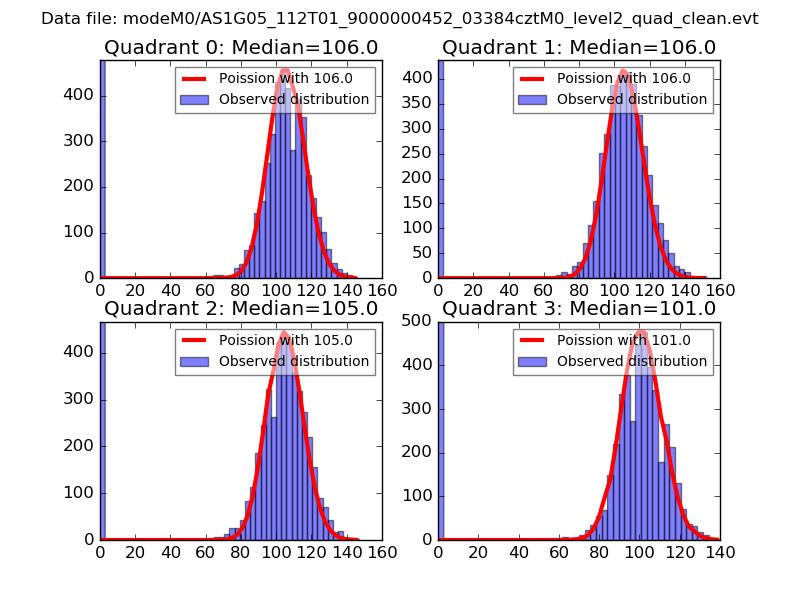 |
 |
| Quadrant-wise count rates Data is divided into 100 sec bins |
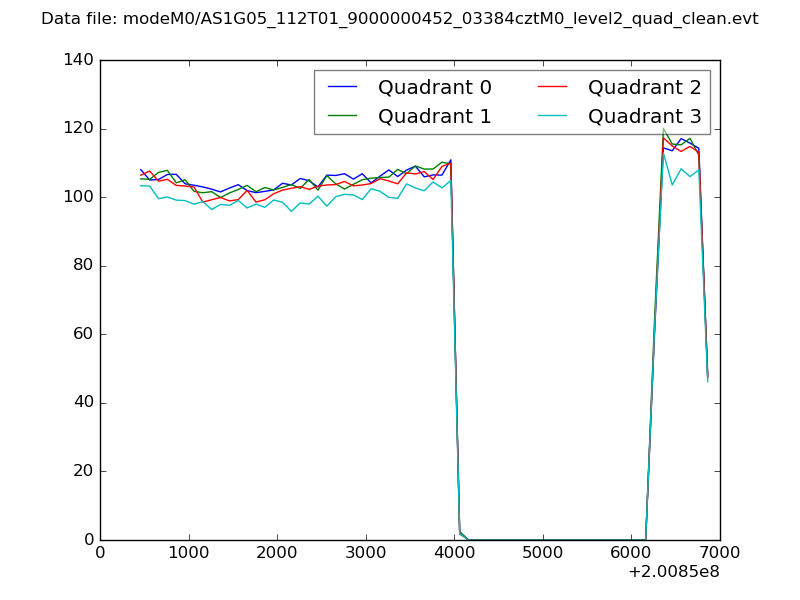 |
|
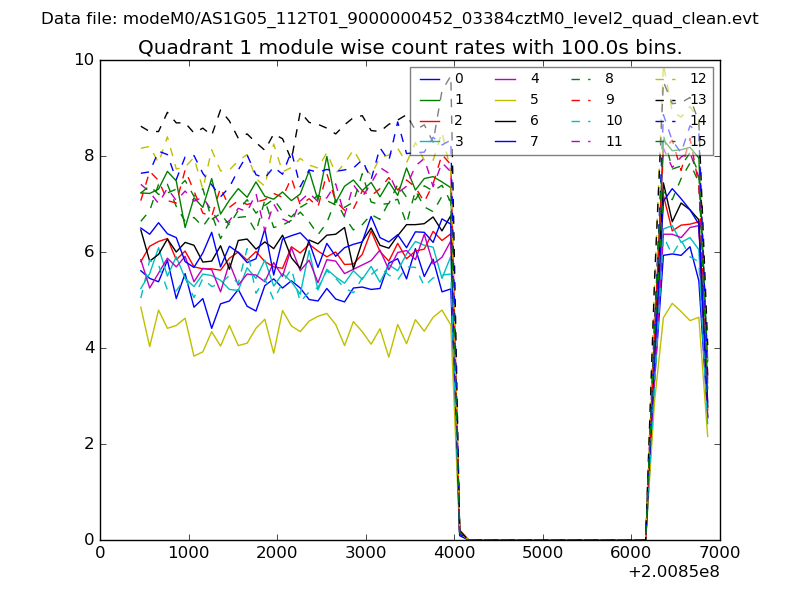
| Module-wise count rates for Quadrant A Data is divided into 100 sec bins |
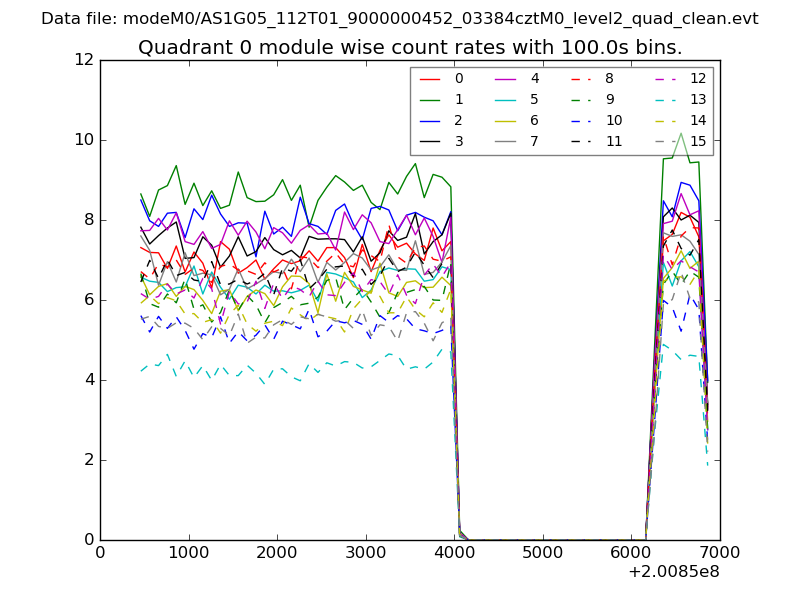 |
 |
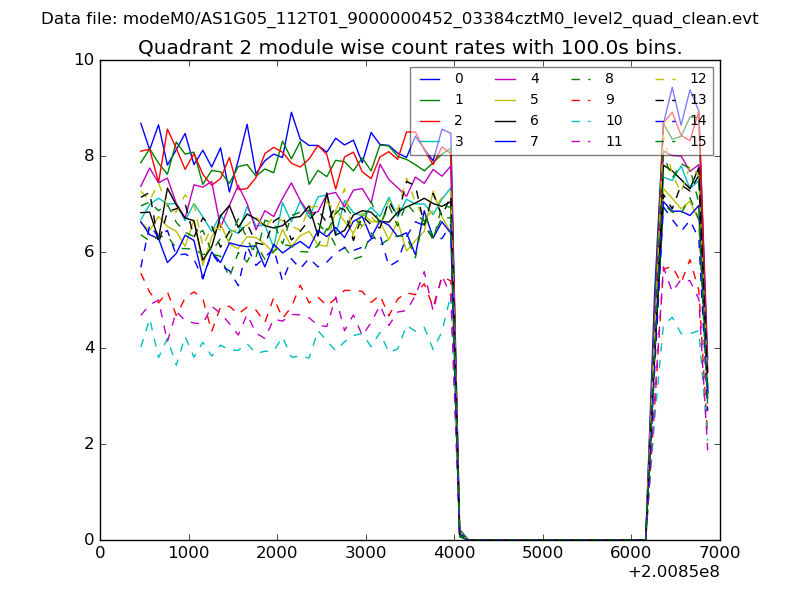
| Module-wise count rates for Quadrant B Data is divided into 100 sec bins |
 |
 |
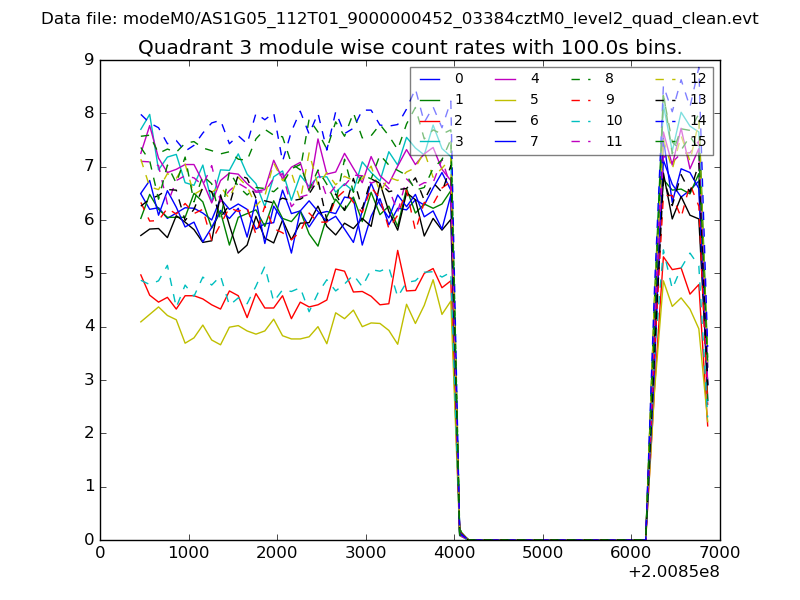
| Module-wise count rates for Quadrant C Data is divided into 100 sec bins |
 |
 |
| Module-wise count rates for Quadrant D Data is divided into 100 sec bins |
 |
 |
| Parameter | Plot |
|---|---|
| CZT HV Monitor | 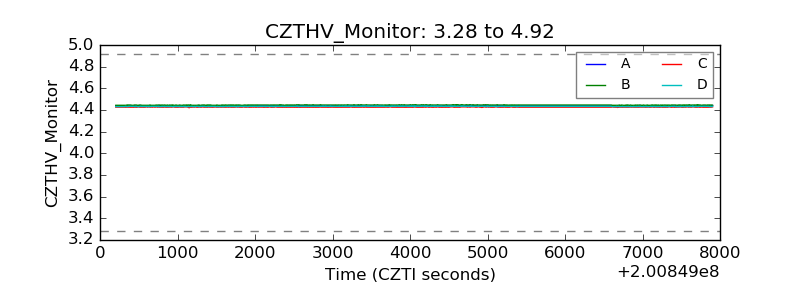 |
| D_VDD | 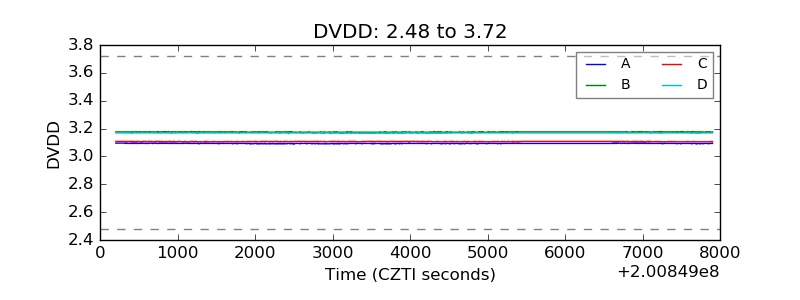 |
| Temperature 1 | 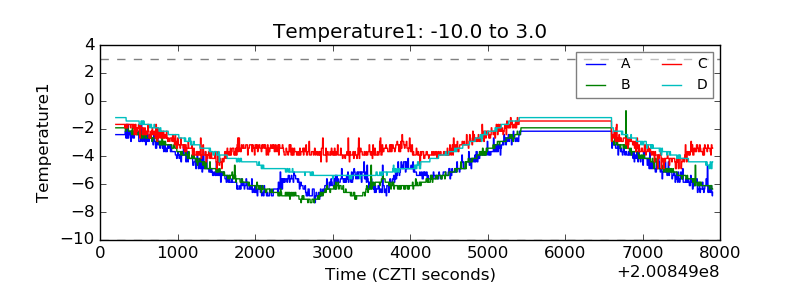 |
| Veto HV Monitor | 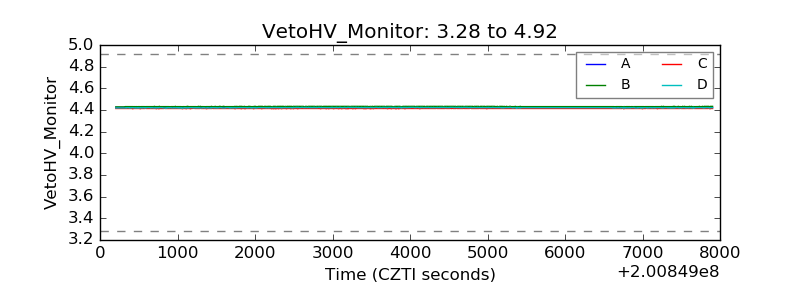 |
| Veto LLD | 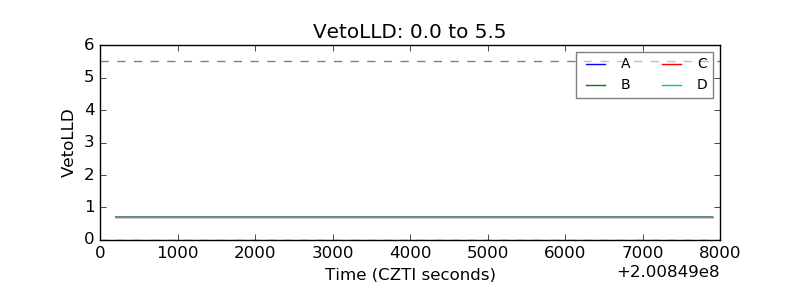 |
| Alpha Counter | 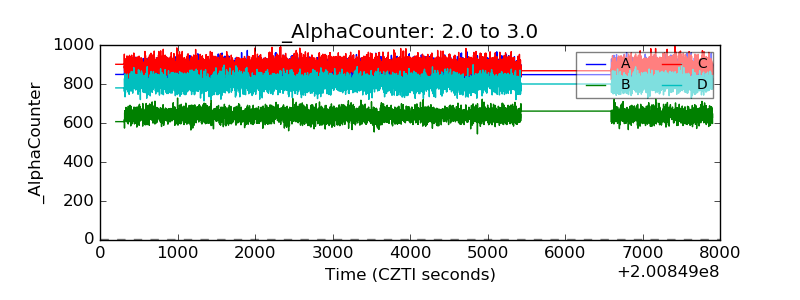 |
| _CPM_Rate | 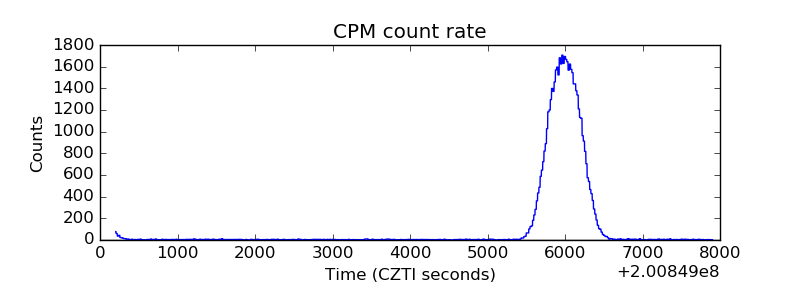 |
| CZT Counter | 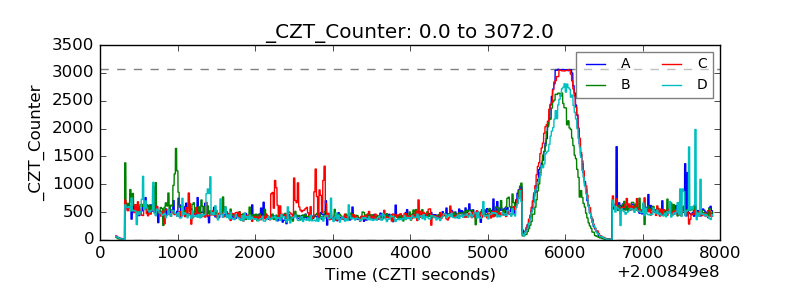 |
| +2.5 Volts monitor | 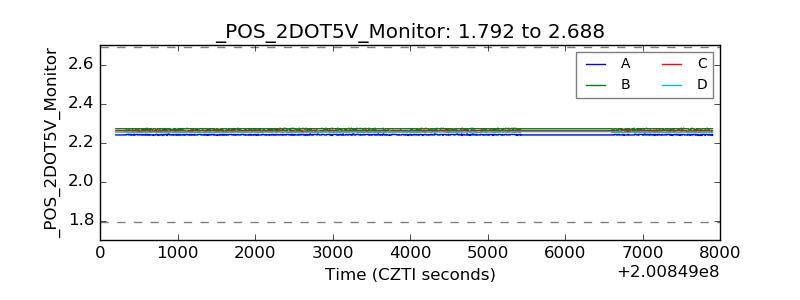 |
| +5 Volts monitor | 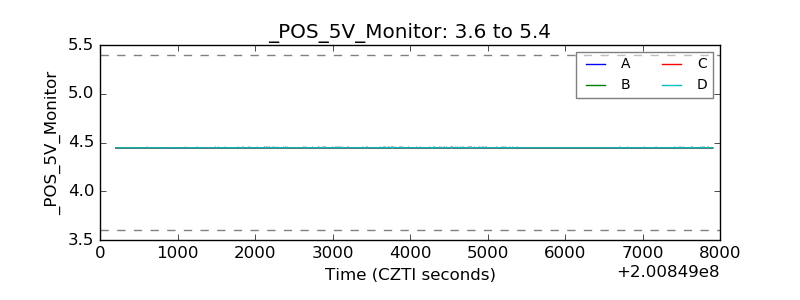 |
| _ROLL_ROT | 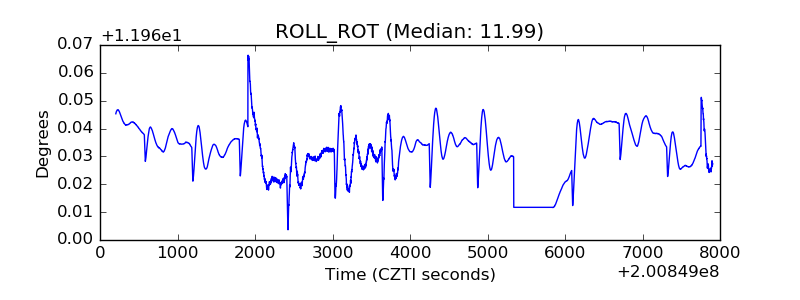 |
| _Roll_DEC | 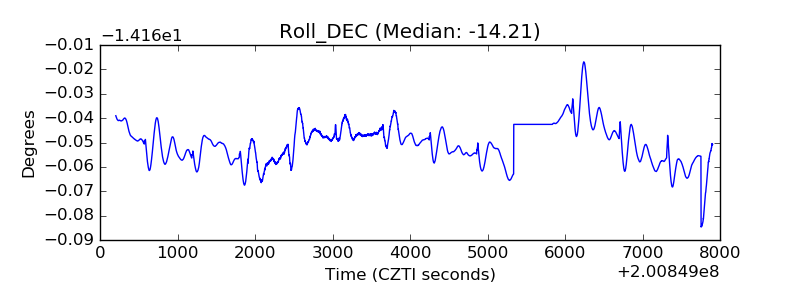 |
| _Roll_RA | 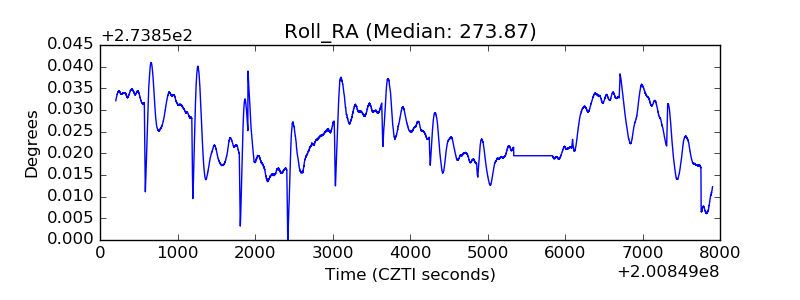 |
| Veto Counter | 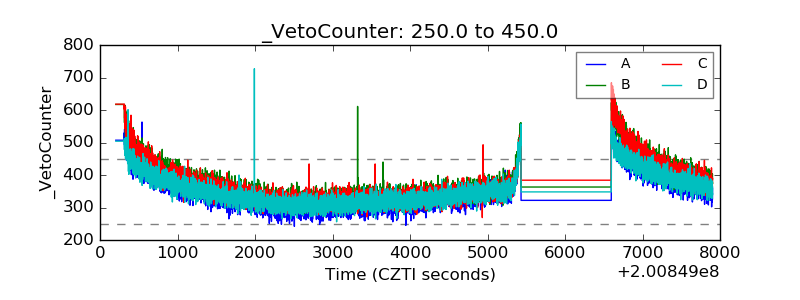 |