| Param | Original file | Final file |
|---|---|---|
| Filename | modeM0/AS1G05_112T01_9000000452_03385cztM0_level2.evt | modeM0/AS1G05_112T01_9000000452_03385cztM0_level2_quad_clean.evt |
| Size (bytes) | 426,263,040 | 80,461,440 |
| Size | 406.5 MB | 76.7 MB |
| Events in quadrant A | 3,178,256 | 506,914 |
| Events in quadrant B | 3,200,027 | 510,195 |
| Events in quadrant C | 3,067,055 | 502,743 |
| Events in quadrant D | 3,038,410 | 479,687 |
| Mode M9 | |||
|---|---|---|---|
| Quadrant | BADHDUFLAG | Total packets | Discarded packets |
| A | 0 | 19 | 0 |
| B | 0 | 19 | 0 |
| C | 0 | 19 | 0 |
| D | 0 | 20 | 0 |
| Mode SS | |||
|---|---|---|---|
| Quadrant | BADHDUFLAG | Total packets | Discarded packets |
| A | 0 | 126 | 0 |
| B | 0 | 126 | 0 |
| C | 0 | 126 | 0 |
| D | 0 | 126 | 0 |
| Mode M0 | |||
|---|---|---|---|
| Quadrant | BADHDUFLAG | Total packets | Discarded packets |
| A | 0 | 13487 | 3 |
| B | 0 | 13650 | 2 |
| C | 0 | 13193 | 2 |
| D | 0 | 13393 | 2 |
| Quadrant | Total seconds | Saturated seconds | Saturation percentage |
|---|---|---|---|
| A | 6265 | 50 | 0.798085% |
| B | 6265 | 37 | 0.590583% |
| C | 6265 | 25 | 0.399042% |
| D | 6265 | 34 | 0.542698% |
Noise dominated data is calculated using 1-second bins in cleaned event files. If a bin has >2000 counts, and if more than 50% of those come from <1% of pixels, then it is considered to be noise-dominated and hence unusable.
| Quadrant | # 1 sec bins | Bins with >0 counts | Bins with >2000 counts | High rate bins dominated by noise | Noise dominated (total time) | Noise dominated (detector-on time) | Marked lightcurve |
|---|---|---|---|---|---|---|---|
| A | 7500 | 6266 | 15 | 15 | 0.20% | 0.24% | 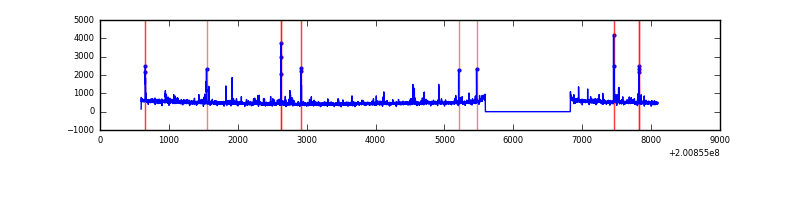 |
| B | 7500 | 6266 | 2 | 2 | 0.03% | 0.03% | 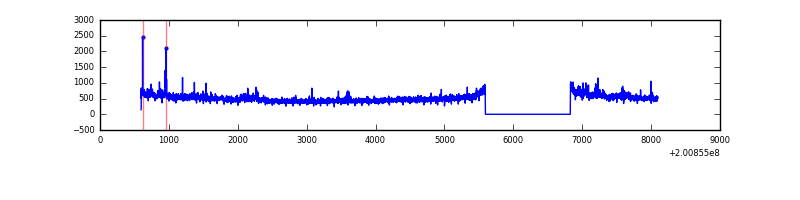 |
| C | 7500 | 6266 | 7 | 7 | 0.09% | 0.11% | 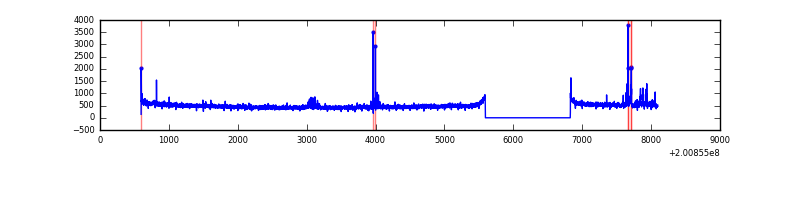 |
| D | 7500 | 6266 | 21 | 21 | 0.28% | 0.34% | 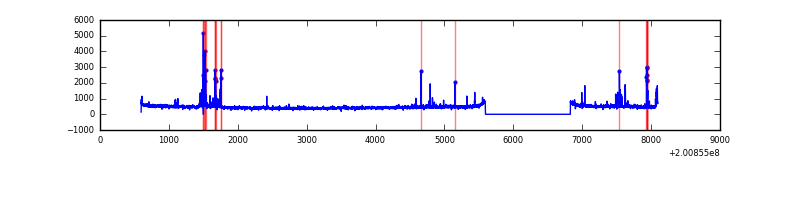 |
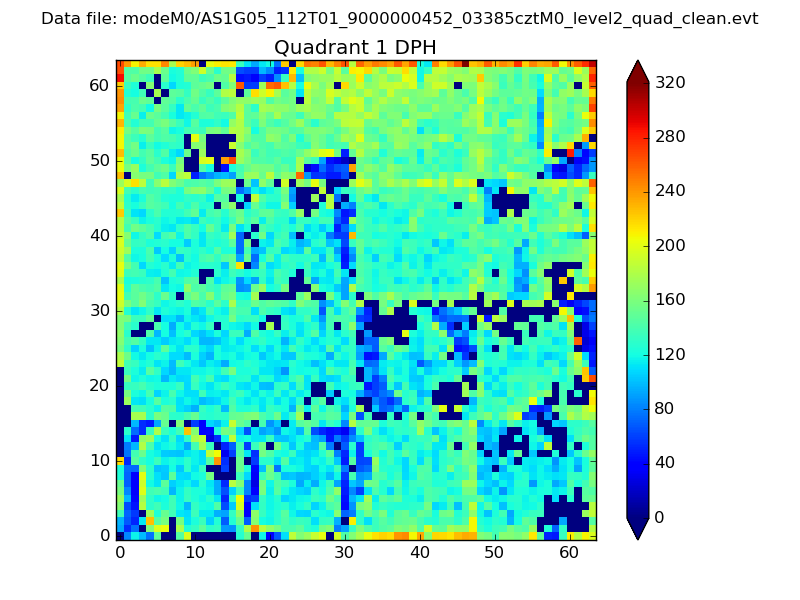
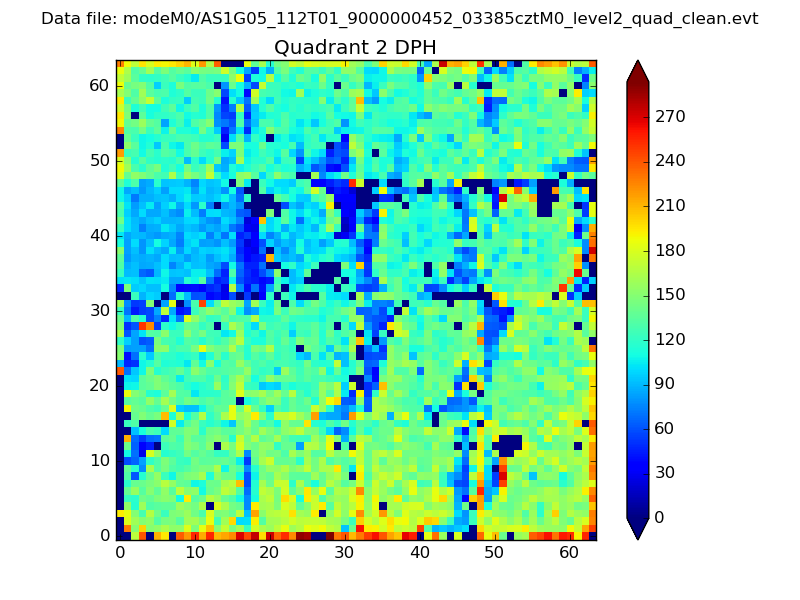
Top three noisy pixels from each quadrant. If the there are fewer than three noisy pixels in the level2.evt file, extra rows are filled as -1
| Pixel properties | Quadrant properties | ||||||
|---|---|---|---|---|---|---|---|
| Quadrant | DetID | PixID | Counts | Sigma | Mean | Median | Sigma |
| A | 0 | 118 | 158859 | 1017.75 | 759 | 745 | 155.4 |
| A | 8 | 15 | 43022 | 272.13 | 759 | 745 | 155.4 |
| A | 0 | 226 | 22737 | 141.56 | 759 | 745 | 155.4 |
| B | 15 | 204 | 95960 | 642.37 | 776 | 762 | 148.2 |
| B | 14 | 167 | 57061 | 379.89 | 776 | 762 | 148.2 |
| B | 2 | 249 | 18664 | 120.8 | 776 | 762 | 148.2 |
| C | 1 | 192 | 59871 | 339.77 | 747 | 752 | 174.0 |
| C | 14 | 67 | 24736 | 137.84 | 747 | 752 | 174.0 |
| C | 6 | 80 | 18662 | 102.93 | 747 | 752 | 174.0 |
| D | 13 | 223 | 180299 | 1005.59 | 737 | 717 | 178.6 |
| D | 2 | 206 | 20102 | 108.55 | 737 | 717 | 178.6 |
| D | 5 | 233 | 17131 | 91.91 | 737 | 717 | 178.6 |
Histogram calculated using DETX and DETY for each event in the final _common_clean file
| Quadrant A | 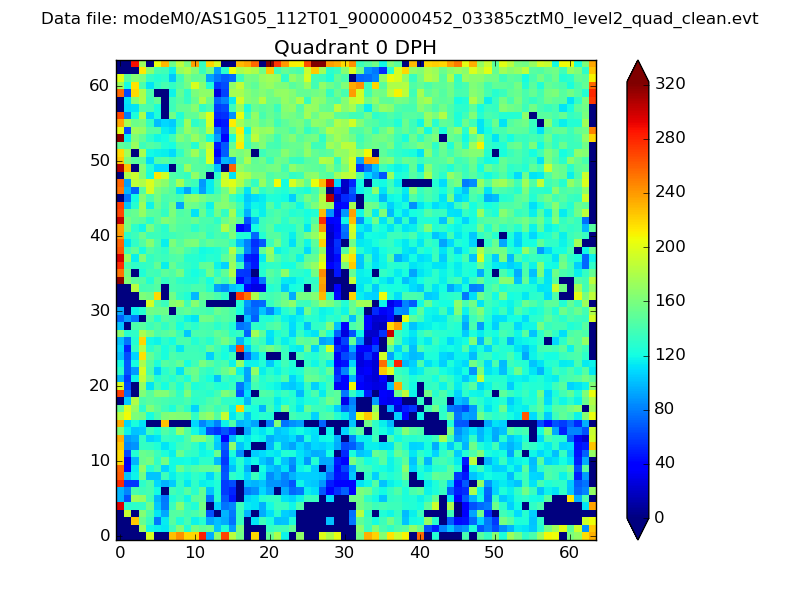 |
 |
Quadrant B |
|---|---|---|---|
| Quadrant D | 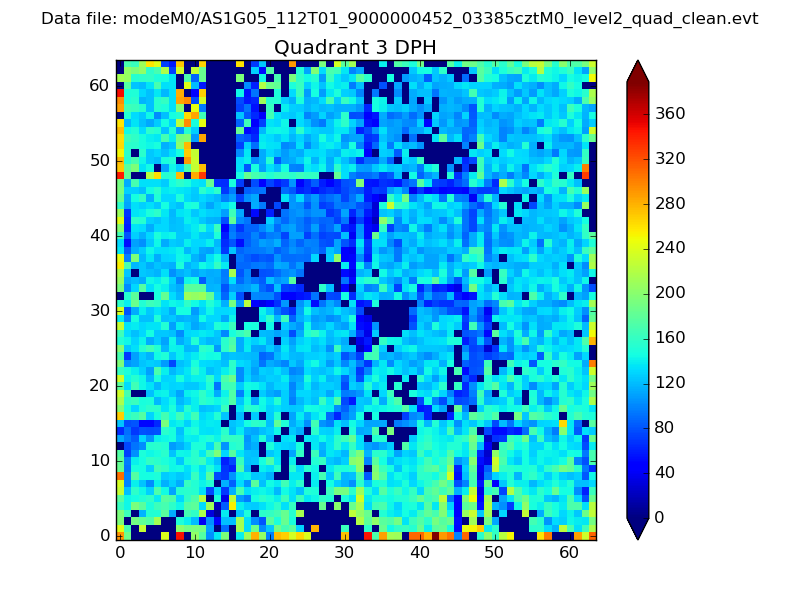 |
 |
Quadrant C |
| Plot type | Count rate plots | Images |
|---|---|---|
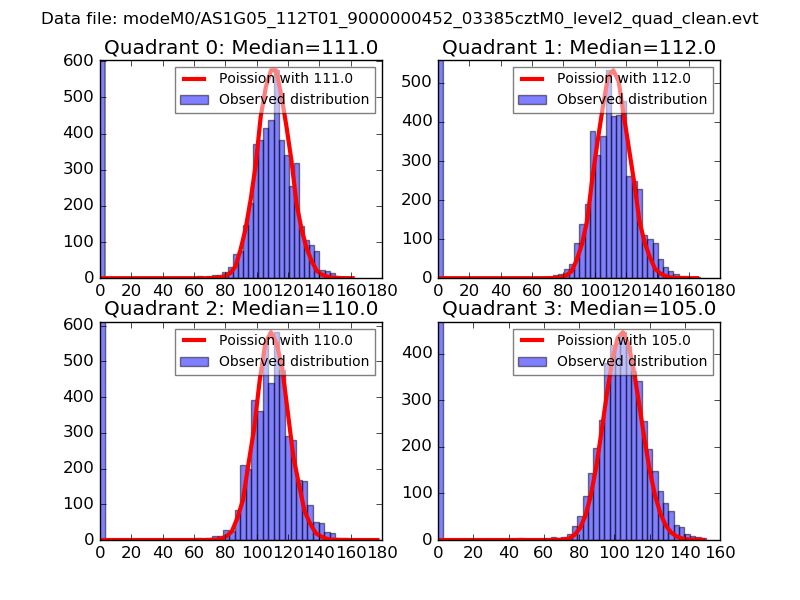
| Comparison with Poisson distribution Blue bars denote a histogram of data divided into 1 sec bins. Red curve is a Poisson curve with rate = median count rate of data. |
 |
 |
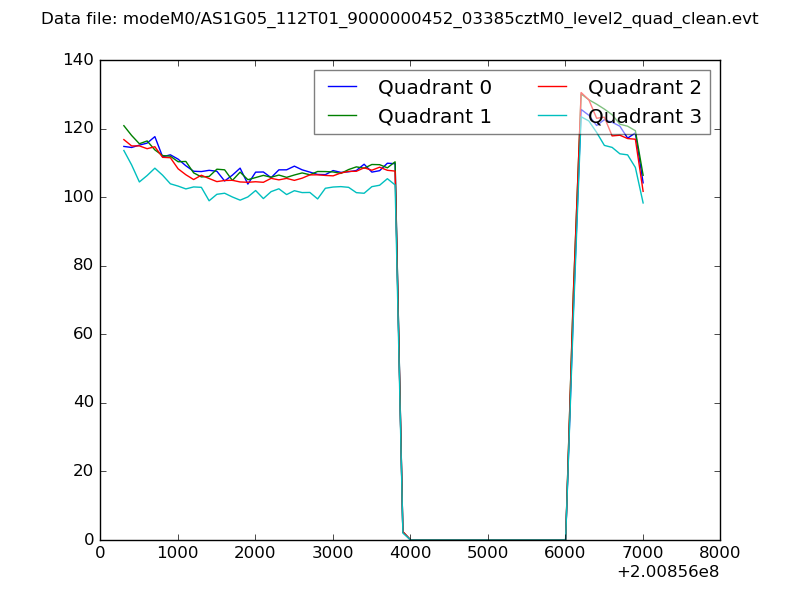
| Quadrant-wise count rates Data is divided into 100 sec bins |
 |
|
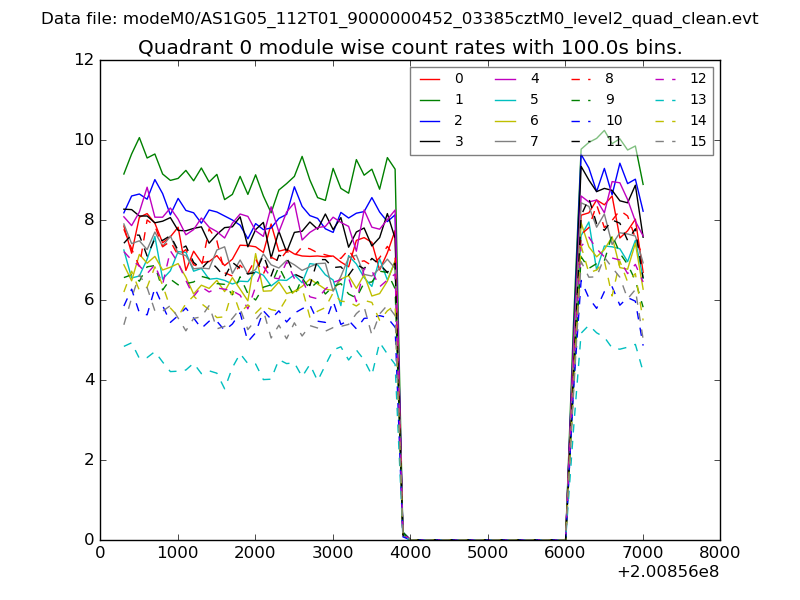
| Module-wise count rates for Quadrant A Data is divided into 100 sec bins |
 |
 |
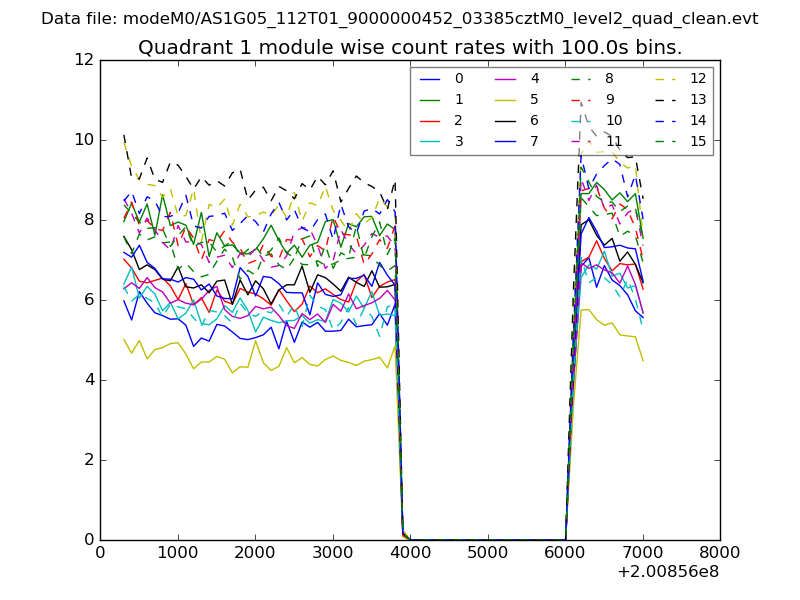
| Module-wise count rates for Quadrant B Data is divided into 100 sec bins |
 |
 |
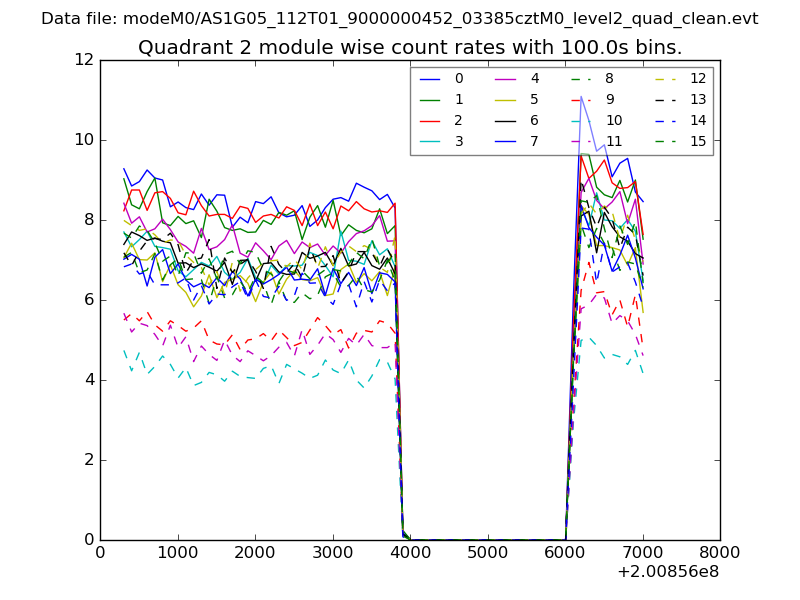
| Module-wise count rates for Quadrant C Data is divided into 100 sec bins |
 |
 |
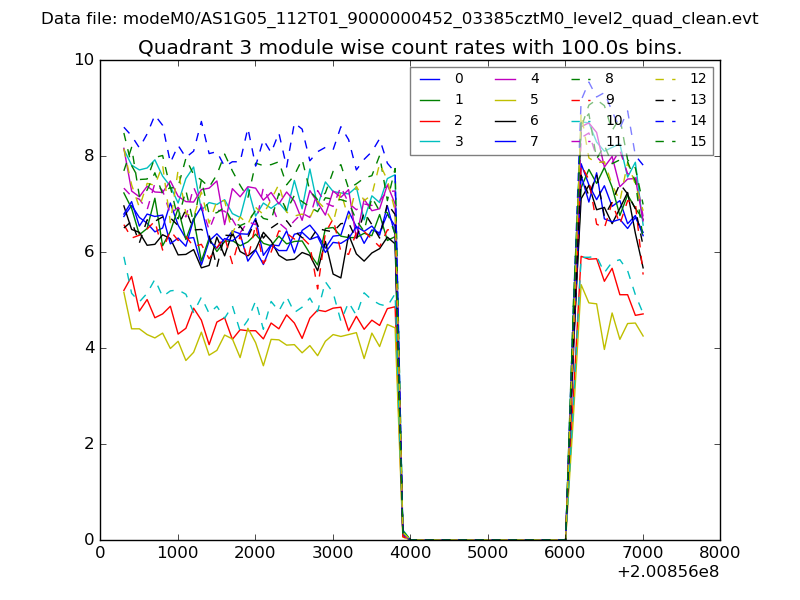
| Module-wise count rates for Quadrant D Data is divided into 100 sec bins |
 |
 |
| Parameter | Plot |
|---|---|
| CZT HV Monitor | 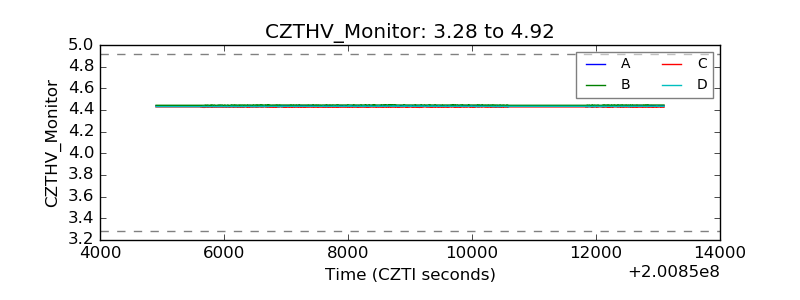 |
| D_VDD | 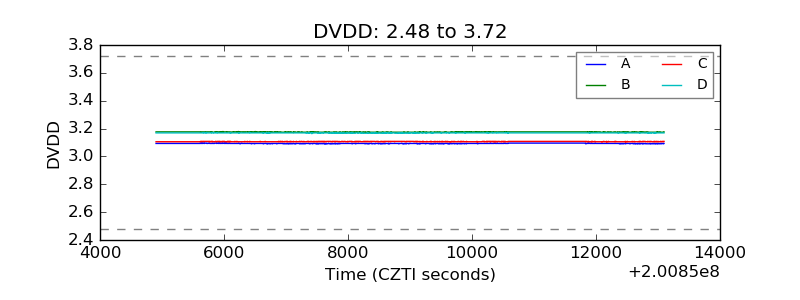 |
| Temperature 1 | 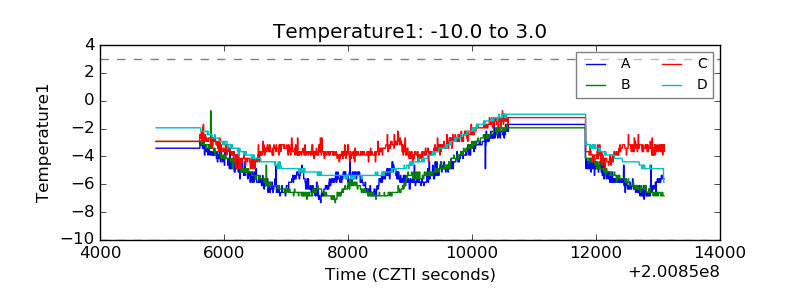 |
| Veto HV Monitor | 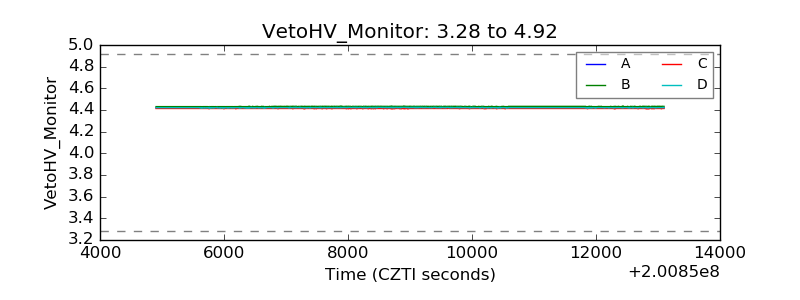 |
| Veto LLD | 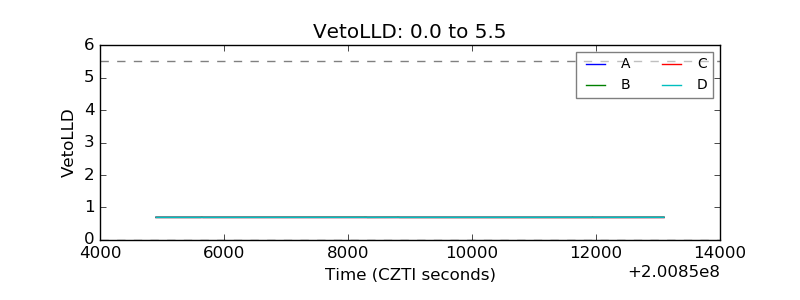 |
| Alpha Counter | 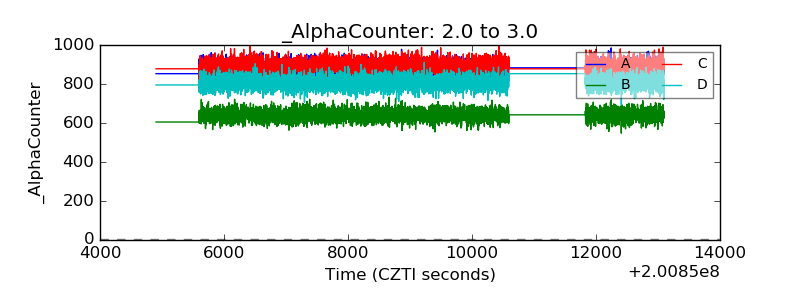 |
| _CPM_Rate | 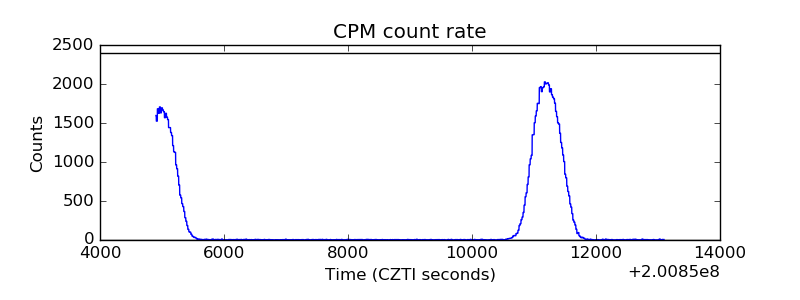 |
| CZT Counter | 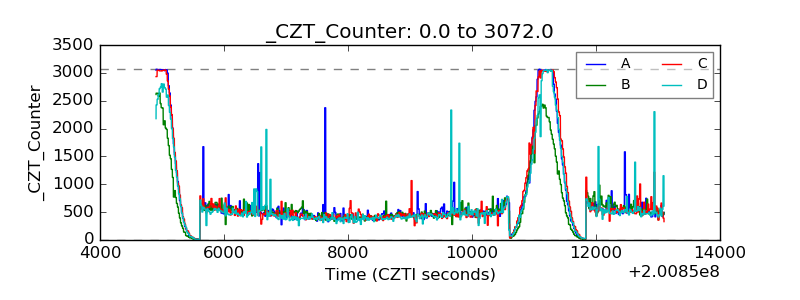 |
| +2.5 Volts monitor | 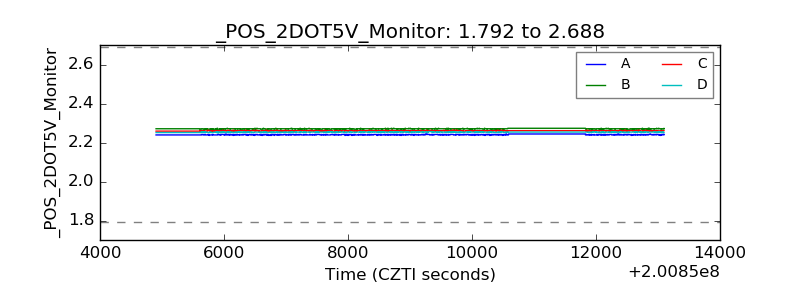 |
| +5 Volts monitor |  |
| _ROLL_ROT | 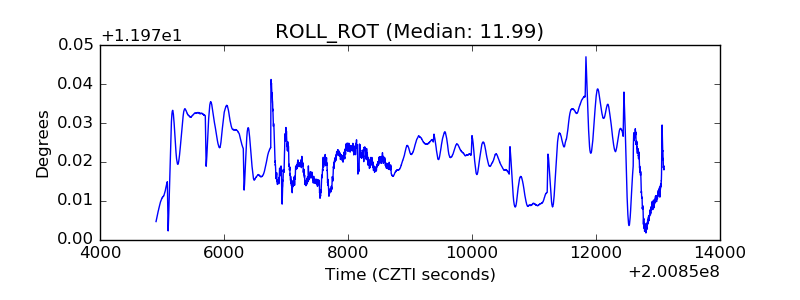 |
| _Roll_DEC | 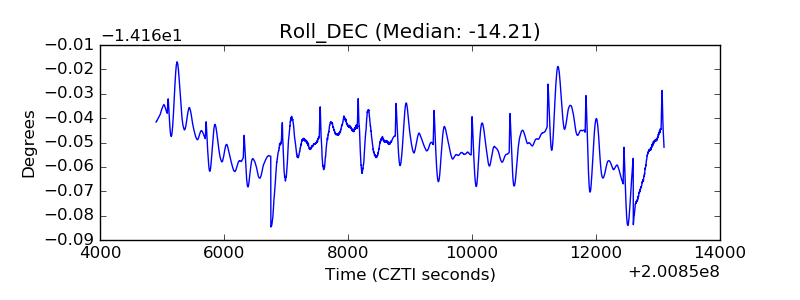 |
| _Roll_RA | 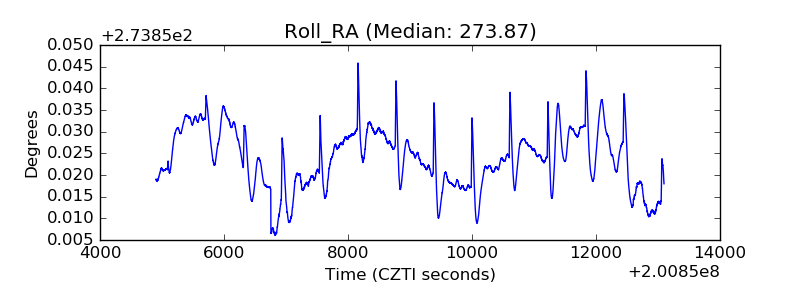 |
| Veto Counter | 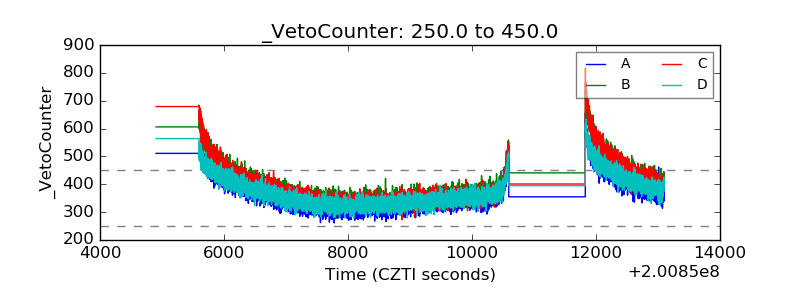 |