| Param | Original file | Final file |
|---|---|---|
| Filename | modeM0/AS1G05_112T01_9000000452_03386cztM0_level2.evt | modeM0/AS1G05_112T01_9000000452_03386cztM0_level2_quad_clean.evt |
| Size (bytes) | 465,888,960 | 87,621,120 |
| Size | 444.3 MB | 83.6 MB |
| Events in quadrant A | 3,098,773 | 562,131 |
| Events in quadrant B | 3,292,209 | 570,011 |
| Events in quadrant C | 4,309,456 | 548,356 |
| Events in quadrant D | 2,984,397 | 536,390 |
| Mode M9 | |||
|---|---|---|---|
| Quadrant | BADHDUFLAG | Total packets | Discarded packets |
| A | 0 | 14 | 0 |
| B | 0 | 14 | 0 |
| C | 0 | 14 | 0 |
| D | 0 | 15 | 0 |
| Mode SS | |||
|---|---|---|---|
| Quadrant | BADHDUFLAG | Total packets | Discarded packets |
| A | 0 | 126 | 0 |
| B | 0 | 126 | 0 |
| C | 0 | 126 | 0 |
| D | 0 | 126 | 0 |
| Mode M0 | |||
|---|---|---|---|
| Quadrant | BADHDUFLAG | Total packets | Discarded packets |
| A | 0 | 13291 | 3 |
| B | 0 | 13915 | 2 |
| C | 0 | 16715 | 2 |
| D | 0 | 13233 | 2 |
| Quadrant | Total seconds | Saturated seconds | Saturation percentage |
|---|---|---|---|
| A | 6256 | 52 | 0.831202% |
| B | 6256 | 66 | 1.054987% |
| C | 6256 | 223 | 3.564578% |
| D | 6256 | 30 | 0.479540% |
Noise dominated data is calculated using 1-second bins in cleaned event files. If a bin has >2000 counts, and if more than 50% of those come from <1% of pixels, then it is considered to be noise-dominated and hence unusable.
| Quadrant | # 1 sec bins | Bins with >0 counts | Bins with >2000 counts | High rate bins dominated by noise | Noise dominated (total time) | Noise dominated (detector-on time) | Marked lightcurve |
|---|---|---|---|---|---|---|---|
| A | 7551 | 6257 | 7 | 7 | 0.09% | 0.11% |  |
| B | 7551 | 6257 | 2 | 2 | 0.03% | 0.03% |  |
| C | 7551 | 6257 | 202 | 202 | 2.68% | 3.23% | 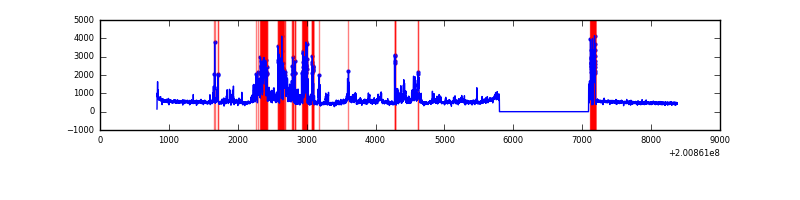 |
| D | 7551 | 6257 | 17 | 17 | 0.23% | 0.27% | 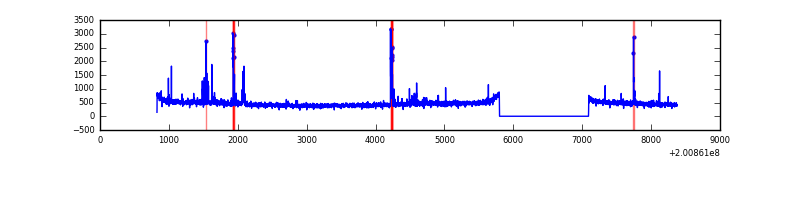 |
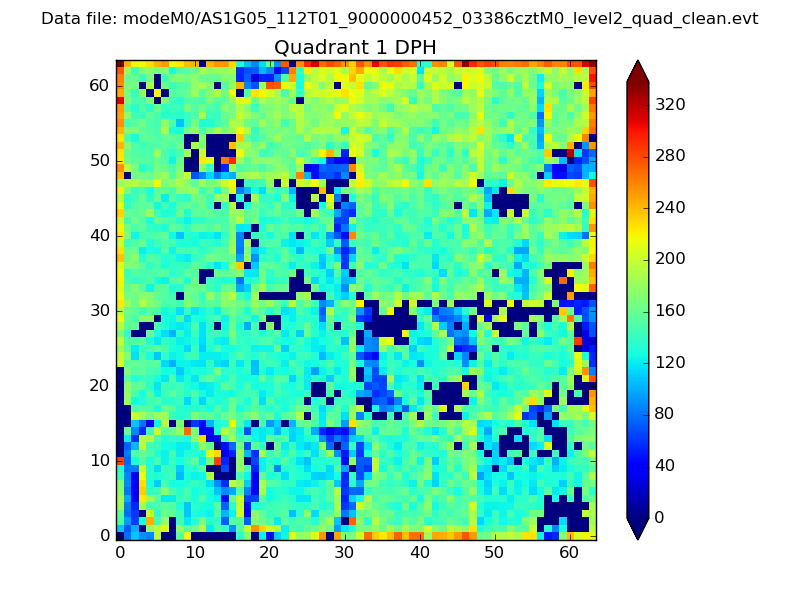
Top three noisy pixels from each quadrant. If the there are fewer than three noisy pixels in the level2.evt file, extra rows are filled as -1
| Pixel properties | Quadrant properties | ||||||
|---|---|---|---|---|---|---|---|
| Quadrant | DetID | PixID | Counts | Sigma | Mean | Median | Sigma |
| A | 0 | 118 | 108003 | 693.25 | 761 | 745 | 154.7 |
| A | 15 | 170 | 32442 | 204.87 | 761 | 745 | 154.7 |
| A | 0 | 226 | 17669 | 109.39 | 761 | 745 | 154.7 |
| B | 15 | 204 | 178355 | 1186.35 | 781 | 764 | 149.7 |
| B | 14 | 167 | 36964 | 241.82 | 781 | 764 | 149.7 |
| B | 0 | 229 | 24275 | 157.06 | 781 | 764 | 149.7 |
| C | 1 | 192 | 1352182 | 7804.09 | 745 | 753 | 173.2 |
| C | 14 | 67 | 21175 | 117.93 | 745 | 753 | 173.2 |
| C | 9 | 54 | 16216 | 89.29 | 745 | 753 | 173.2 |
| D | 13 | 223 | 129626 | 724.4 | 741 | 723 | 177.9 |
| D | 2 | 206 | 18030 | 97.26 | 741 | 723 | 177.9 |
| D | 2 | 107 | 12978 | 68.87 | 741 | 723 | 177.9 |
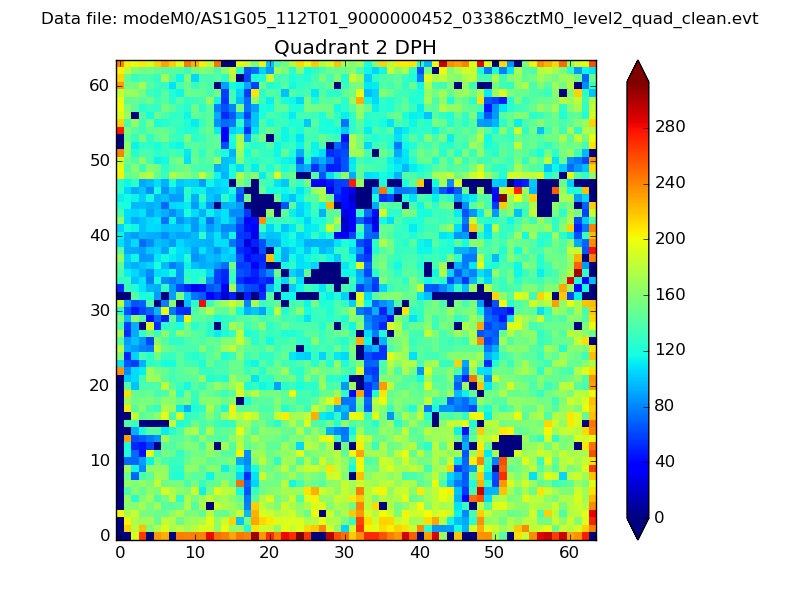
Histogram calculated using DETX and DETY for each event in the final _common_clean file
| Quadrant A | 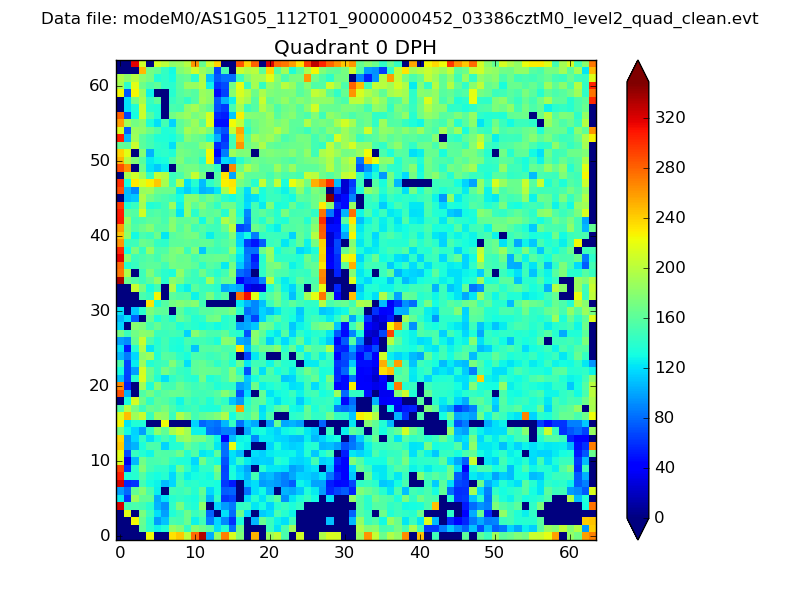 |
 |
Quadrant B |
|---|---|---|---|
| Quadrant D | 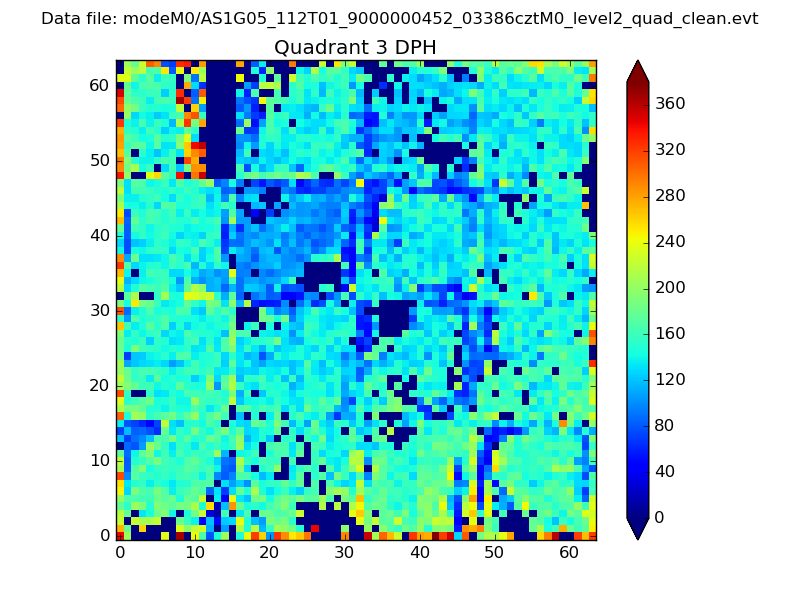 |
 |
Quadrant C |
| Plot type | Count rate plots | Images |
|---|---|---|
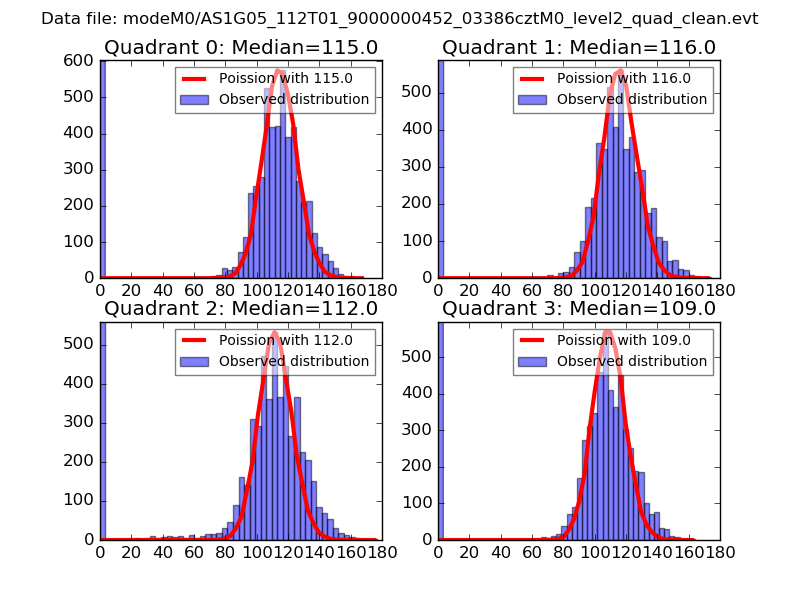
| Comparison with Poisson distribution Blue bars denote a histogram of data divided into 1 sec bins. Red curve is a Poisson curve with rate = median count rate of data. |
 |
 |
| Quadrant-wise count rates Data is divided into 100 sec bins |
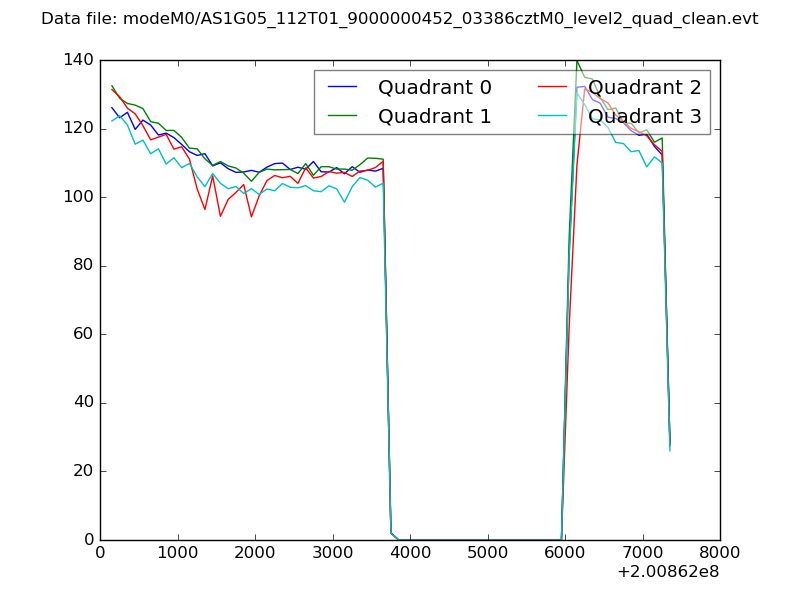 |
|
| Module-wise count rates for Quadrant A Data is divided into 100 sec bins |
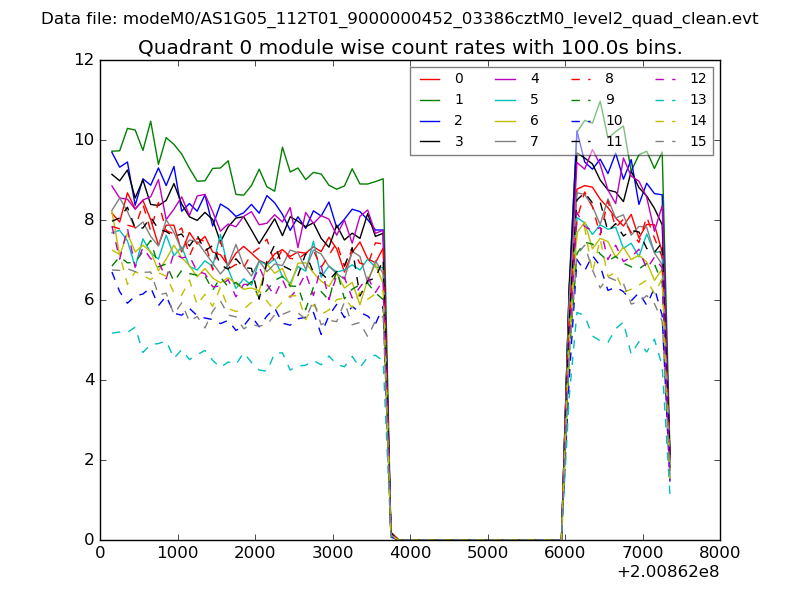 |
 |
| Module-wise count rates for Quadrant B Data is divided into 100 sec bins |
 |
 |
| Module-wise count rates for Quadrant C Data is divided into 100 sec bins |
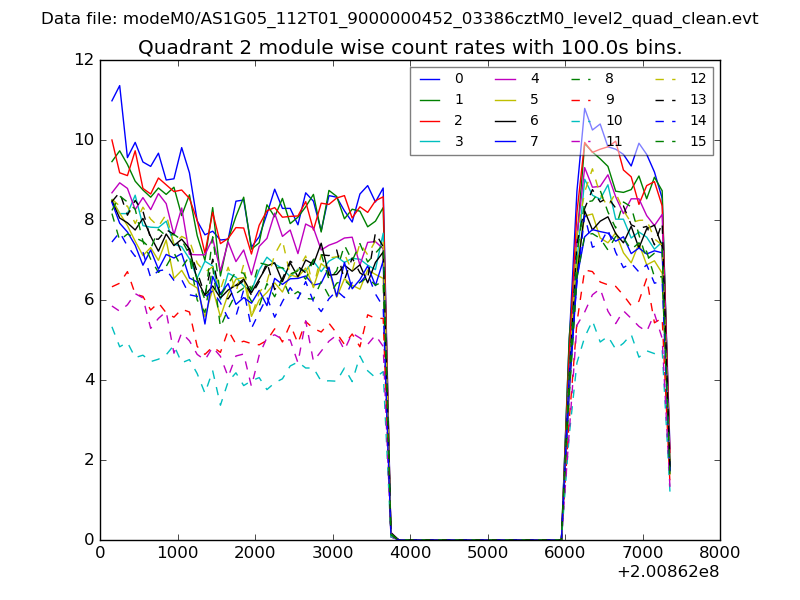 |
 |
| Module-wise count rates for Quadrant D Data is divided into 100 sec bins |
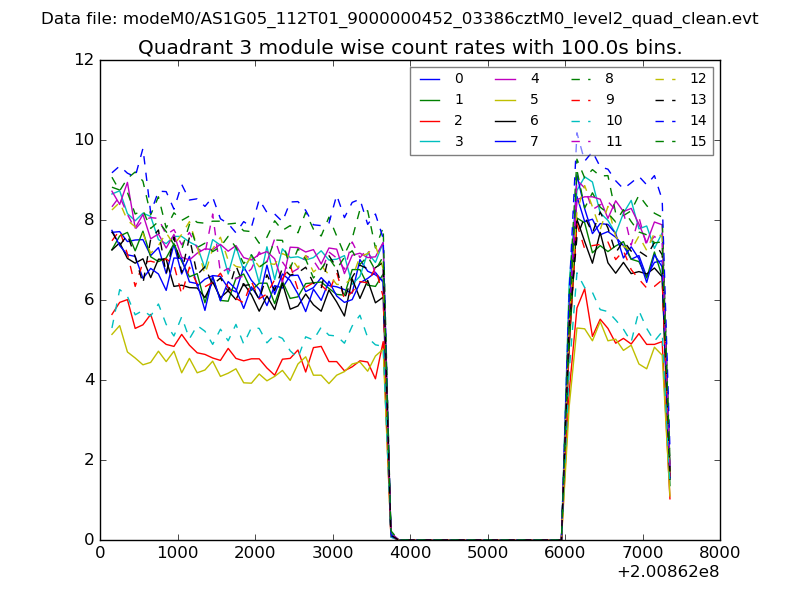 |
 |
| Parameter | Plot |
|---|---|
| CZT HV Monitor | 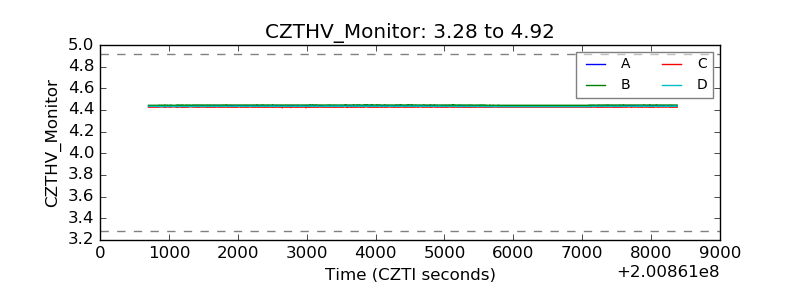 |
| D_VDD | 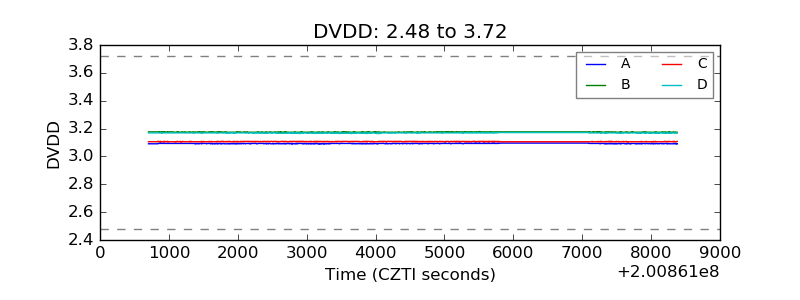 |
| Temperature 1 | 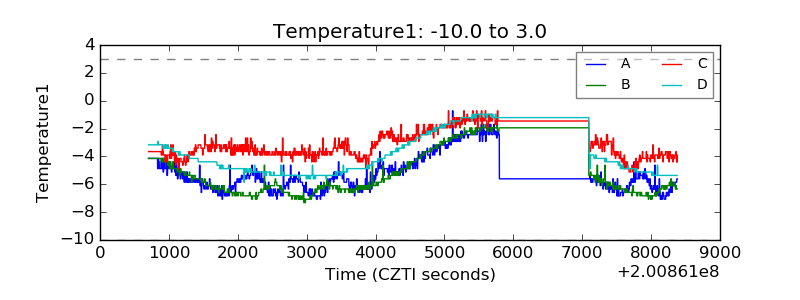 |
| Veto HV Monitor | 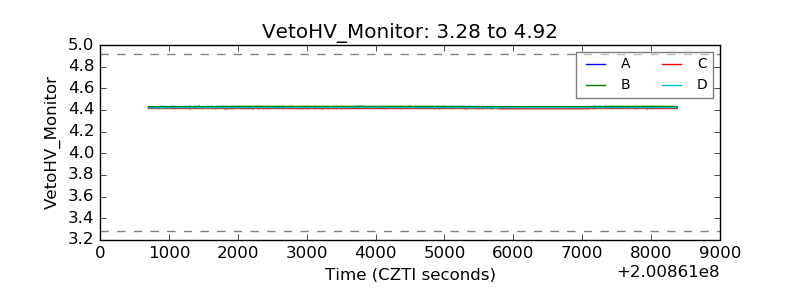 |
| Veto LLD | 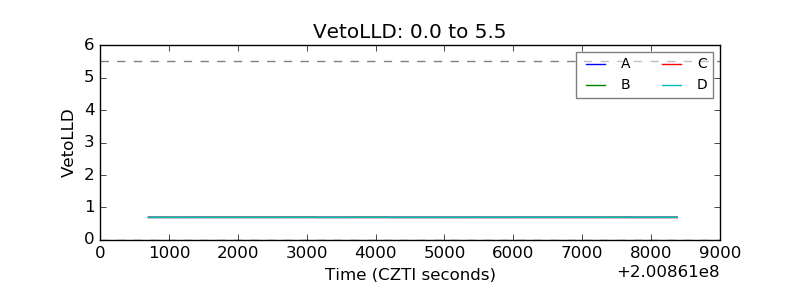 |
| Alpha Counter | 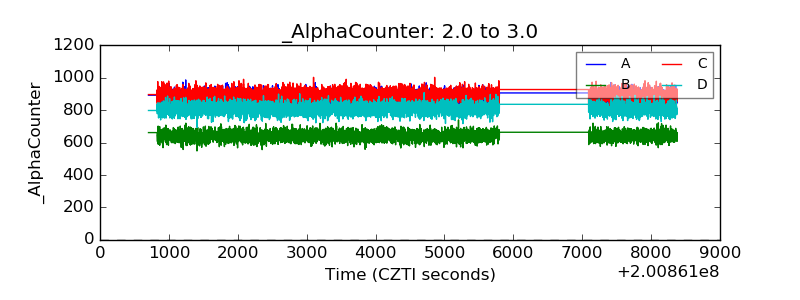 |
| _CPM_Rate | 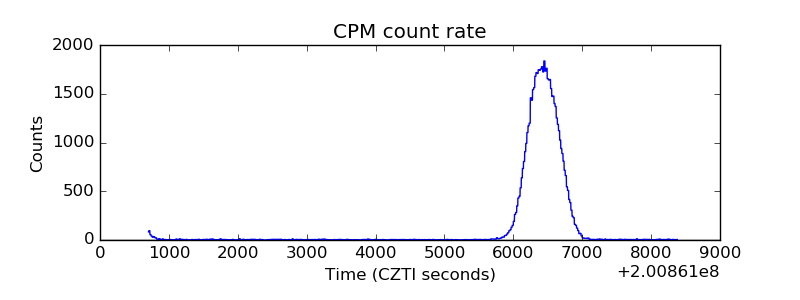 |
| CZT Counter | 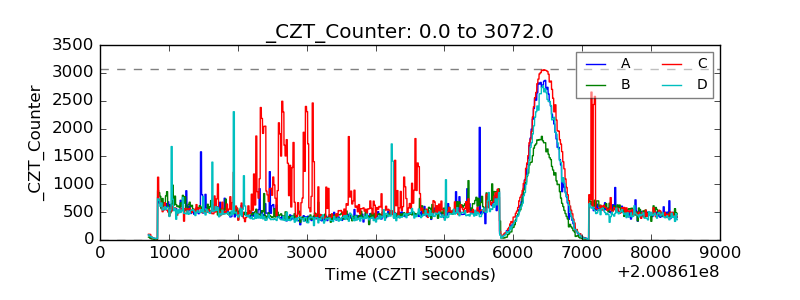 |
| +2.5 Volts monitor |  |
| +5 Volts monitor | 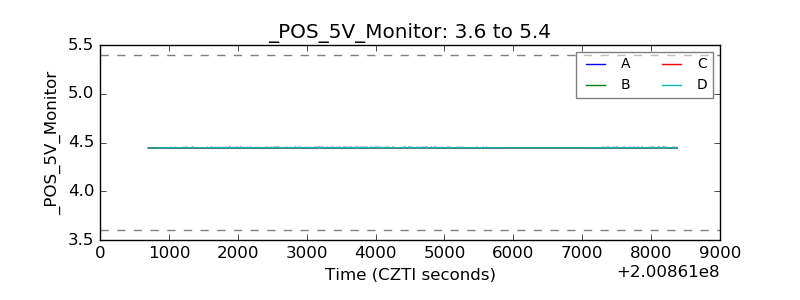 |
| _ROLL_ROT | 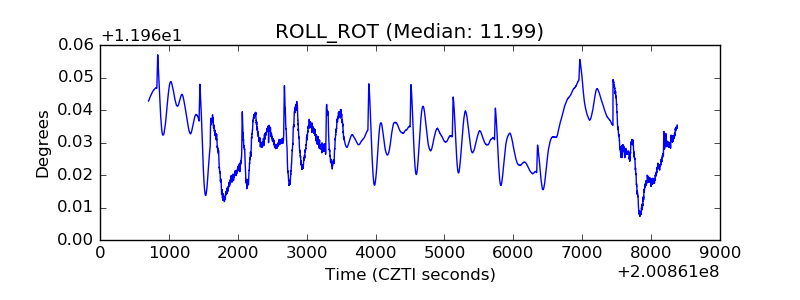 |
| _Roll_DEC | 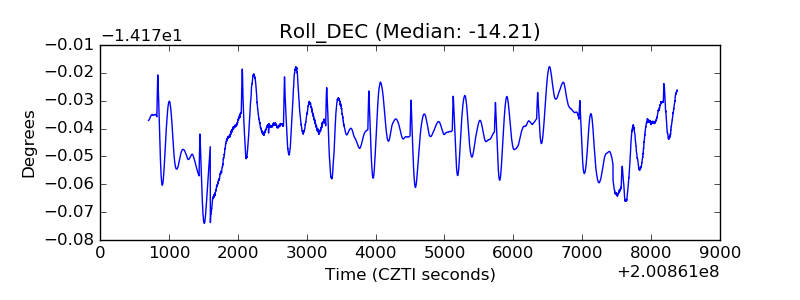 |
| _Roll_RA | 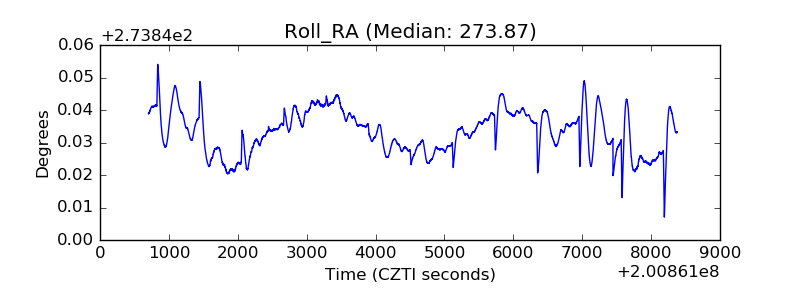 |
| Veto Counter |  |