| Param | Original file | Final file |
|---|---|---|
| Filename | modeM0/AS1G05_112T01_9000000452_03387cztM0_level2.evt | modeM0/AS1G05_112T01_9000000452_03387cztM0_level2_quad_clean.evt |
| Size (bytes) | 391,279,680 | 80,890,560 |
| Size | 373.2 MB | 77.1 MB |
| Events in quadrant A | 2,890,991 | 511,497 |
| Events in quadrant B | 2,899,197 | 520,289 |
| Events in quadrant C | 2,791,206 | 515,463 |
| Events in quadrant D | 2,863,260 | 486,299 |
| Mode M9 | |||
|---|---|---|---|
| Quadrant | BADHDUFLAG | Total packets | Discarded packets |
| A | 0 | 13 | 0 |
| B | 0 | 13 | 0 |
| C | 0 | 13 | 0 |
| D | 0 | 13 | 0 |
| Mode SS | |||
|---|---|---|---|
| Quadrant | BADHDUFLAG | Total packets | Discarded packets |
| A | 0 | 122 | 0 |
| B | 0 | 122 | 0 |
| C | 0 | 122 | 0 |
| D | 0 | 122 | 0 |
| Mode M0 | |||
|---|---|---|---|
| Quadrant | BADHDUFLAG | Total packets | Discarded packets |
| A | 0 | 12552 | 2 |
| B | 0 | 12400 | 1 |
| C | 0 | 12199 | 1 |
| D | 0 | 12753 | 1 |
| Quadrant | Total seconds | Saturated seconds | Saturation percentage |
|---|---|---|---|
| A | 5951 | 37 | 0.621744% |
| B | 5951 | 39 | 0.655352% |
| C | 5951 | 13 | 0.218451% |
| D | 5951 | 59 | 0.991430% |
Noise dominated data is calculated using 1-second bins in cleaned event files. If a bin has >2000 counts, and if more than 50% of those come from <1% of pixels, then it is considered to be noise-dominated and hence unusable.
| Quadrant | # 1 sec bins | Bins with >0 counts | Bins with >2000 counts | High rate bins dominated by noise | Noise dominated (total time) | Noise dominated (detector-on time) | Marked lightcurve |
|---|---|---|---|---|---|---|---|
| A | 7231 | 5952 | 3 | 3 | 0.04% | 0.05% | 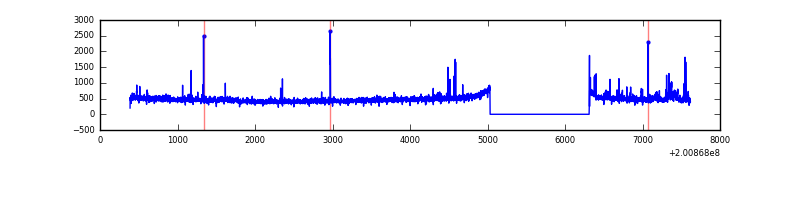 |
| B | 7231 | 5952 | 2 | 2 | 0.03% | 0.03% | 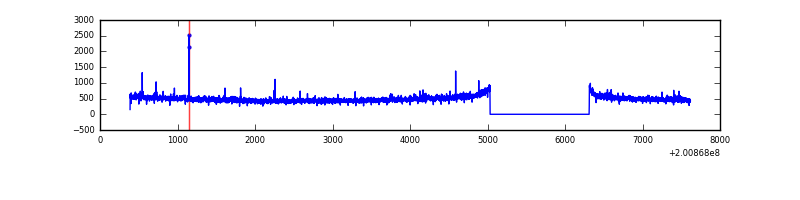 |
| C | 7231 | 5952 | 0 | 0 | 0.00% | 0.00% | 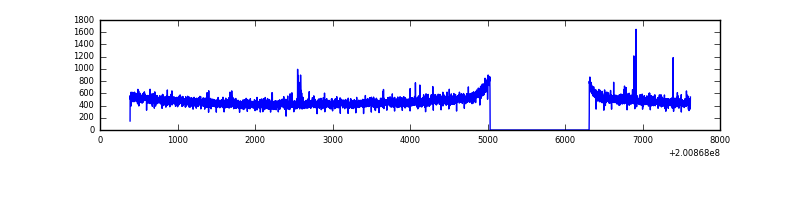 |
| D | 7231 | 5952 | 45 | 45 | 0.62% | 0.76% | 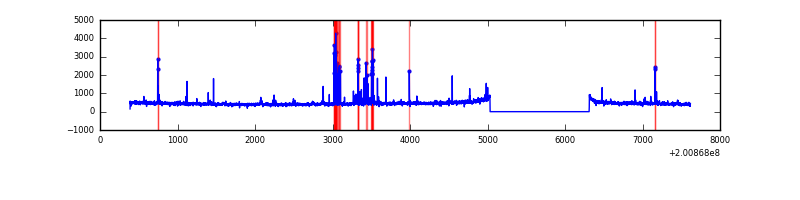 |
Top three noisy pixels from each quadrant. If the there are fewer than three noisy pixels in the level2.evt file, extra rows are filled as -1
| Pixel properties | Quadrant properties | ||||||
|---|---|---|---|---|---|---|---|
| Quadrant | DetID | PixID | Counts | Sigma | Mean | Median | Sigma |
| A | 0 | 118 | 57176 | 390.53 | 707 | 692 | 144.6 |
| A | 0 | 31 | 52277 | 356.66 | 707 | 692 | 144.6 |
| A | 8 | 15 | 22316 | 149.51 | 707 | 692 | 144.6 |
| B | 15 | 204 | 47162 | 334.36 | 726 | 710 | 138.9 |
| B | 0 | 229 | 29683 | 208.55 | 726 | 710 | 138.9 |
| B | 12 | 111 | 10459 | 70.17 | 726 | 710 | 138.9 |
| C | 1 | 192 | 14325 | 82.82 | 703 | 704 | 164.5 |
| C | 9 | 144 | 7459 | 41.07 | 703 | 704 | 164.5 |
| C | 14 | 67 | 6962 | 38.05 | 703 | 704 | 164.5 |
| D | 13 | 223 | 197441 | 1181.7 | 688 | 667 | 166.5 |
| D | 5 | 233 | 15368 | 88.28 | 688 | 667 | 166.5 |
| D | 2 | 107 | 14159 | 81.02 | 688 | 667 | 166.5 |
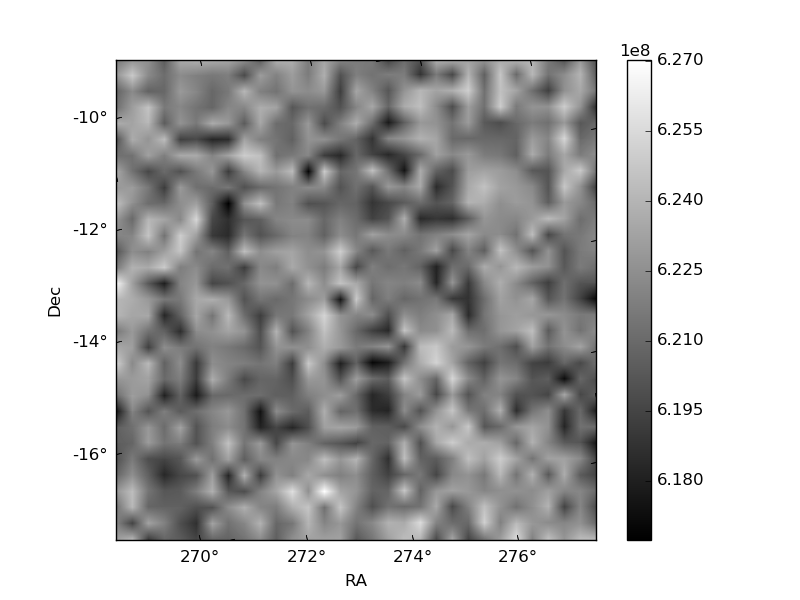
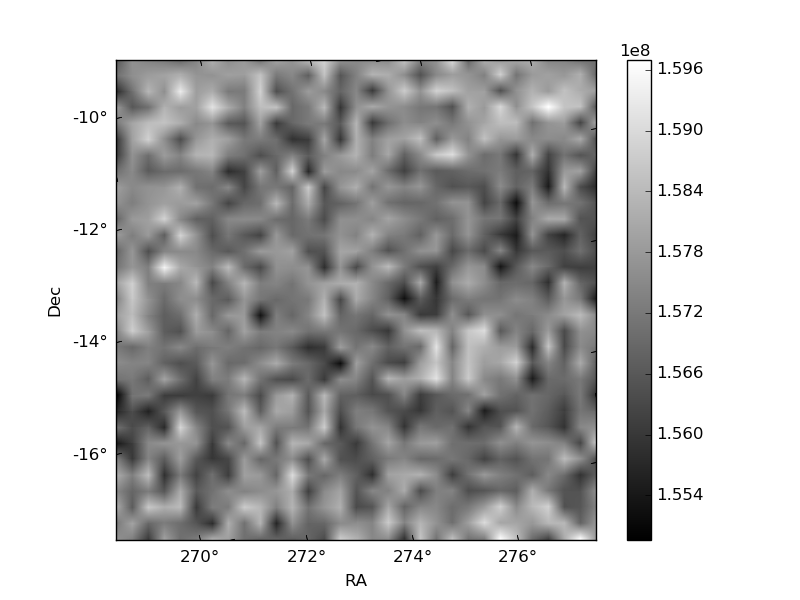
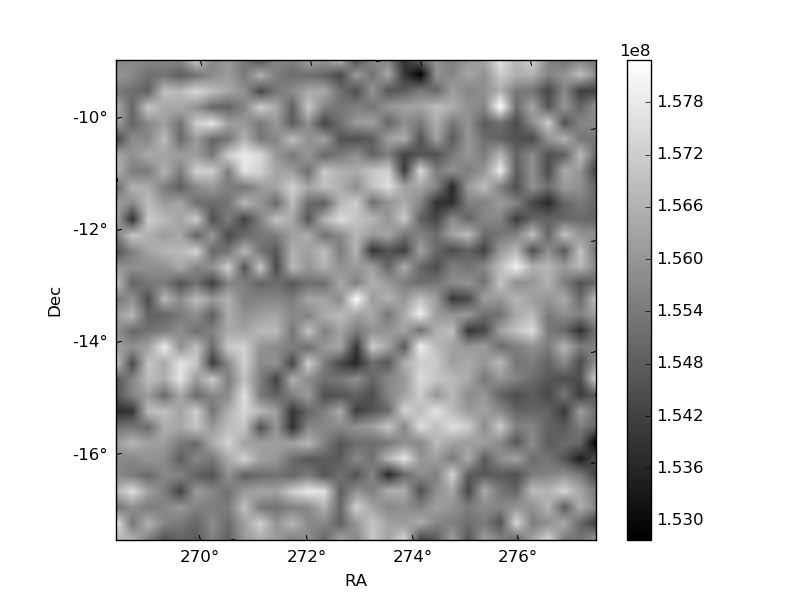
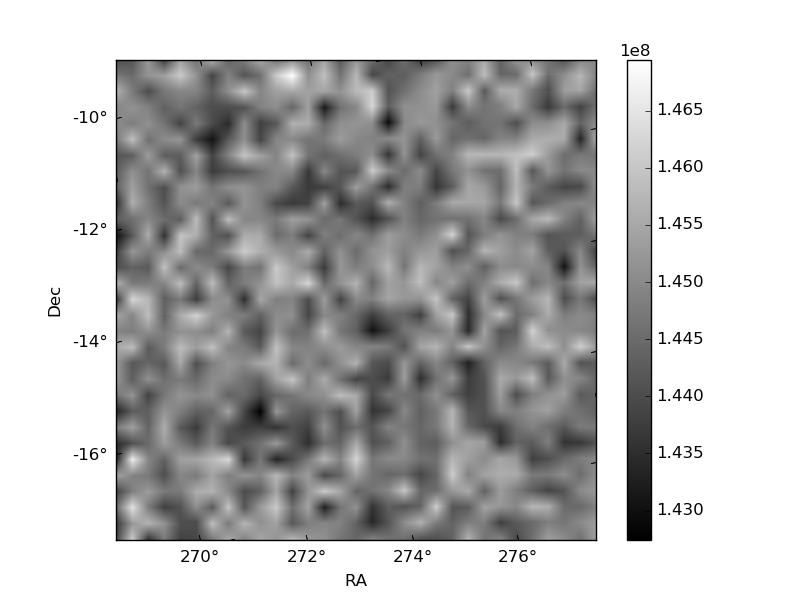
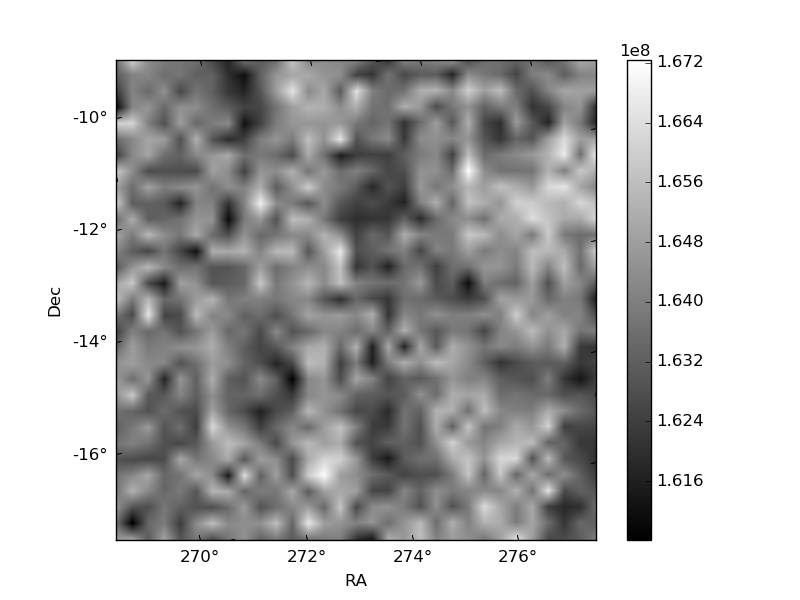
Histogram calculated using DETX and DETY for each event in the final _common_clean file
| Quadrant A | 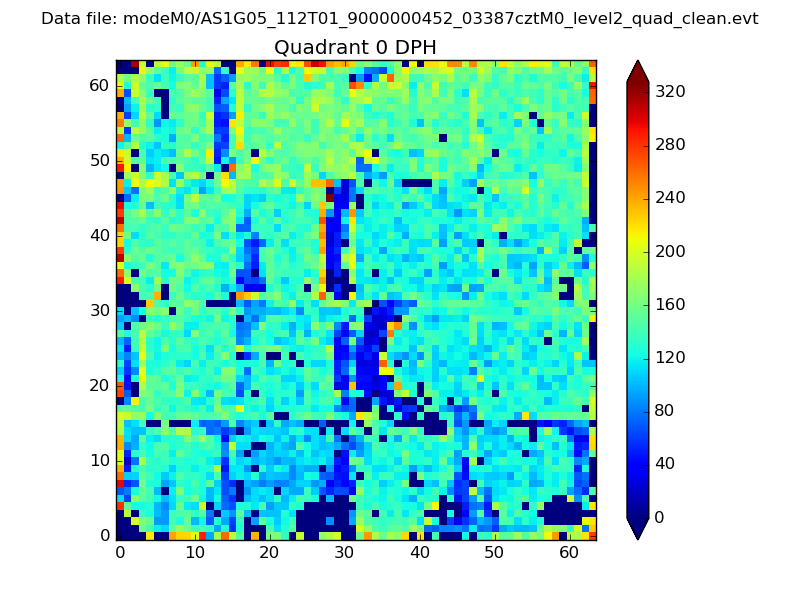 |
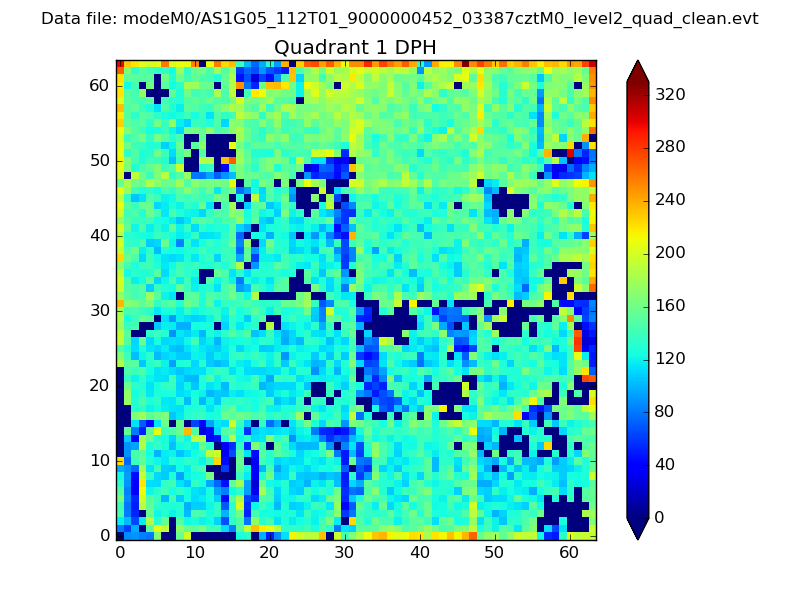 |
Quadrant B |
|---|---|---|---|
| Quadrant D | 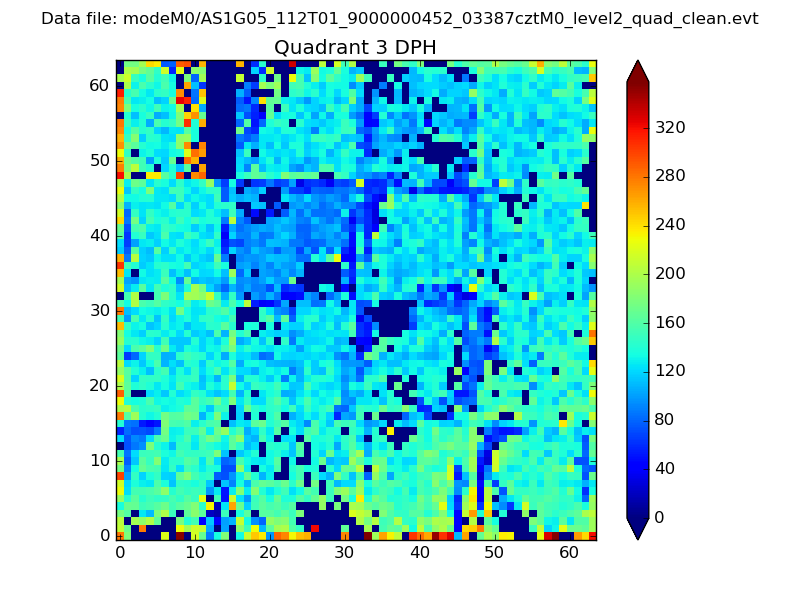 |
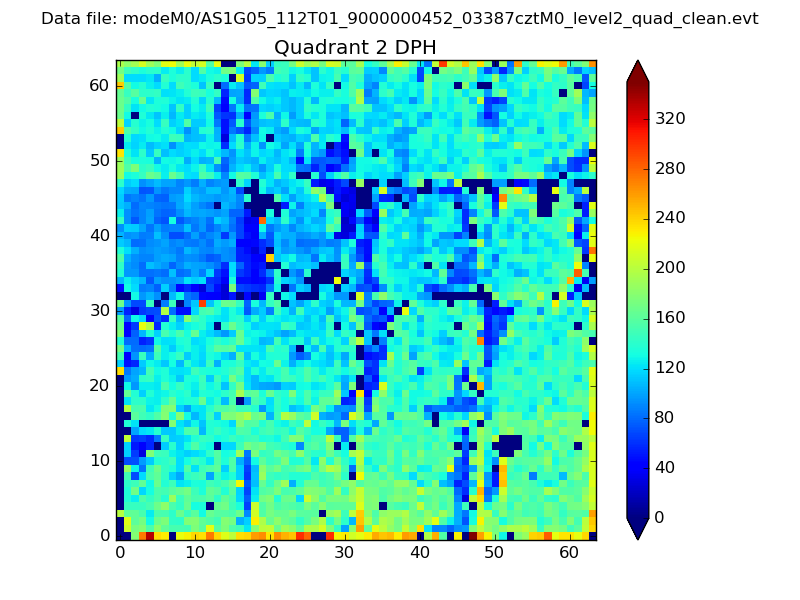 |
Quadrant C |
| Plot type | Count rate plots | Images |
|---|---|---|
| Comparison with Poisson distribution Blue bars denote a histogram of data divided into 1 sec bins. Red curve is a Poisson curve with rate = median count rate of data. |
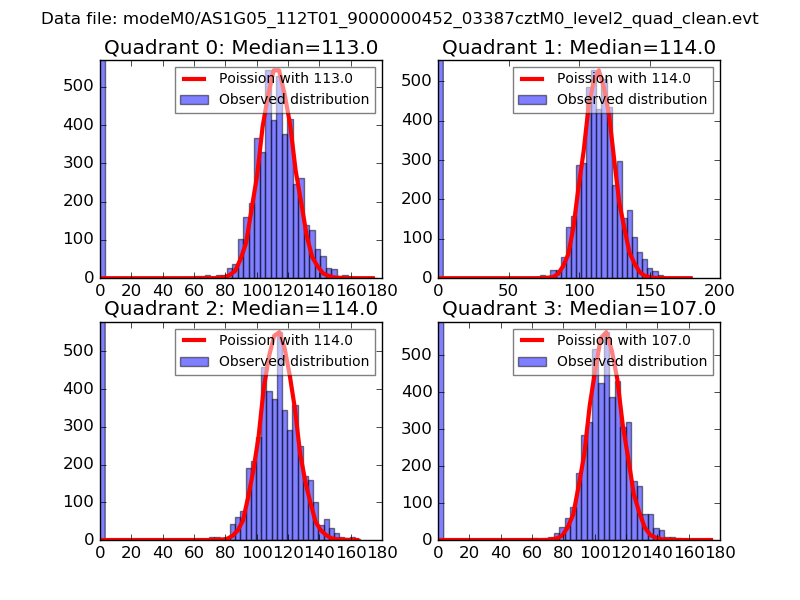 |
 |
| Quadrant-wise count rates Data is divided into 100 sec bins |
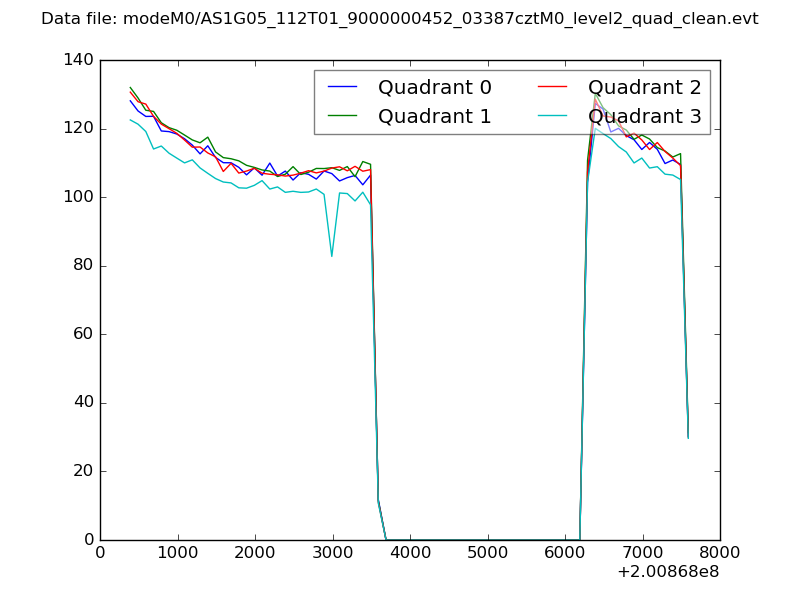 |
|
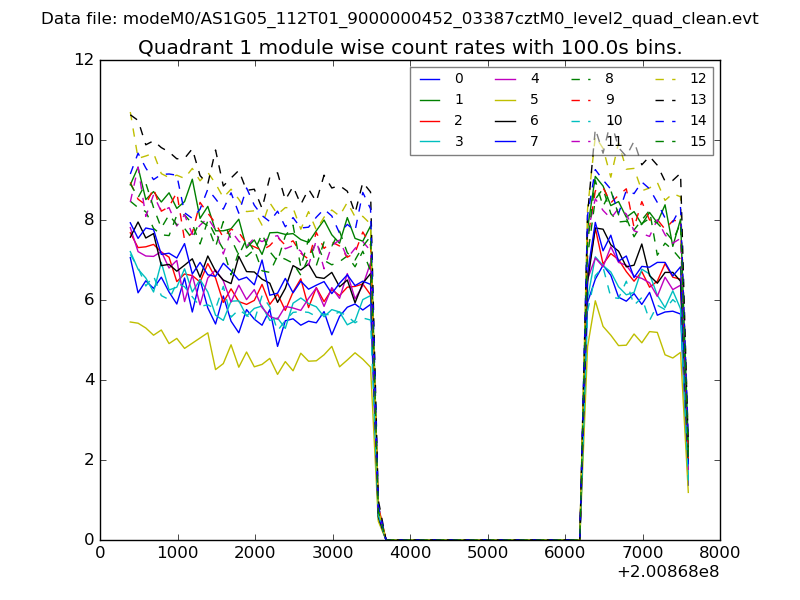
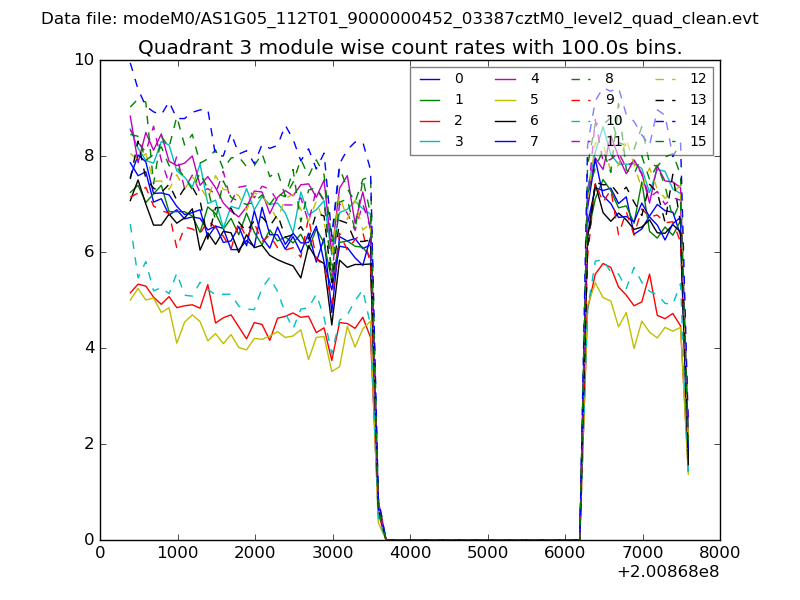
| Module-wise count rates for Quadrant A Data is divided into 100 sec bins |
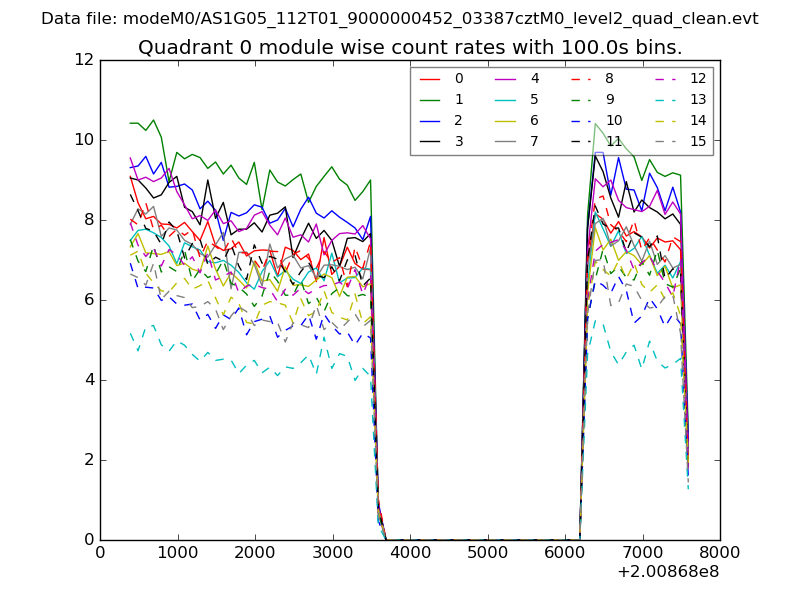 |
 |
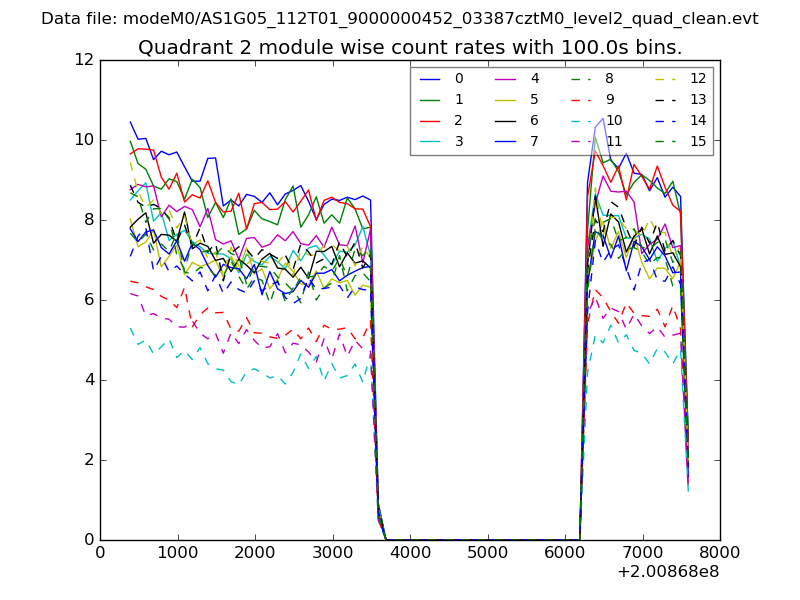
| Module-wise count rates for Quadrant B Data is divided into 100 sec bins |
 |
 |
| Module-wise count rates for Quadrant C Data is divided into 100 sec bins |
 |
 |
| Module-wise count rates for Quadrant D Data is divided into 100 sec bins |
 |
 |
| Parameter | Plot |
|---|---|
| CZT HV Monitor | 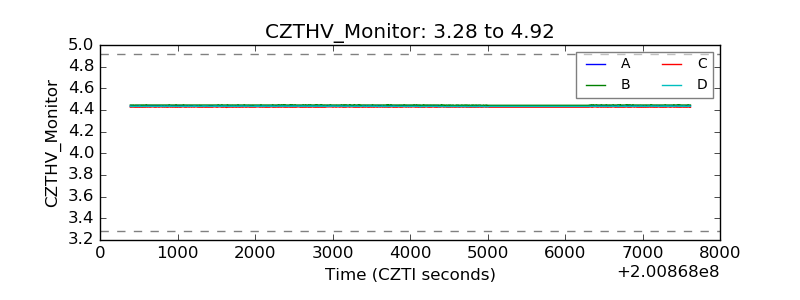 |
| D_VDD | 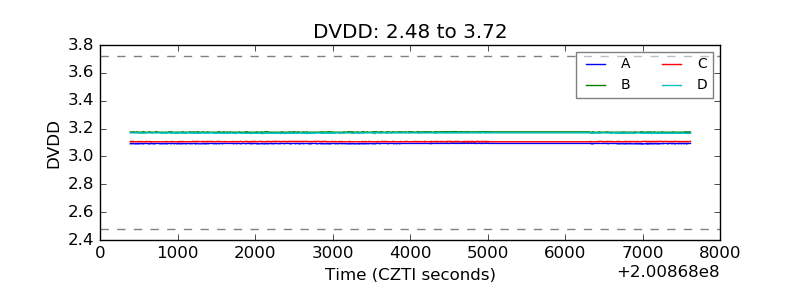 |
| Temperature 1 | 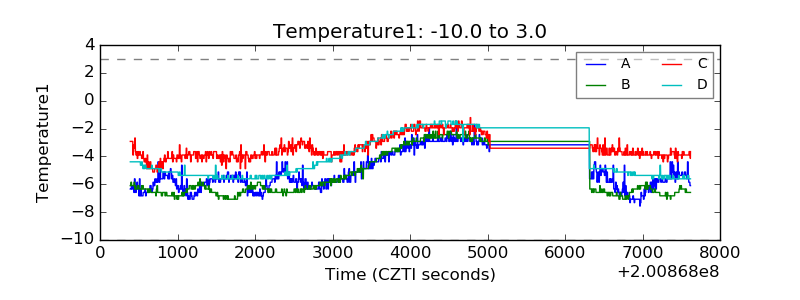 |
| Veto HV Monitor | 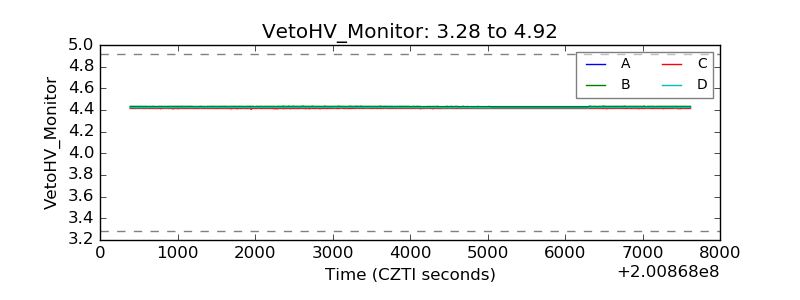 |
| Veto LLD | 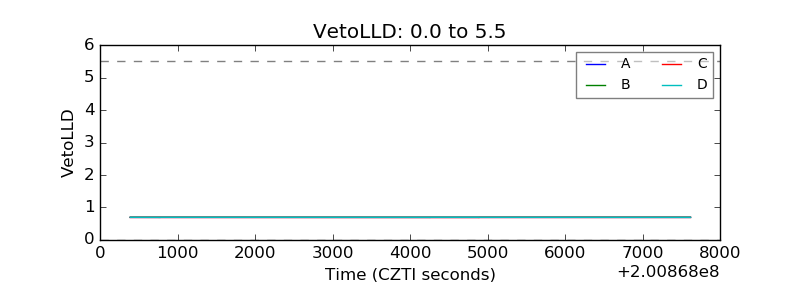 |
| Alpha Counter | 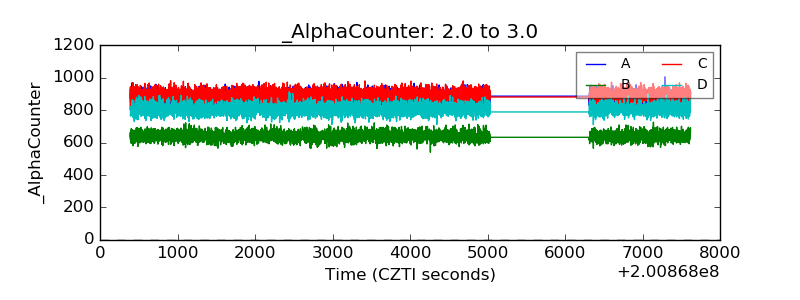 |
| _CPM_Rate | 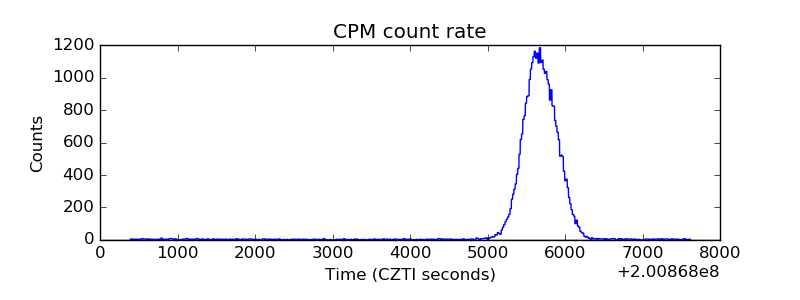 |
| CZT Counter | 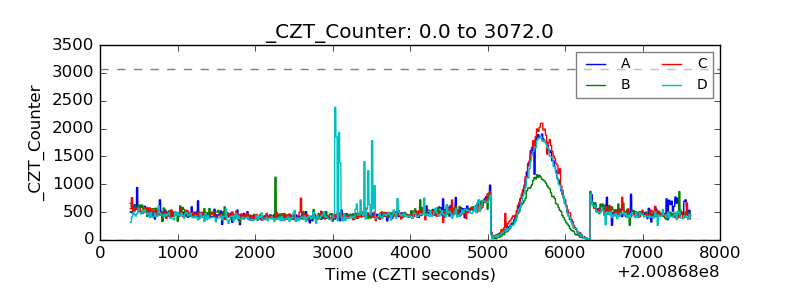 |
| +2.5 Volts monitor | 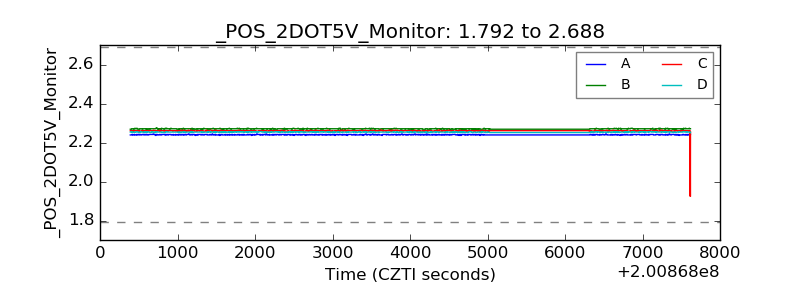 |
| +5 Volts monitor | 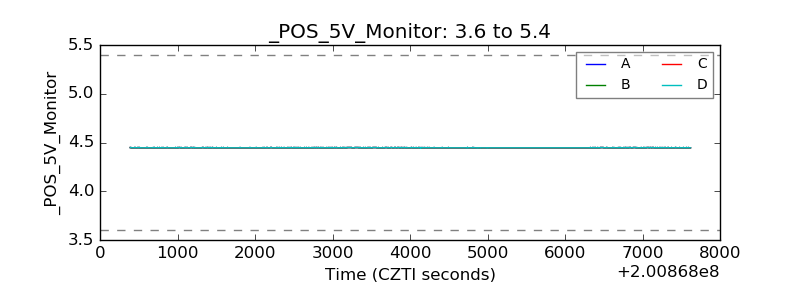 |
| _ROLL_ROT | 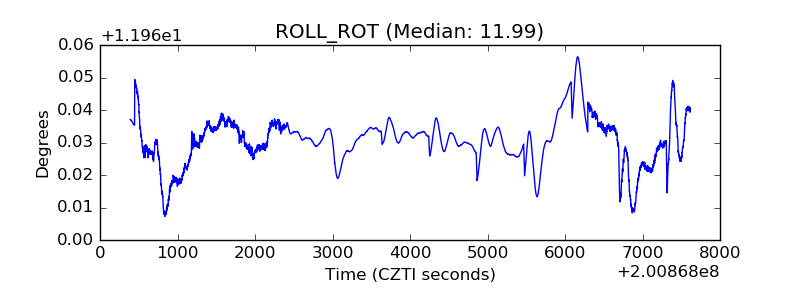 |
| _Roll_DEC | 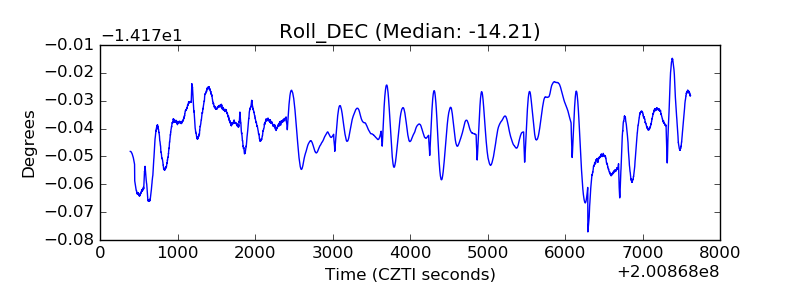 |
| _Roll_RA | 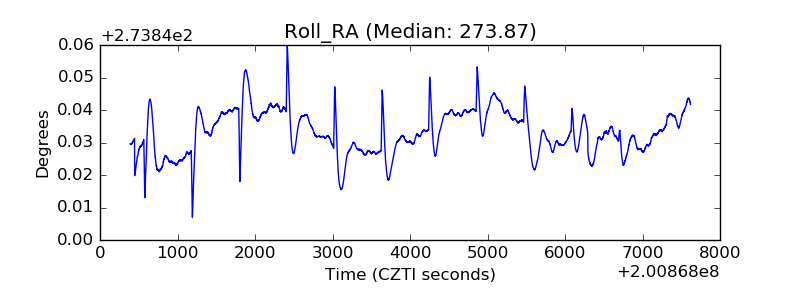 |
| Veto Counter | 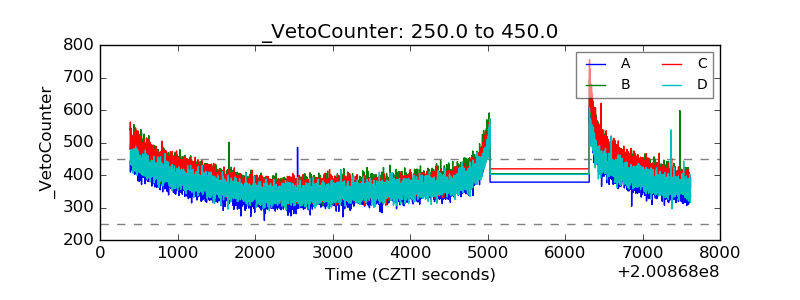 |