| Param | Original file | Final file |
|---|---|---|
| Filename | modeM0/AS1G05_112T01_9000000452_03388cztM0_level2.evt | modeM0/AS1G05_112T01_9000000452_03388cztM0_level2_quad_clean.evt |
| Size (bytes) | 443,263,680 | 80,314,560 |
| Size | 422.7 MB | 76.6 MB |
| Events in quadrant A | 3,778,973 | 495,896 |
| Events in quadrant B | 3,183,634 | 506,956 |
| Events in quadrant C | 3,092,635 | 501,578 |
| Events in quadrant D | 2,931,090 | 478,157 |
| Mode M9 | |||
|---|---|---|---|
| Quadrant | BADHDUFLAG | Total packets | Discarded packets |
| A | 0 | 15 | 0 |
| B | 0 | 15 | 0 |
| C | 0 | 15 | 0 |
| D | 0 | 16 | 0 |
| Mode SS | |||
|---|---|---|---|
| Quadrant | BADHDUFLAG | Total packets | Discarded packets |
| A | 0 | 128 | 0 |
| B | 0 | 128 | 0 |
| C | 0 | 128 | 0 |
| D | 0 | 128 | 0 |
| Mode M0 | |||
|---|---|---|---|
| Quadrant | BADHDUFLAG | Total packets | Discarded packets |
| A | 0 | 15480 | 3 |
| B | 0 | 13706 | 2 |
| C | 0 | 13574 | 2 |
| D | 0 | 13468 | 2 |
| Quadrant | Total seconds | Saturated seconds | Saturation percentage |
|---|---|---|---|
| A | 6452 | 57 | 0.883447% |
| B | 6452 | 56 | 0.867948% |
| C | 6452 | 32 | 0.495970% |
| D | 6452 | 27 | 0.418475% |
Noise dominated data is calculated using 1-second bins in cleaned event files. If a bin has >2000 counts, and if more than 50% of those come from <1% of pixels, then it is considered to be noise-dominated and hence unusable.
| Quadrant | # 1 sec bins | Bins with >0 counts | Bins with >2000 counts | High rate bins dominated by noise | Noise dominated (total time) | Noise dominated (detector-on time) | Marked lightcurve |
|---|---|---|---|---|---|---|---|
| A | 7587 | 6453 | 15 | 15 | 0.20% | 0.23% | 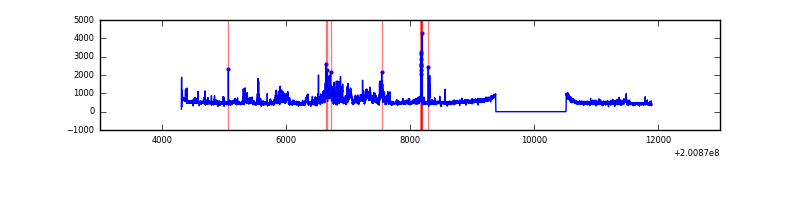 |
| B | 7587 | 6453 | 2 | 2 | 0.03% | 0.03% | 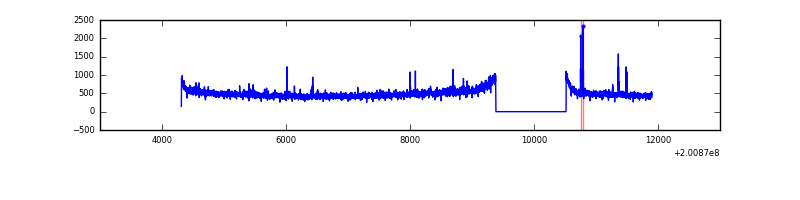 |
| C | 7587 | 6453 | 4 | 4 | 0.05% | 0.06% |  |
| D | 7587 | 6453 | 8 | 8 | 0.11% | 0.12% | 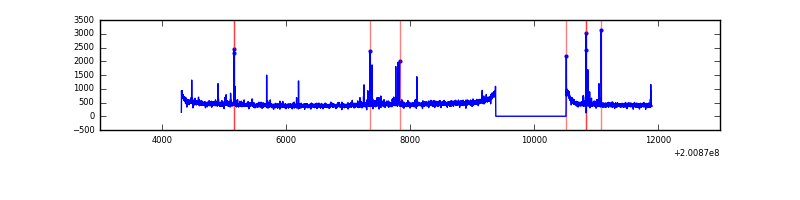 |
Top three noisy pixels from each quadrant. If the there are fewer than three noisy pixels in the level2.evt file, extra rows are filled as -1
| Pixel properties | Quadrant properties | ||||||
|---|---|---|---|---|---|---|---|
| Quadrant | DetID | PixID | Counts | Sigma | Mean | Median | Sigma |
| A | 0 | 31 | 662092 | 4201.36 | 765 | 749 | 157.4 |
| A | 0 | 118 | 83364 | 524.83 | 765 | 749 | 157.4 |
| A | 8 | 15 | 74425 | 468.05 | 765 | 749 | 157.4 |
| B | 15 | 204 | 79760 | 521.44 | 785 | 768 | 151.5 |
| B | 0 | 229 | 30084 | 193.52 | 785 | 768 | 151.5 |
| B | 2 | 249 | 19696 | 124.95 | 785 | 768 | 151.5 |
| C | 9 | 144 | 65860 | 364.61 | 758 | 762 | 178.5 |
| C | 1 | 16 | 29597 | 161.5 | 758 | 762 | 178.5 |
| C | 1 | 192 | 19765 | 106.43 | 758 | 762 | 178.5 |
| D | 13 | 223 | 35238 | 190.5 | 746 | 726 | 181.2 |
| D | 13 | 239 | 29255 | 157.47 | 746 | 726 | 181.2 |
| D | 2 | 206 | 18420 | 97.67 | 746 | 726 | 181.2 |
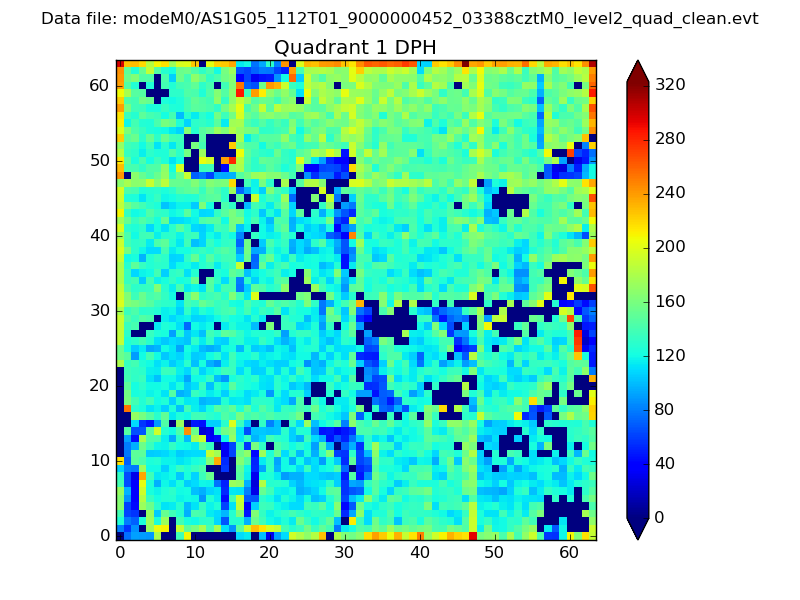
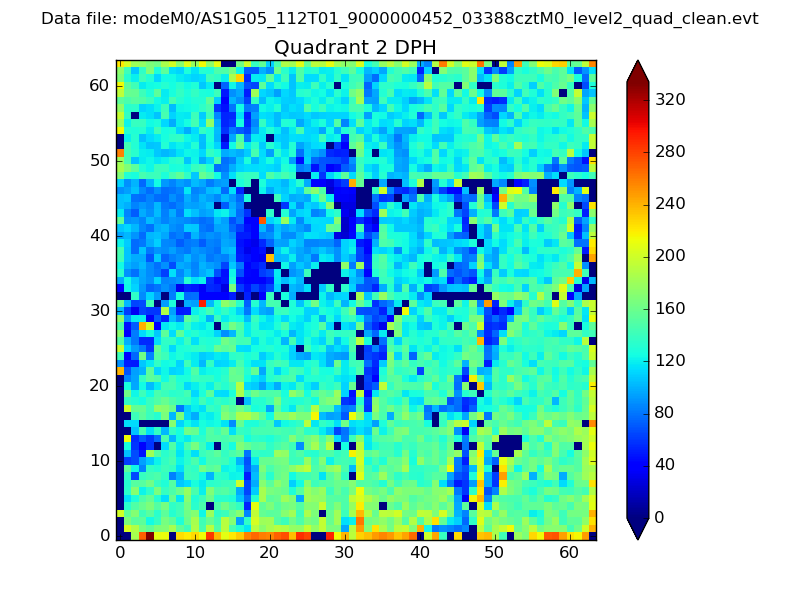
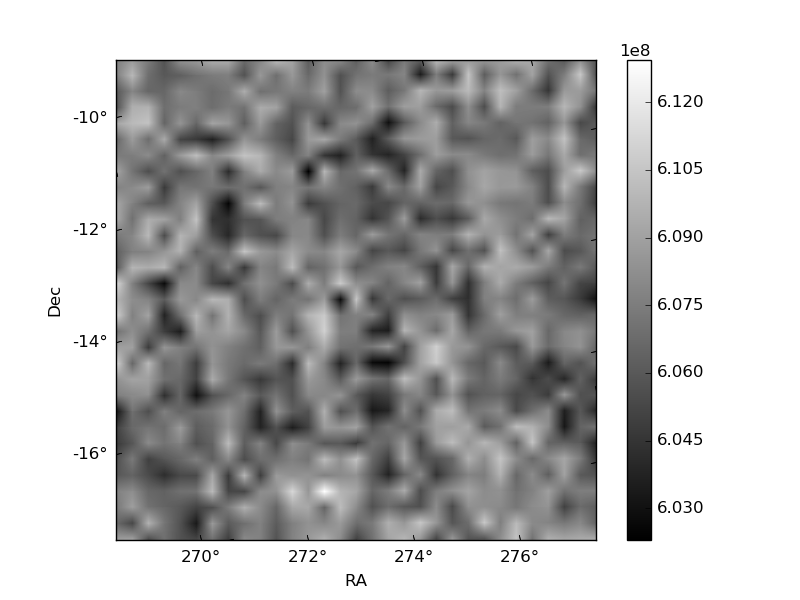
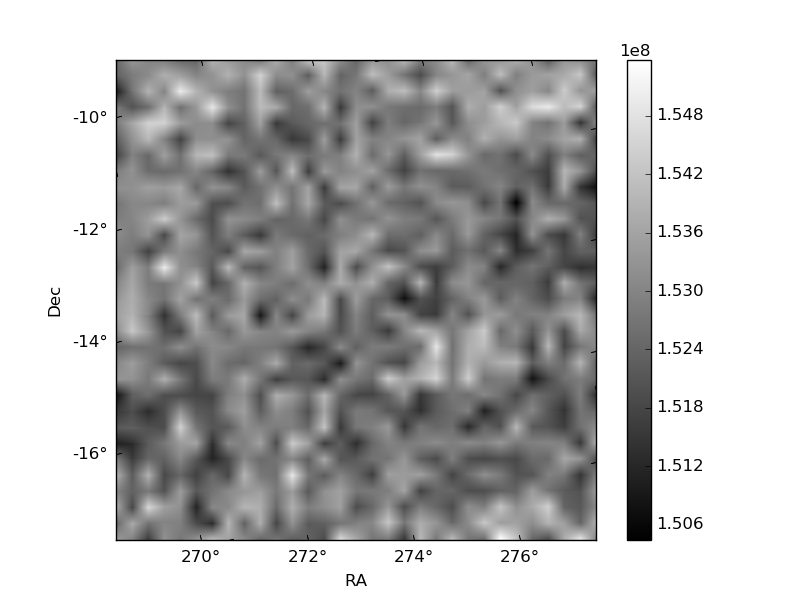
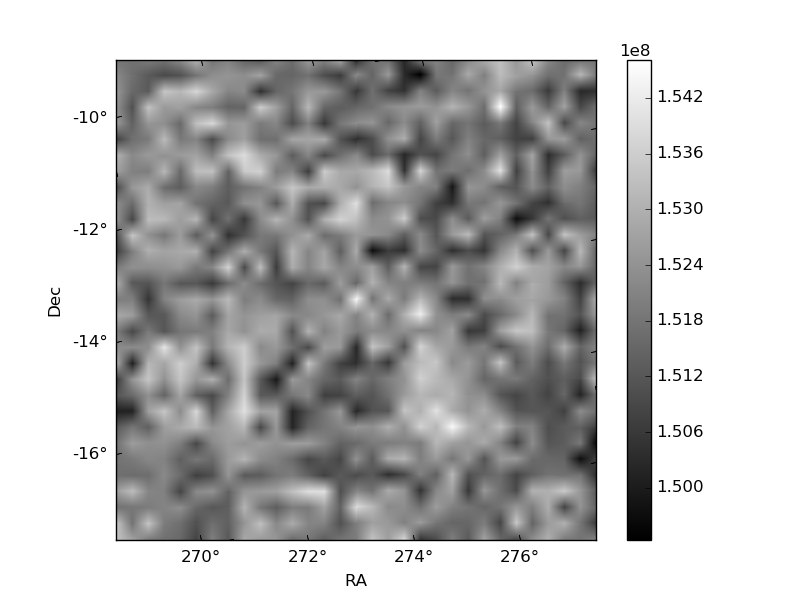
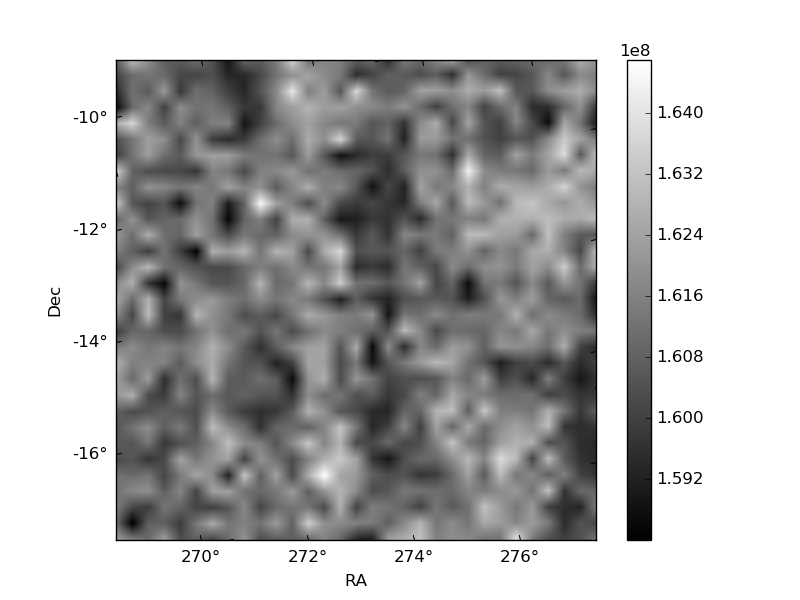
Histogram calculated using DETX and DETY for each event in the final _common_clean file
| Quadrant A | 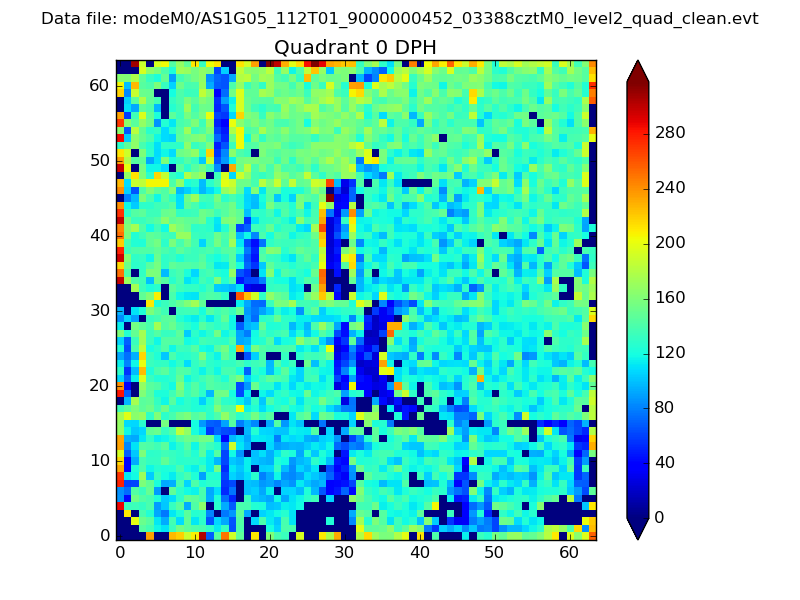 |
 |
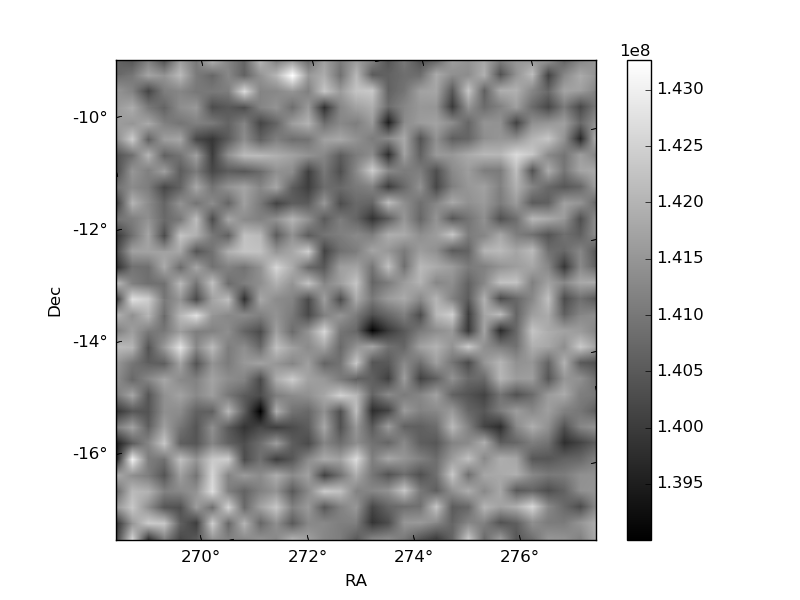
Quadrant B |
|---|---|---|---|
| Quadrant D | 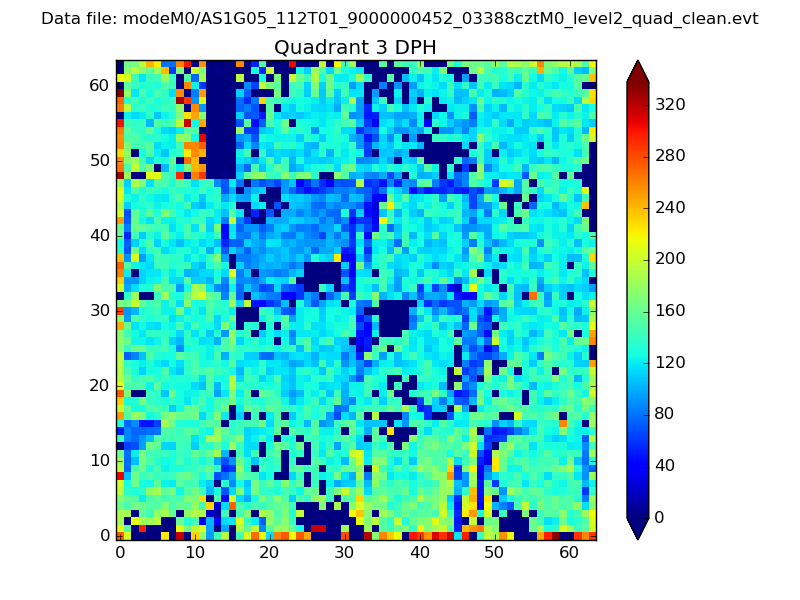 |
 |
Quadrant C |
| Plot type | Count rate plots | Images |
|---|---|---|
| Comparison with Poisson distribution Blue bars denote a histogram of data divided into 1 sec bins. Red curve is a Poisson curve with rate = median count rate of data. |
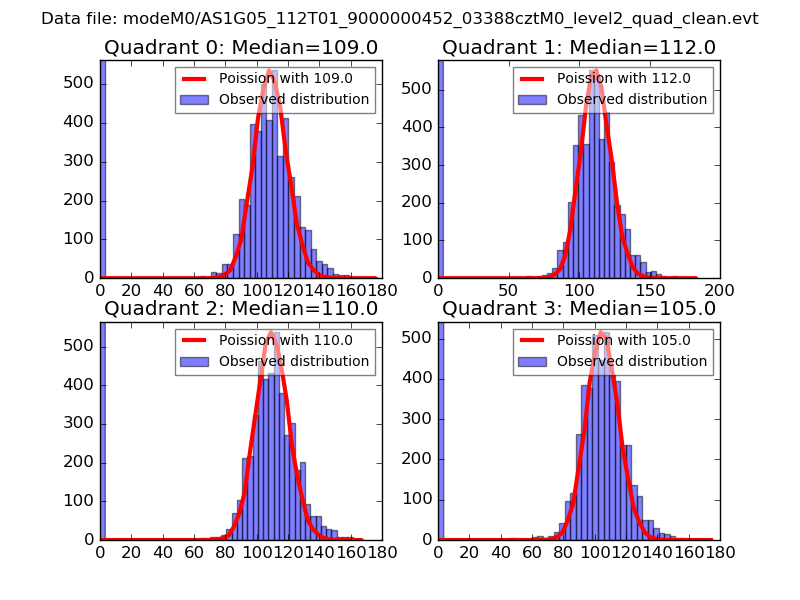 |
 |
| Quadrant-wise count rates Data is divided into 100 sec bins |
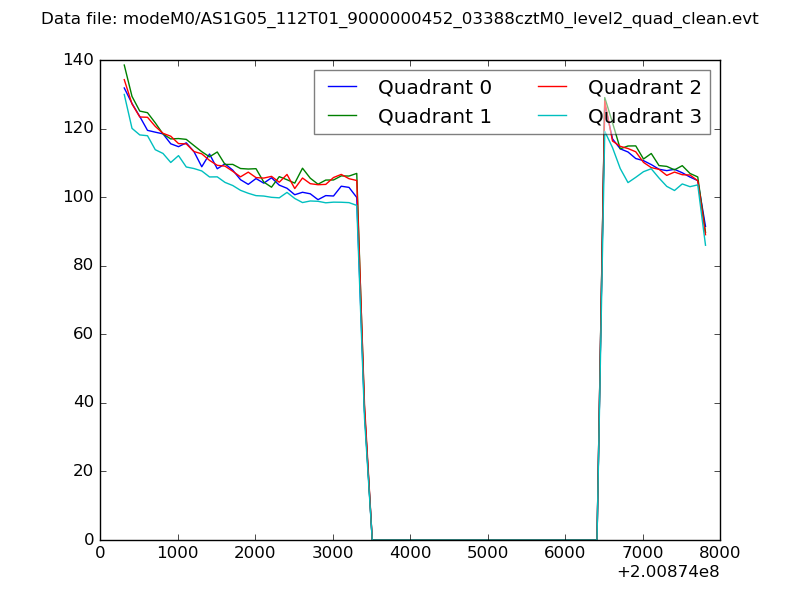 |
|
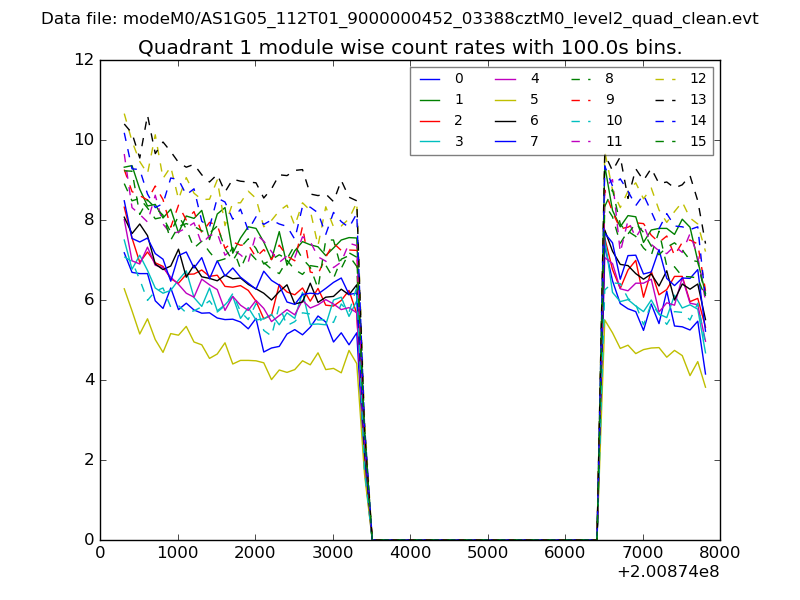
| Module-wise count rates for Quadrant A Data is divided into 100 sec bins |
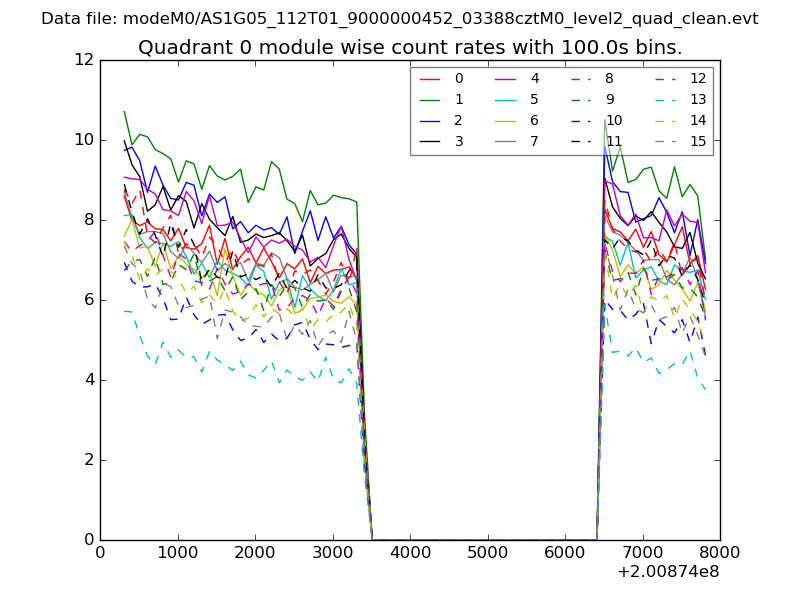 |
 |
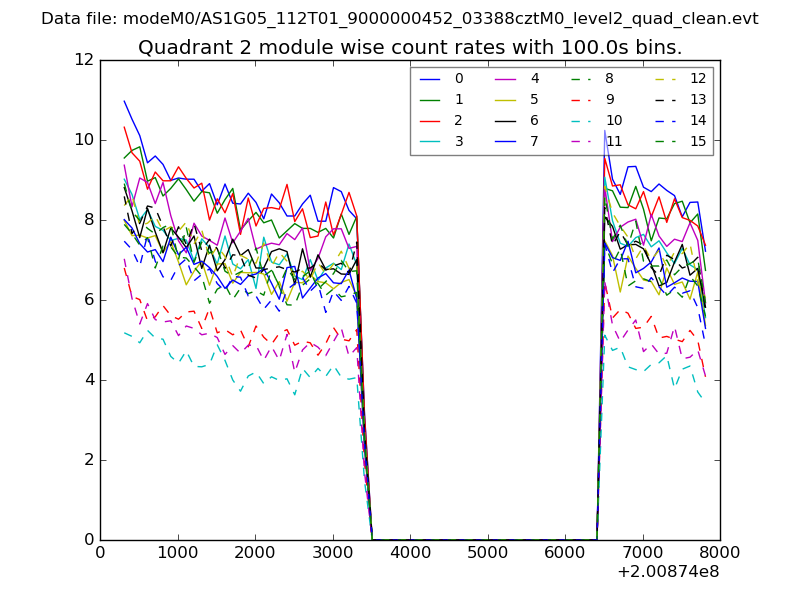
| Module-wise count rates for Quadrant B Data is divided into 100 sec bins |
 |
 |
| Module-wise count rates for Quadrant C Data is divided into 100 sec bins |
 |
 |
| Module-wise count rates for Quadrant D Data is divided into 100 sec bins |
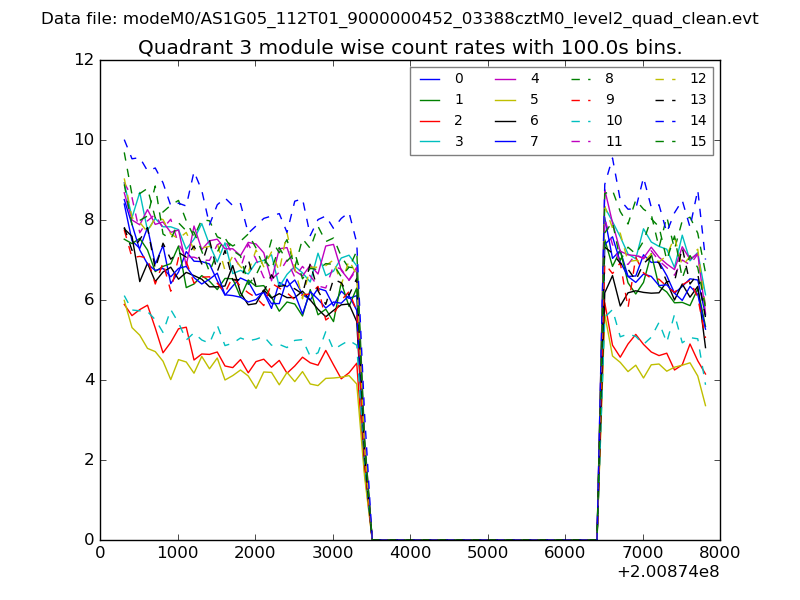 |
 |
| Parameter | Plot |
|---|---|
| CZT HV Monitor | 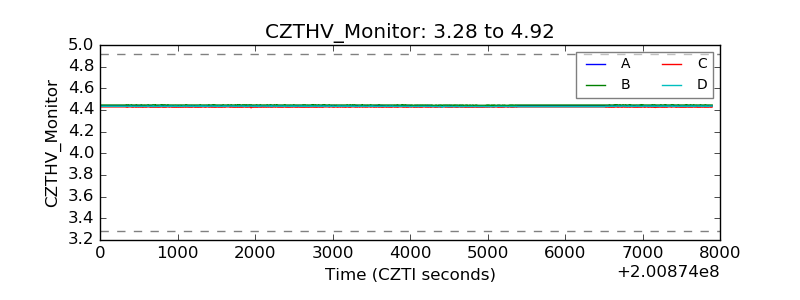 |
| D_VDD | 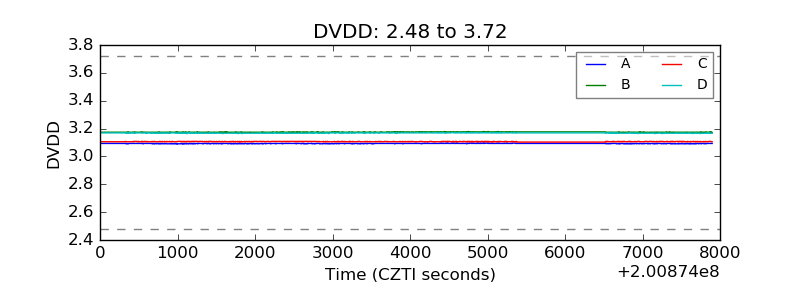 |
| Temperature 1 | 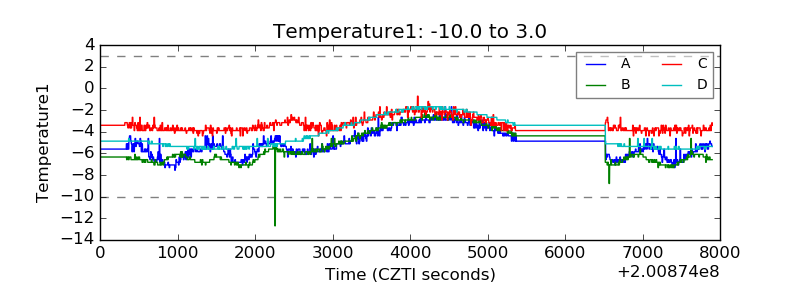 |
| Veto HV Monitor | 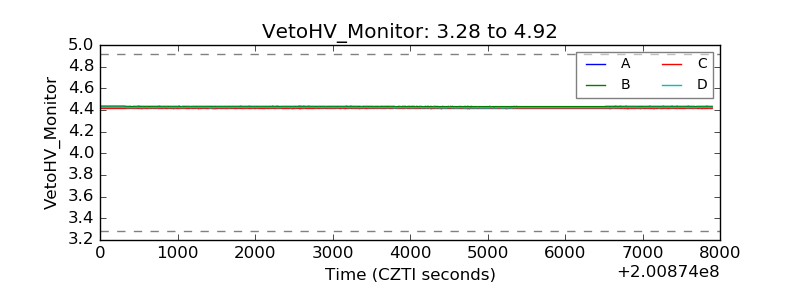 |
| Veto LLD | 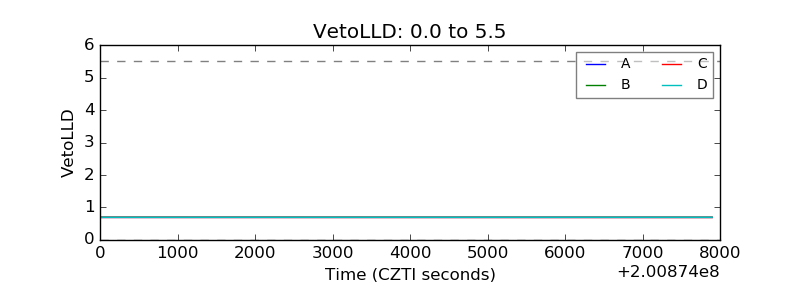 |
| Alpha Counter | 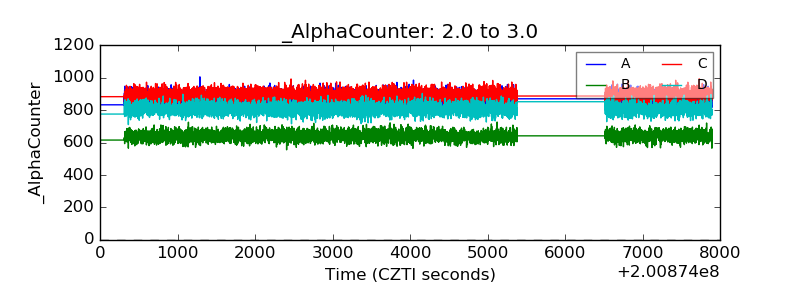 |
| _CPM_Rate | 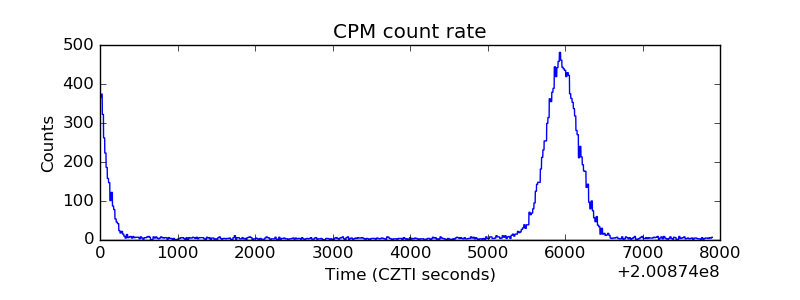 |
| CZT Counter | 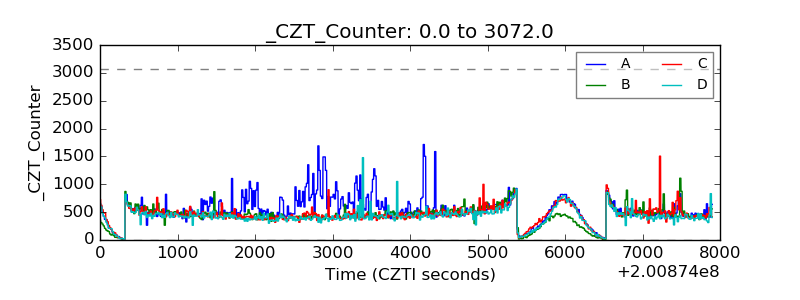 |
| +2.5 Volts monitor | 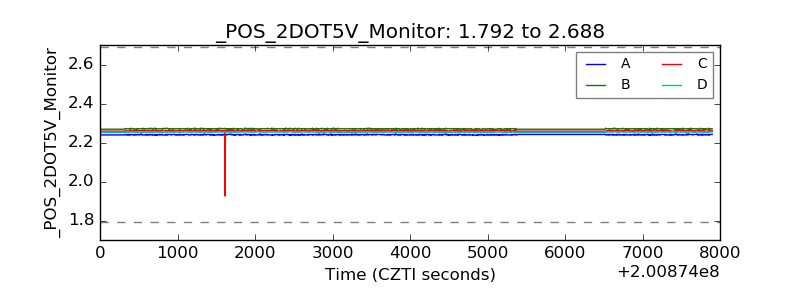 |
| +5 Volts monitor |  |
| _ROLL_ROT | 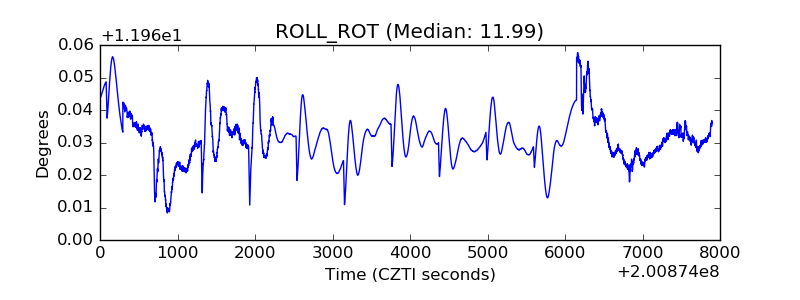 |
| _Roll_DEC | 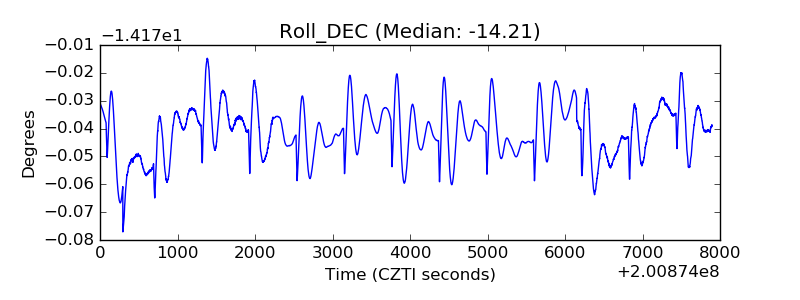 |
| _Roll_RA | 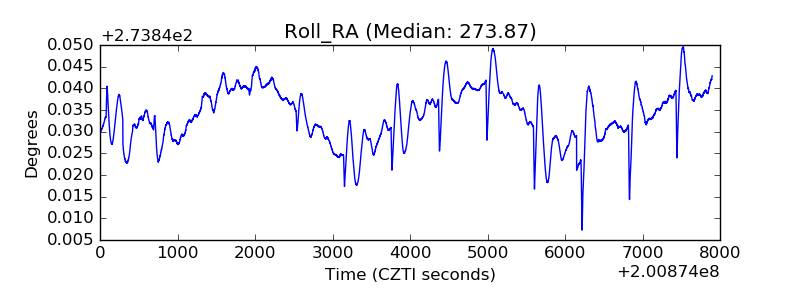 |
| Veto Counter | 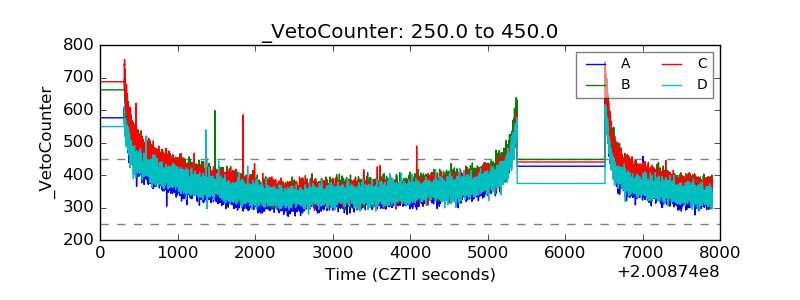 |