| Param | Original file | Final file |
|---|---|---|
| Filename | modeM0/AS1G05_112T01_9000000452_03389cztM0_level2.evt | modeM0/AS1G05_112T01_9000000452_03389cztM0_level2_quad_clean.evt |
| Size (bytes) | 417,695,040 | 73,425,600 |
| Size | 398.3 MB | 70.0 MB |
| Events in quadrant A | 3,126,152 | 444,644 |
| Events in quadrant B | 3,165,878 | 449,552 |
| Events in quadrant C | 3,045,212 | 447,864 |
| Events in quadrant D | 2,872,986 | 430,504 |
| Mode M9 | |||
|---|---|---|---|
| Quadrant | BADHDUFLAG | Total packets | Discarded packets |
| A | 0 | 9 | 0 |
| B | 0 | 9 | 0 |
| C | 0 | 9 | 0 |
| D | 0 | 9 | 0 |
| Mode SS | |||
|---|---|---|---|
| Quadrant | BADHDUFLAG | Total packets | Discarded packets |
| A | 0 | 132 | 0 |
| B | 0 | 132 | 0 |
| C | 0 | 132 | 0 |
| D | 0 | 132 | 0 |
| Mode M0 | |||
|---|---|---|---|
| Quadrant | BADHDUFLAG | Total packets | Discarded packets |
| A | 0 | 13703 | 2 |
| B | 0 | 13674 | 1 |
| C | 0 | 13477 | 1 |
| D | 0 | 13446 | 1 |
| Quadrant | Total seconds | Saturated seconds | Saturation percentage |
|---|---|---|---|
| A | 6459 | 66 | 1.021830% |
| B | 6459 | 67 | 1.037312% |
| C | 6459 | 44 | 0.681220% |
| D | 6459 | 36 | 0.557362% |
Noise dominated data is calculated using 1-second bins in cleaned event files. If a bin has >2000 counts, and if more than 50% of those come from <1% of pixels, then it is considered to be noise-dominated and hence unusable.
| Quadrant | # 1 sec bins | Bins with >0 counts | Bins with >2000 counts | High rate bins dominated by noise | Noise dominated (total time) | Noise dominated (detector-on time) | Marked lightcurve |
|---|---|---|---|---|---|---|---|
| A | 7319 | 6460 | 7 | 7 | 0.10% | 0.11% |  |
| B | 7319 | 6460 | 6 | 6 | 0.08% | 0.09% |  |
| C | 7319 | 6460 | 1 | 1 | 0.01% | 0.02% |  |
| D | 7319 | 6460 | 16 | 16 | 0.22% | 0.25% | 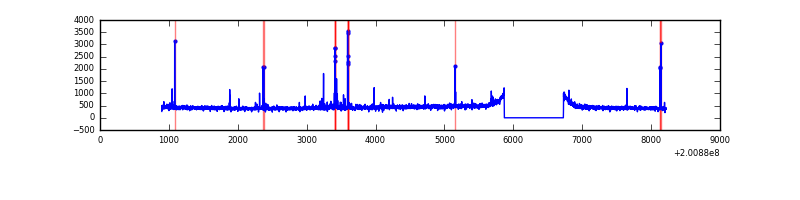 |
Top three noisy pixels from each quadrant. If the there are fewer than three noisy pixels in the level2.evt file, extra rows are filled as -1
| Pixel properties | Quadrant properties | ||||||
|---|---|---|---|---|---|---|---|
| Quadrant | DetID | PixID | Counts | Sigma | Mean | Median | Sigma |
| A | 0 | 118 | 118888 | 763.9 | 750 | 733 | 154.7 |
| A | 8 | 15 | 58711 | 374.84 | 750 | 733 | 154.7 |
| A | 15 | 170 | 47034 | 299.35 | 750 | 733 | 154.7 |
| B | 2 | 249 | 54710 | 366.75 | 762 | 743 | 147.1 |
| B | 15 | 204 | 43008 | 287.22 | 762 | 743 | 147.1 |
| B | 14 | 167 | 37625 | 250.64 | 762 | 743 | 147.1 |
| C | 9 | 144 | 98402 | 562.52 | 738 | 743 | 173.6 |
| C | 14 | 67 | 18920 | 104.7 | 738 | 743 | 173.6 |
| C | 1 | 16 | 16794 | 92.45 | 738 | 743 | 173.6 |
| D | 13 | 223 | 62626 | 348.79 | 733 | 712 | 177.5 |
| D | 2 | 206 | 13648 | 72.87 | 733 | 712 | 177.5 |
| D | 5 | 171 | 10794 | 56.8 | 733 | 712 | 177.5 |
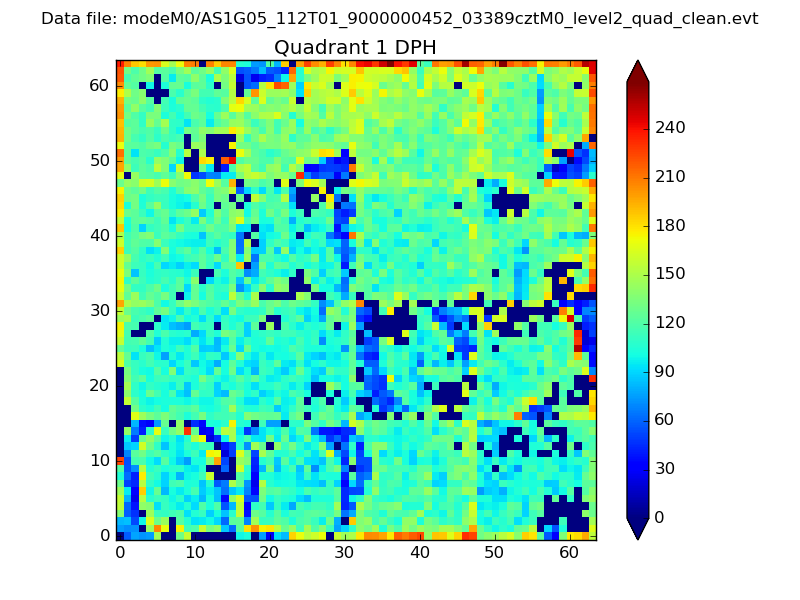
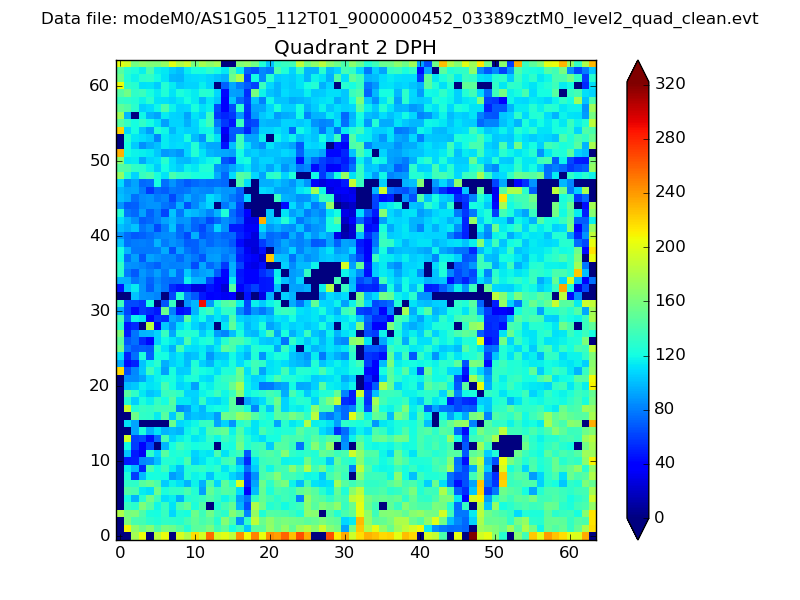
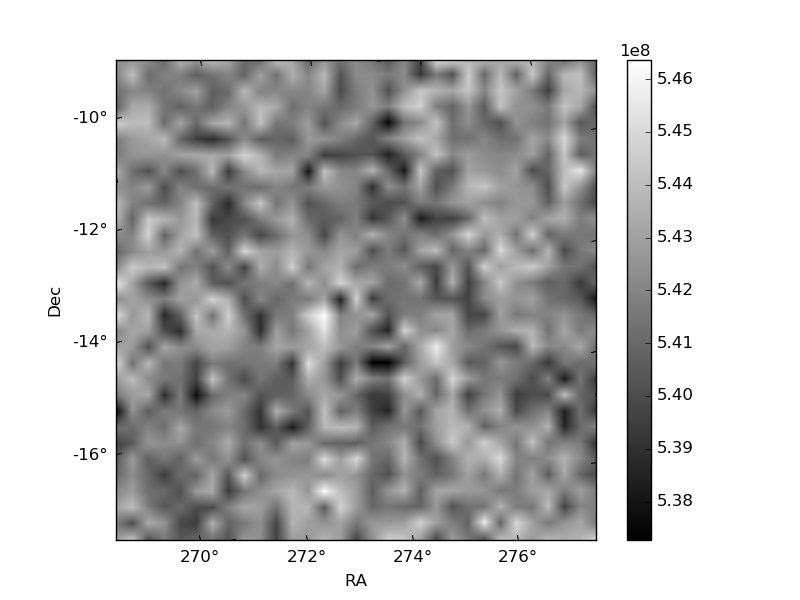
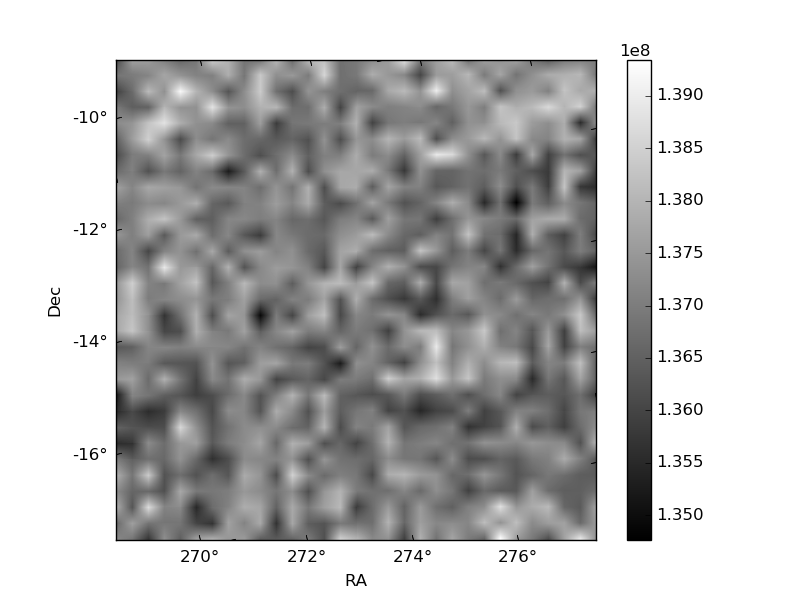
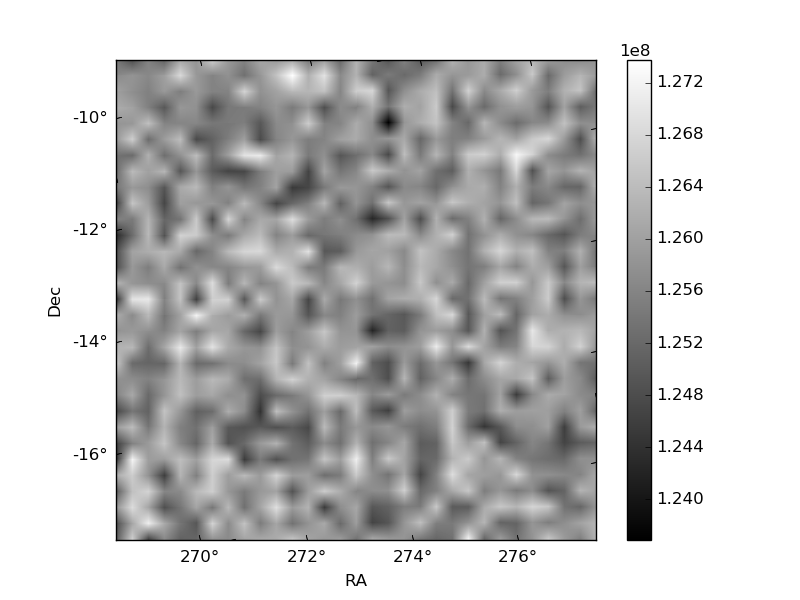
Histogram calculated using DETX and DETY for each event in the final _common_clean file
| Quadrant A |  |
 |
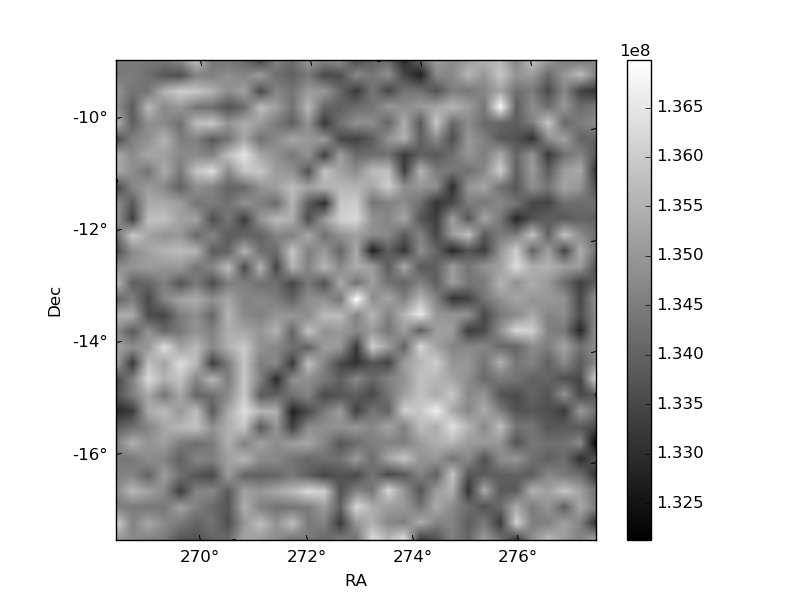
Quadrant B |
|---|---|---|---|
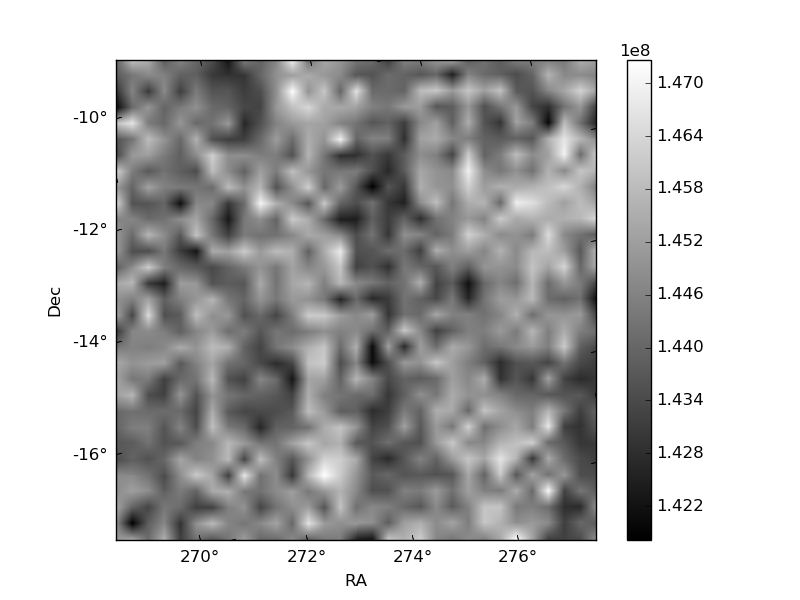
| Quadrant D | 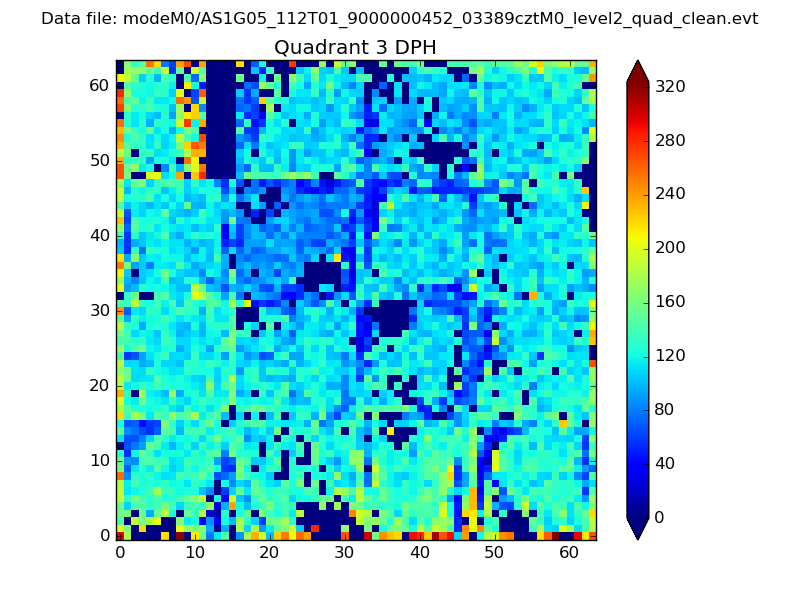 |
 |
Quadrant C |
| Plot type | Count rate plots | Images |
|---|---|---|
| Comparison with Poisson distribution Blue bars denote a histogram of data divided into 1 sec bins. Red curve is a Poisson curve with rate = median count rate of data. |
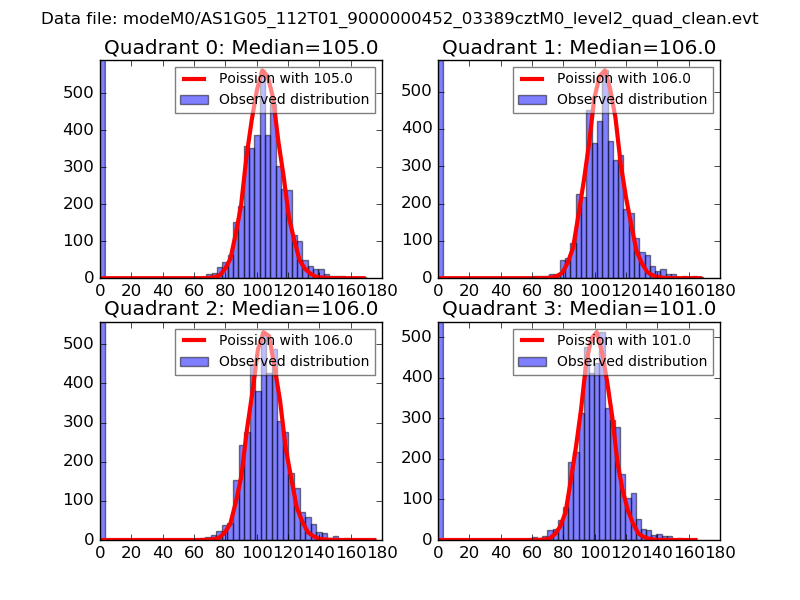 |
 |
| Quadrant-wise count rates Data is divided into 100 sec bins |
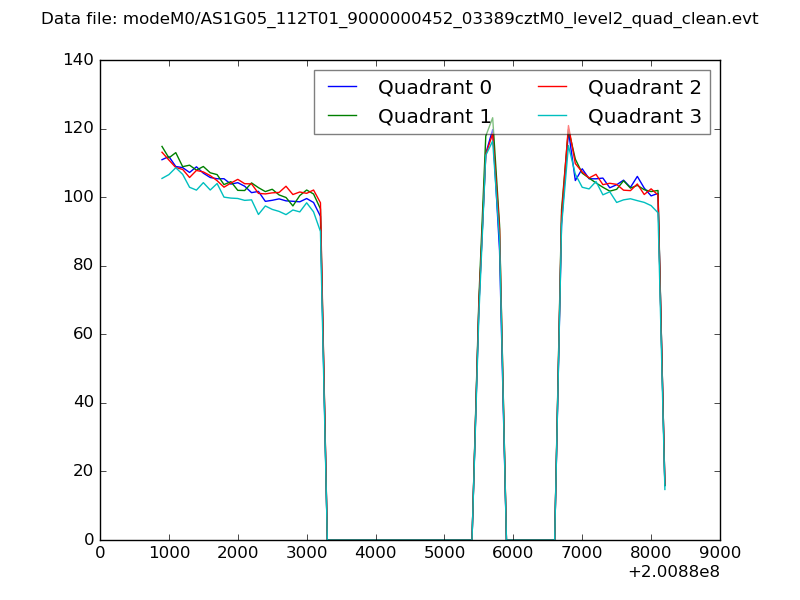 |
|
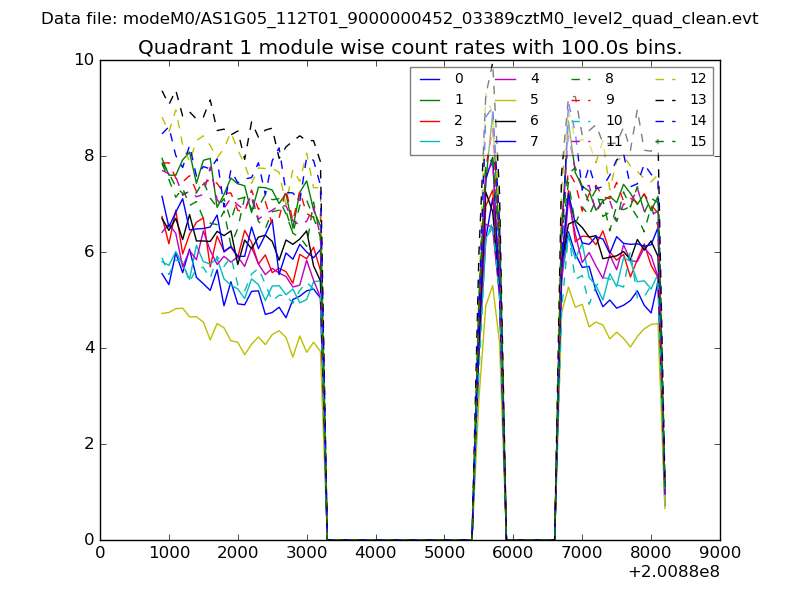
| Module-wise count rates for Quadrant A Data is divided into 100 sec bins |
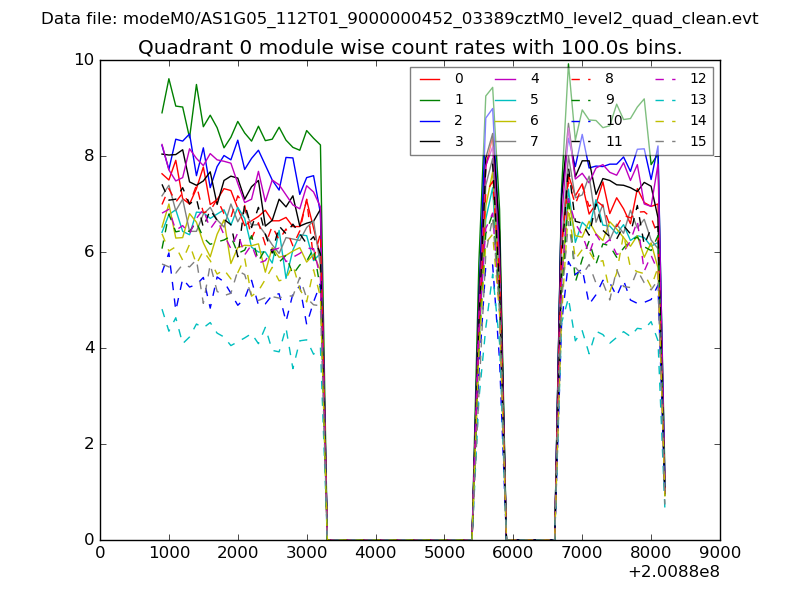 |
 |
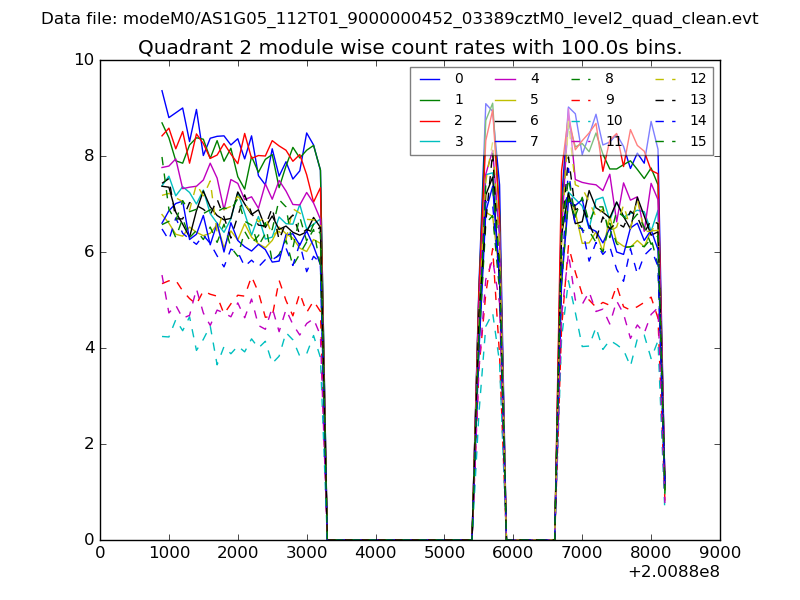
| Module-wise count rates for Quadrant B Data is divided into 100 sec bins |
 |
 |
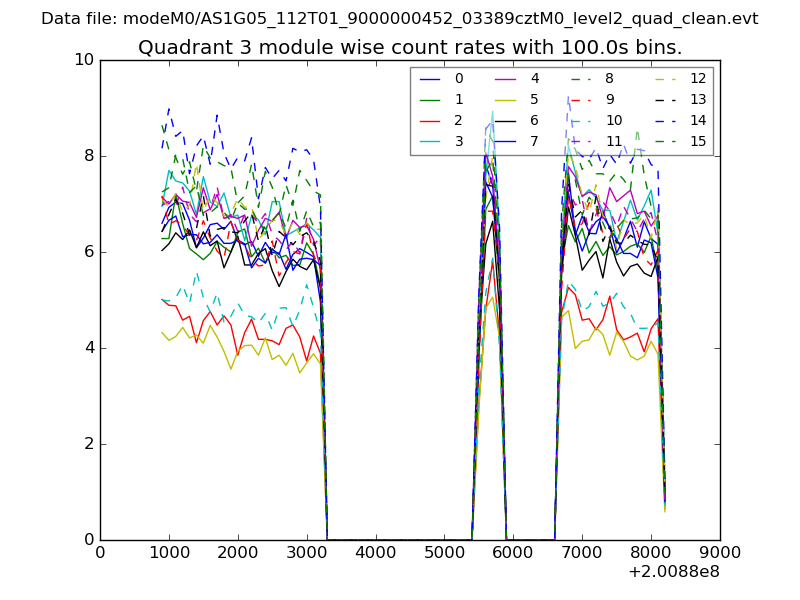
| Module-wise count rates for Quadrant C Data is divided into 100 sec bins |
 |
 |
| Module-wise count rates for Quadrant D Data is divided into 100 sec bins |
 |
 |
| Parameter | Plot |
|---|---|
| CZT HV Monitor | 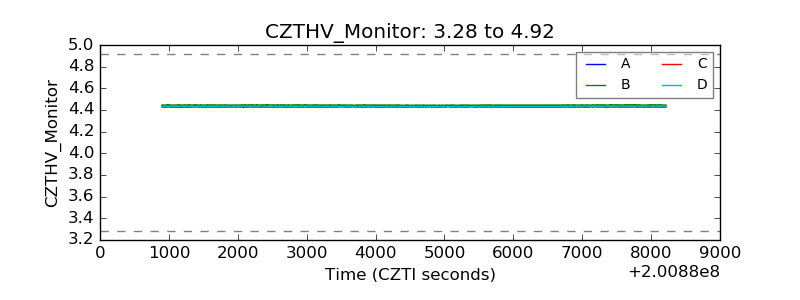 |
| D_VDD | 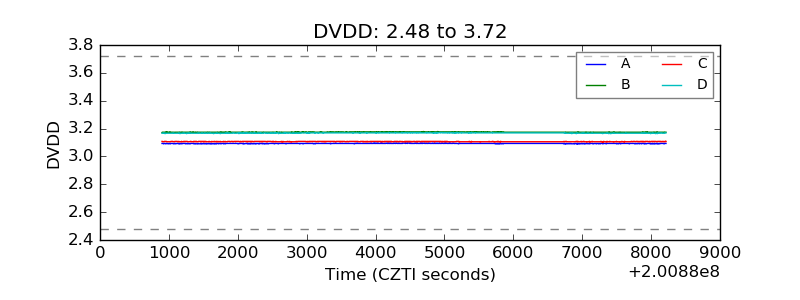 |
| Temperature 1 | 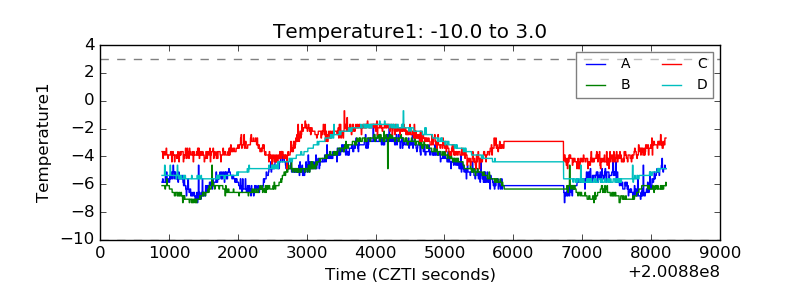 |
| Veto HV Monitor | 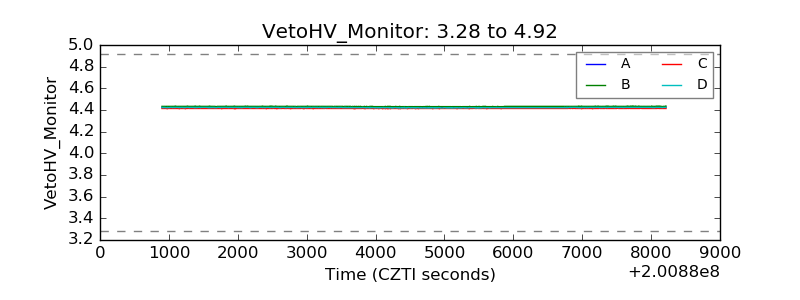 |
| Veto LLD | 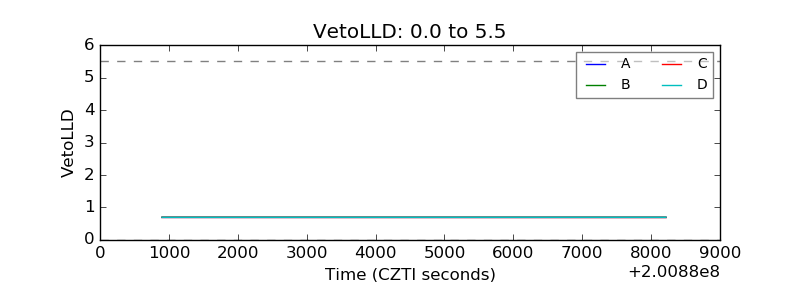 |
| Alpha Counter | 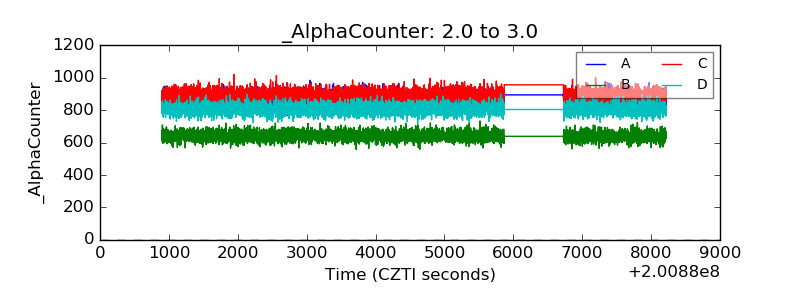 |
| _CPM_Rate | 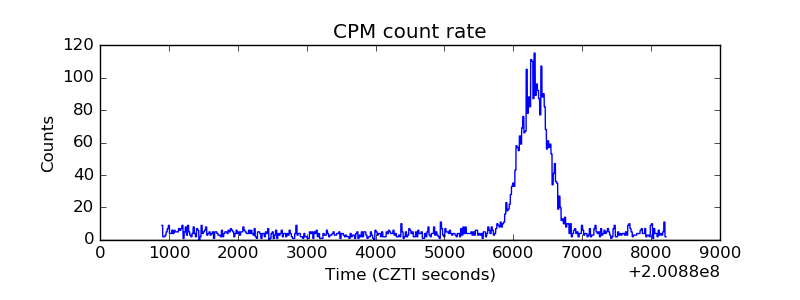 |
| CZT Counter | 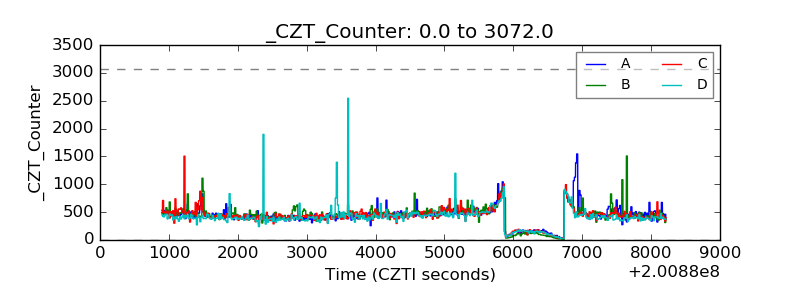 |
| +2.5 Volts monitor | 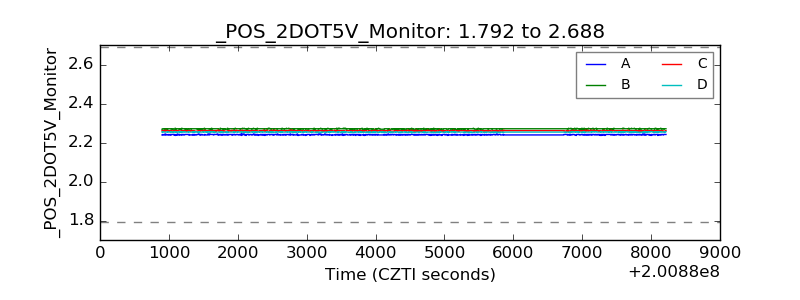 |
| +5 Volts monitor |  |
| _ROLL_ROT | 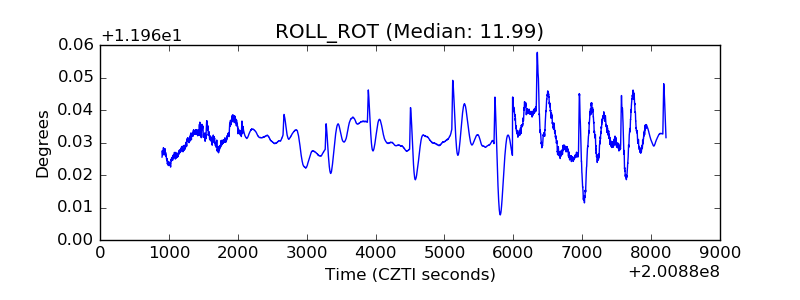 |
| _Roll_DEC | 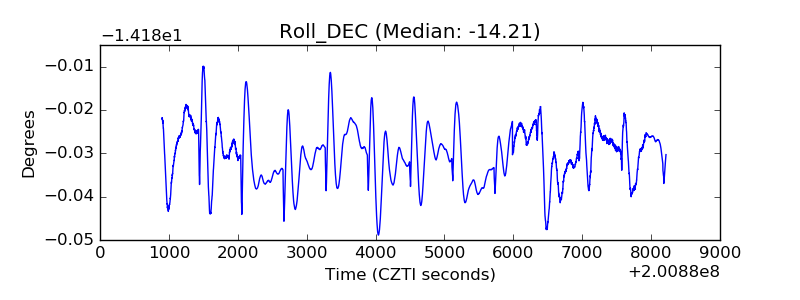 |
| _Roll_RA | 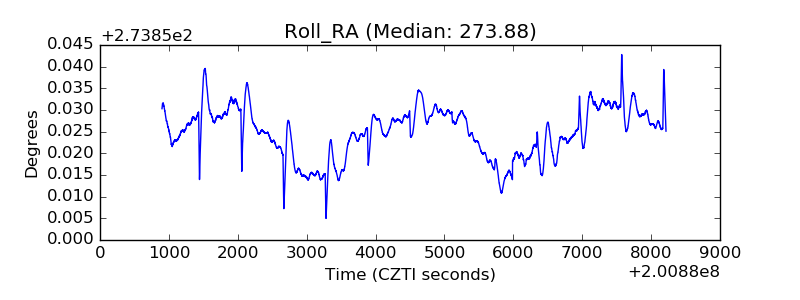 |
| Veto Counter | 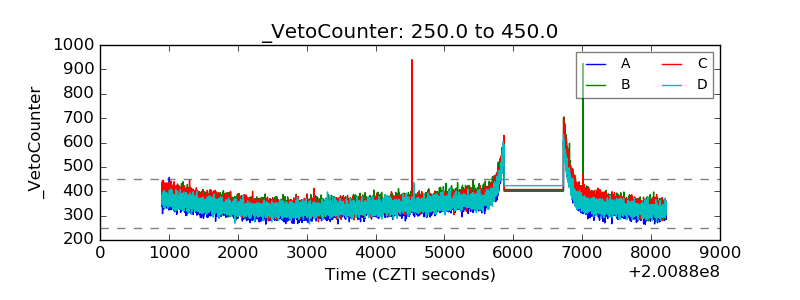 |