| Param | Original file | Final file |
|---|---|---|
| Filename | modeM0/AS1G05_112T01_9000000452_03390cztM0_level2.evt | modeM0/AS1G05_112T01_9000000452_03390cztM0_level2_quad_clean.evt |
| Size (bytes) | 53,496,000 | 13,763,520 |
| Size | 51.0 MB | 13.1 MB |
| Events in quadrant A | 369,772 | 86,261 |
| Events in quadrant B | 380,890 | 88,220 |
| Events in quadrant C | 411,435 | 87,805 |
| Events in quadrant D | 394,270 | 84,631 |
| Mode M9 | |||
|---|---|---|---|
| Quadrant | BADHDUFLAG | Total packets | Discarded packets |
| A | 0 | 4 | 2 |
| B | 0 | 4 | 2 |
| C | 0 | 5 | 5 |
| D | 0 | 4 | 3 |
| Mode SS | |||
|---|---|---|---|
| Quadrant | BADHDUFLAG | Total packets | Discarded packets |
| A | 0 | 62 | 42 |
| B | 0 | 67 | 51 |
| C | 0 | 68 | 52 |
| D | 0 | 63 | 43 |
| Mode M0 | |||
|---|---|---|---|
| Quadrant | BADHDUFLAG | Total packets | Discarded packets |
| A | 0 | 6732 | 4981 |
| B | 0 | 6845 | 5079 |
| C | 0 | 7079 | 5273 |
| D | 0 | 6667 | 4798 |
| Quadrant | Total seconds | Saturated seconds | Saturation percentage |
|---|---|---|---|
| A | 868 | 1 | 0.115207% |
| B | 878 | 5 | 0.569476% |
| C | 884 | 2 | 0.226244% |
| D | 887 | 5 | 0.563698% |
Noise dominated data is calculated using 1-second bins in cleaned event files. If a bin has >2000 counts, and if more than 50% of those come from <1% of pixels, then it is considered to be noise-dominated and hence unusable.
| Quadrant | # 1 sec bins | Bins with >0 counts | Bins with >2000 counts | High rate bins dominated by noise | Noise dominated (total time) | Noise dominated (detector-on time) | Marked lightcurve |
|---|---|---|---|---|---|---|---|
| A | 1652 | 1086 | 0 | 0 | 0.00% | 0.00% | 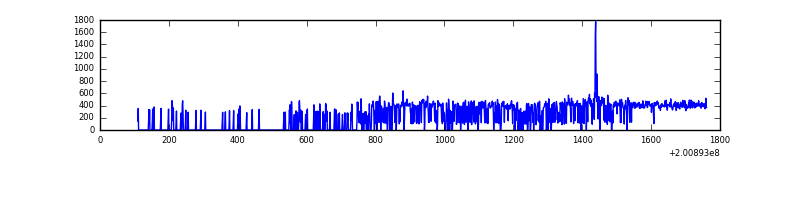 |
| B | 2549 | 1120 | 0 | 0 | 0.00% | 0.00% | 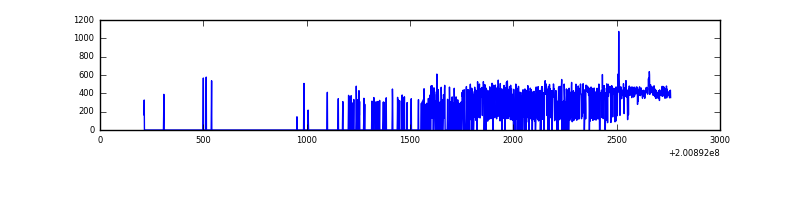 |
| C | 2578 | 1096 | 1 | 1 | 0.04% | 0.09% | 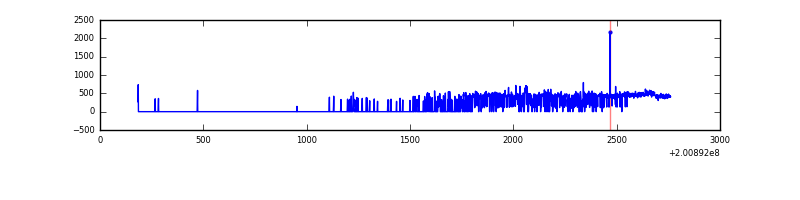 |
| D | 2619 | 1117 | 3 | 3 | 0.11% | 0.27% | 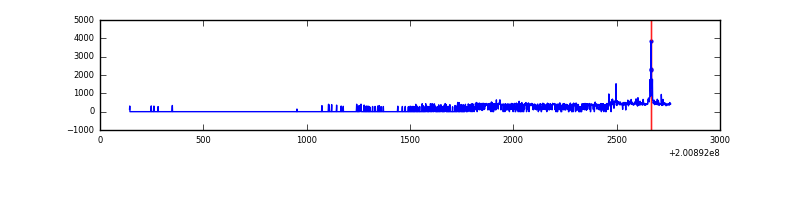 |
Top three noisy pixels from each quadrant. If the there are fewer than three noisy pixels in the level2.evt file, extra rows are filled as -1
| Pixel properties | Quadrant properties | ||||||
|---|---|---|---|---|---|---|---|
| Quadrant | DetID | PixID | Counts | Sigma | Mean | Median | Sigma |
| A | 0 | 118 | 7609 | 355.64 | 93 | 91 | 21.1 |
| A | 0 | 226 | 1638 | 73.18 | 93 | 91 | 21.1 |
| A | 12 | 194 | 1010 | 43.47 | 93 | 91 | 21.1 |
| B | 15 | 204 | 7833 | 375.64 | 95 | 93 | 20.6 |
| B | 2 | 249 | 2894 | 135.94 | 95 | 93 | 20.6 |
| B | 14 | 167 | 1532 | 69.84 | 95 | 93 | 20.6 |
| C | 9 | 144 | 25091 | 1048.1 | 92 | 93 | 23.9 |
| C | 10 | 19 | 7620 | 315.59 | 92 | 93 | 23.9 |
| C | 8 | 128 | 4462 | 183.18 | 92 | 93 | 23.9 |
| D | 13 | 223 | 42750 | 1767.44 | 92 | 89 | 24.1 |
| D | 5 | 233 | 2852 | 114.47 | 92 | 89 | 24.1 |
| D | 13 | 137 | 1035 | 39.19 | 92 | 89 | 24.1 |
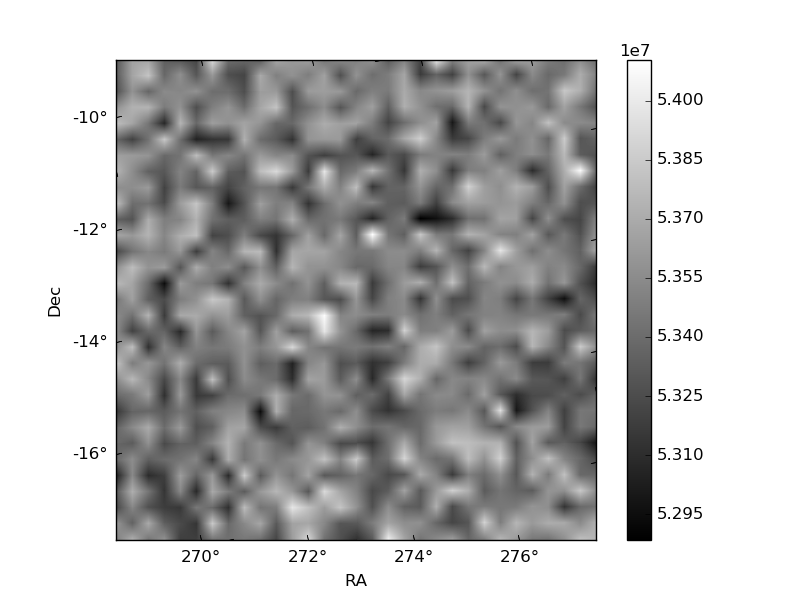
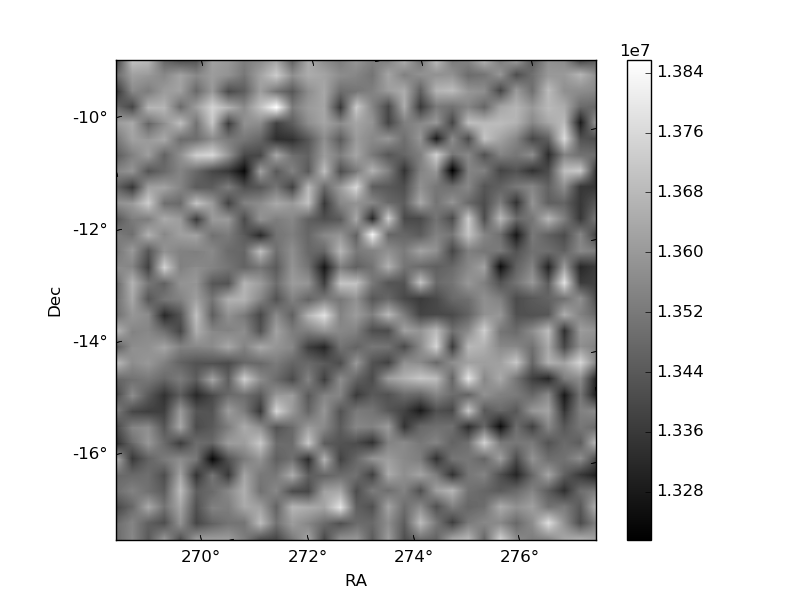
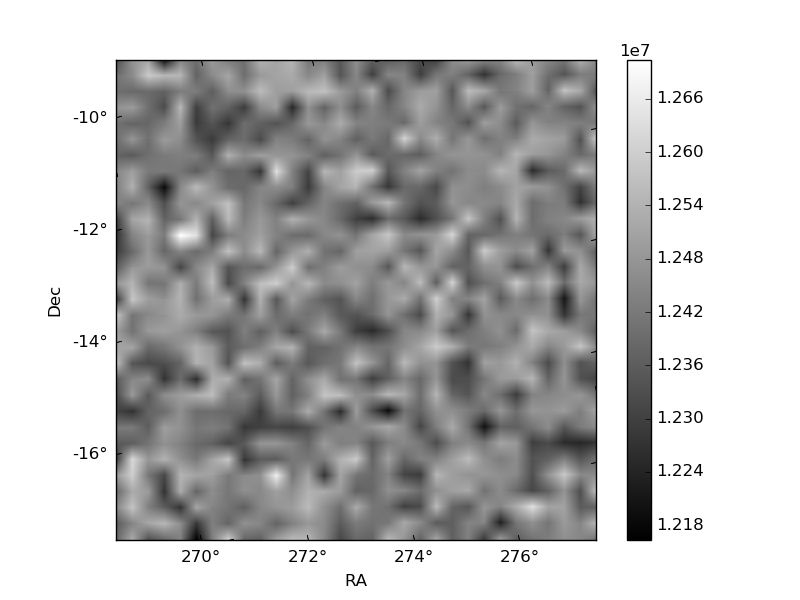
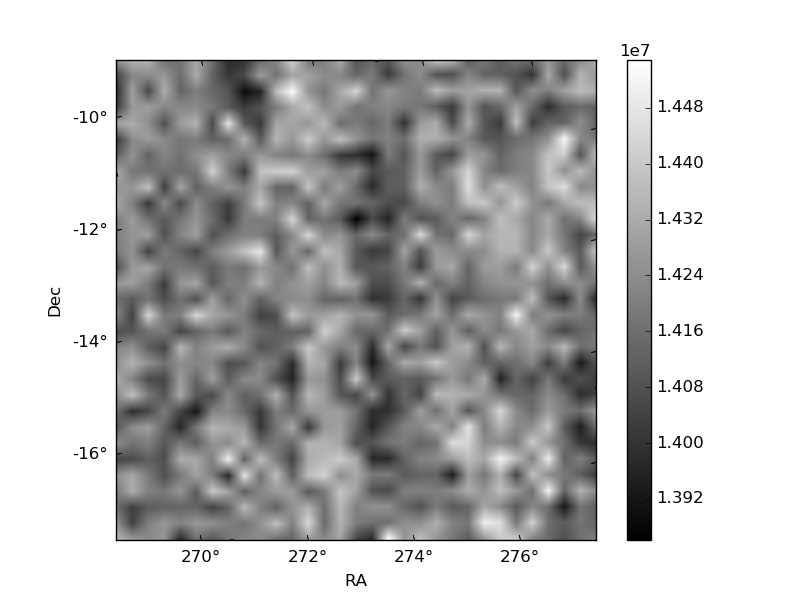
Histogram calculated using DETX and DETY for each event in the final _common_clean file
| Quadrant A | 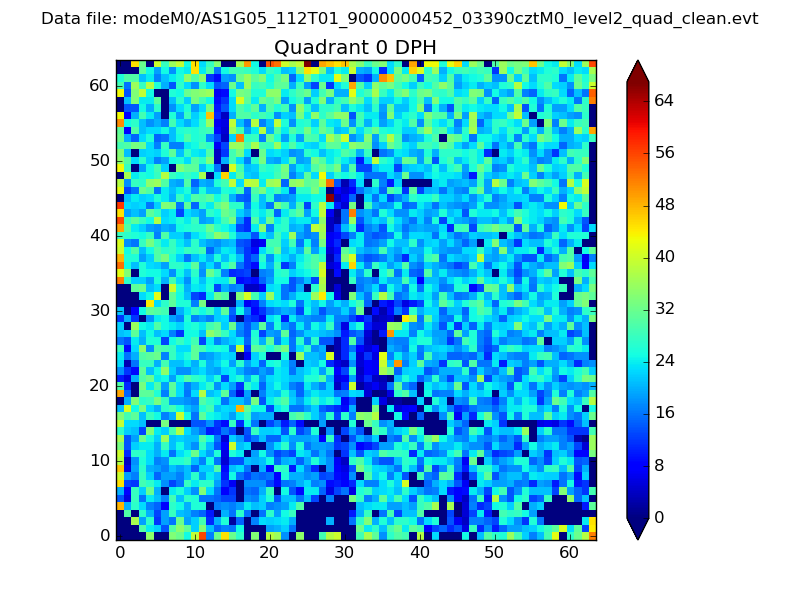 |
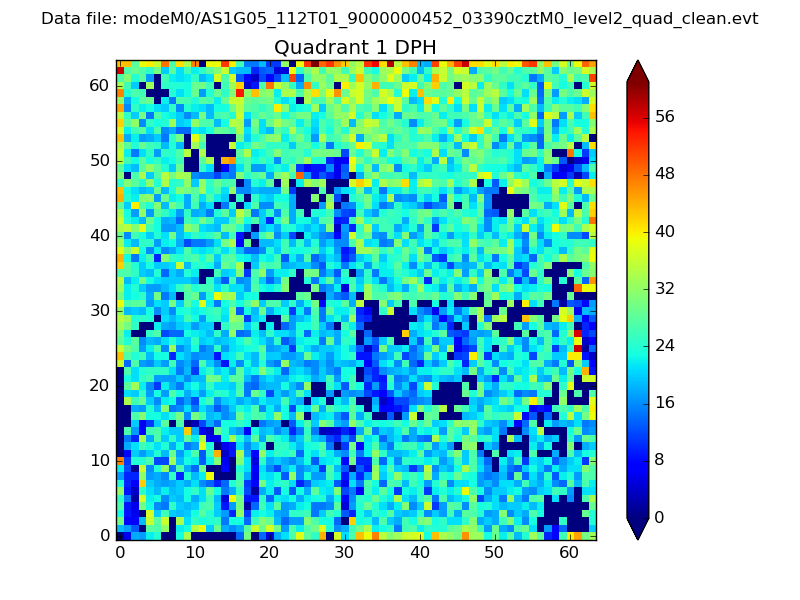 |
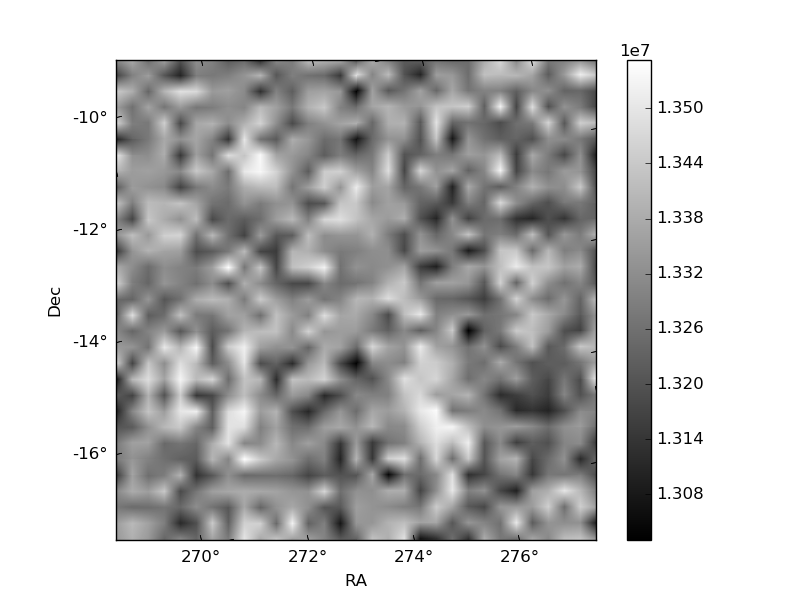
Quadrant B |
|---|---|---|---|
| Quadrant D | 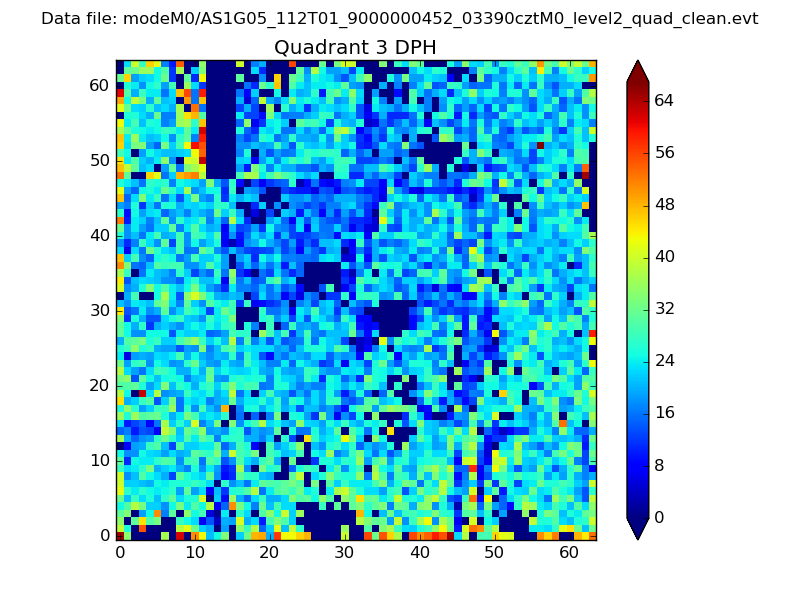 |
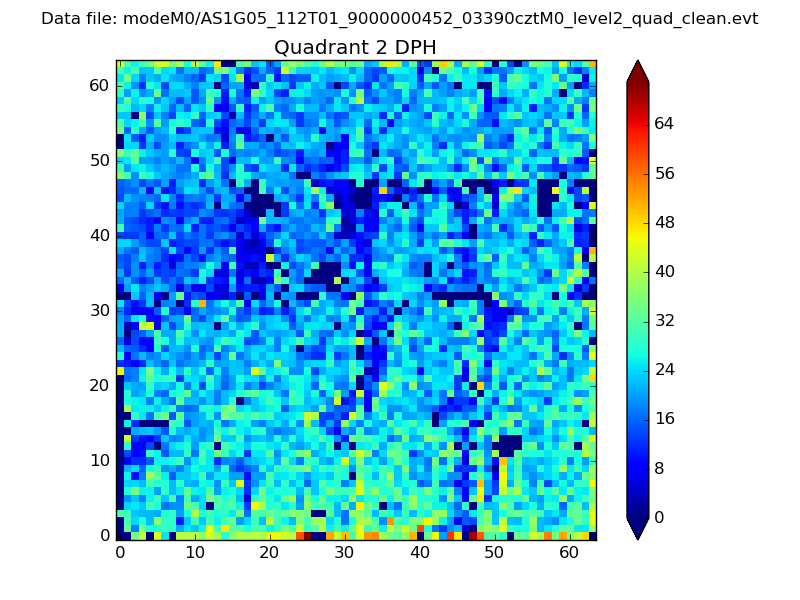 |
Quadrant C |
| Plot type | Count rate plots | Images |
|---|---|---|
| Comparison with Poisson distribution Blue bars denote a histogram of data divided into 1 sec bins. Red curve is a Poisson curve with rate = median count rate of data. |
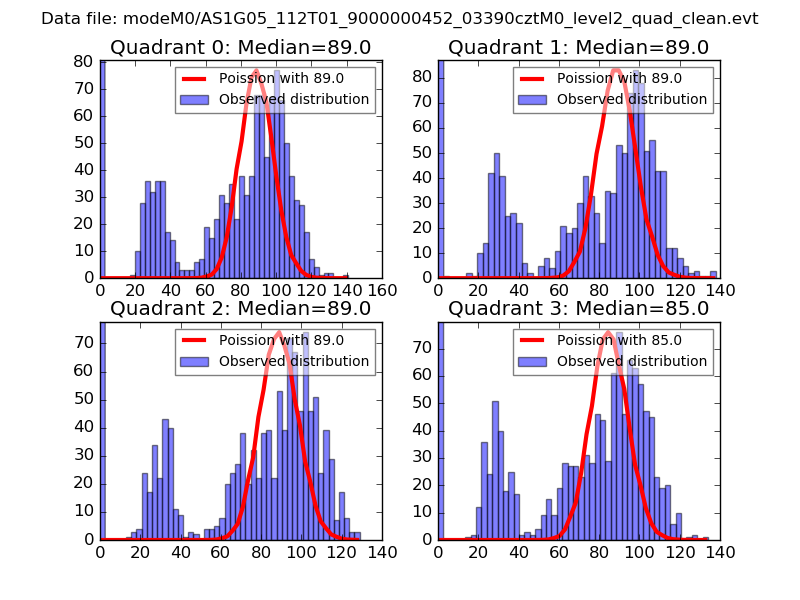 |
 |
| Quadrant-wise count rates Data is divided into 100 sec bins |
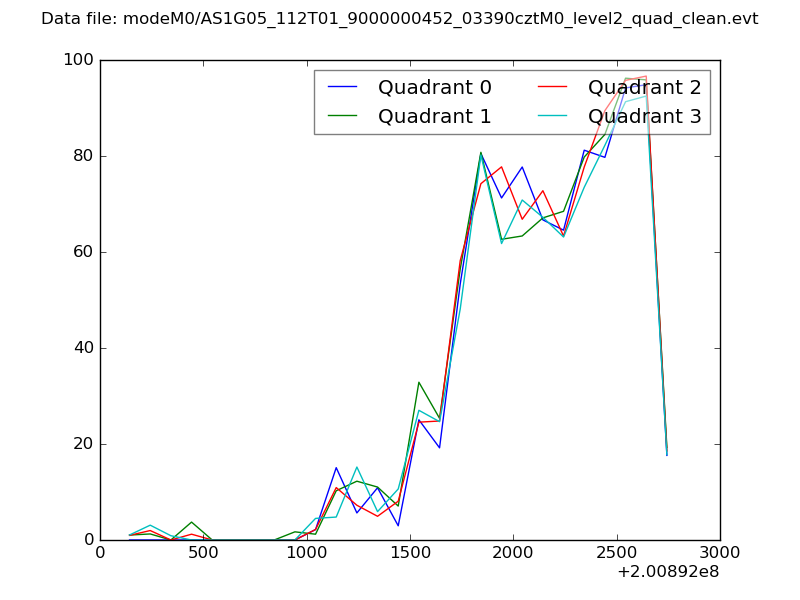 |
|
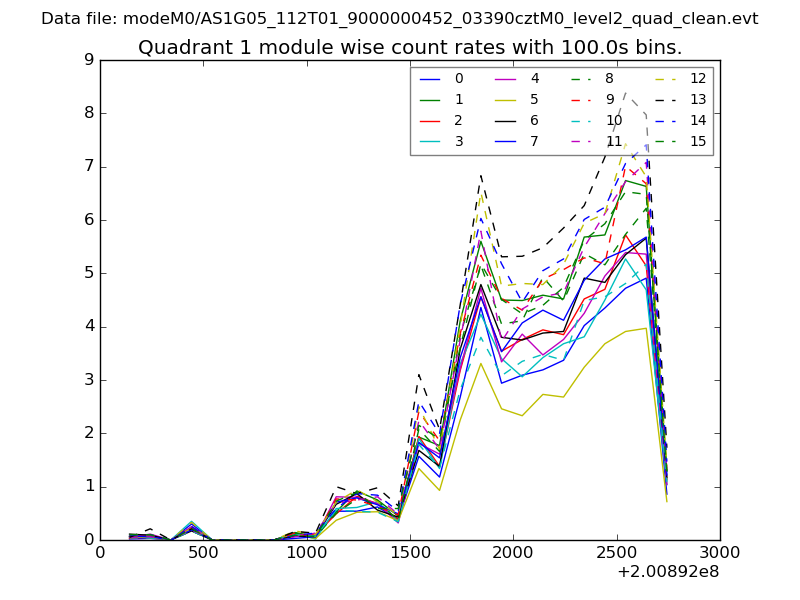
| Module-wise count rates for Quadrant A Data is divided into 100 sec bins |
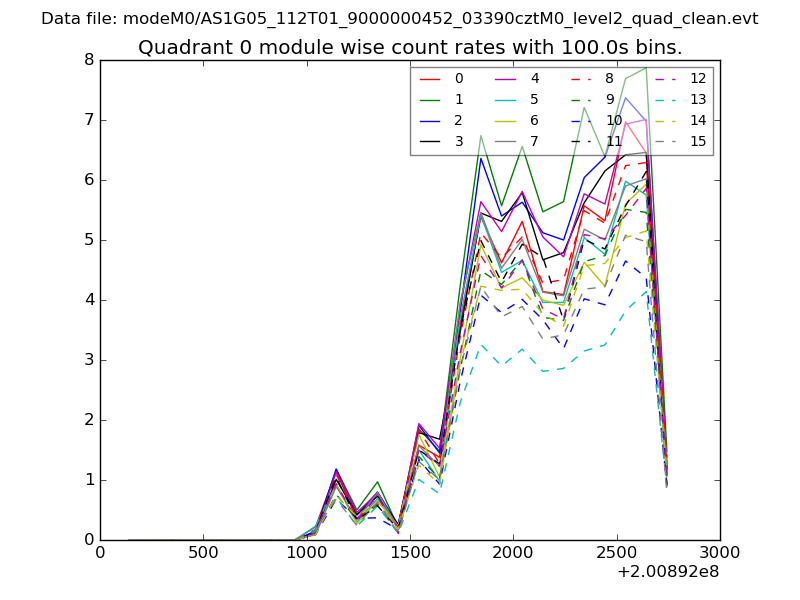 |
 |
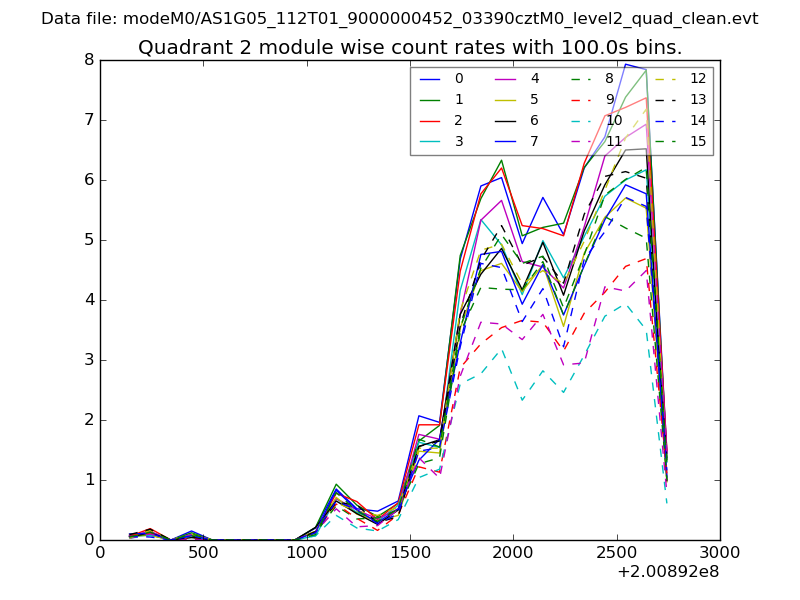
| Module-wise count rates for Quadrant B Data is divided into 100 sec bins |
 |
 |
| Module-wise count rates for Quadrant C Data is divided into 100 sec bins |
 |
 |
| Module-wise count rates for Quadrant D Data is divided into 100 sec bins |
 |
 |
| Parameter | Plot |
|---|---|
| CZT HV Monitor | 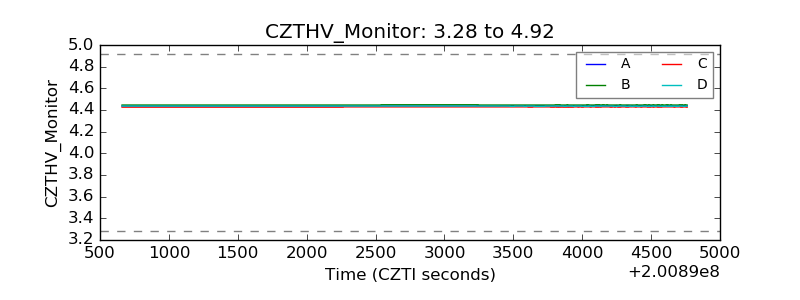 |
| D_VDD | 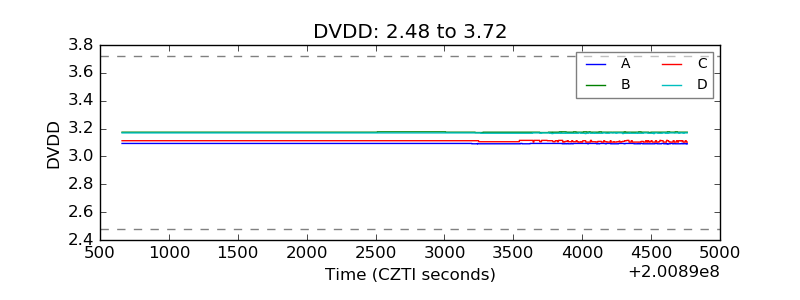 |
| Temperature 1 | 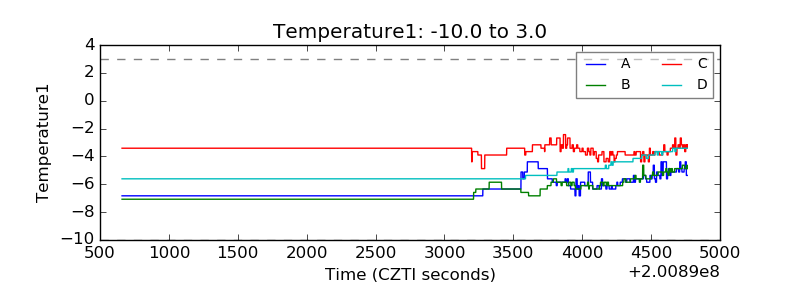 |
| Veto HV Monitor | 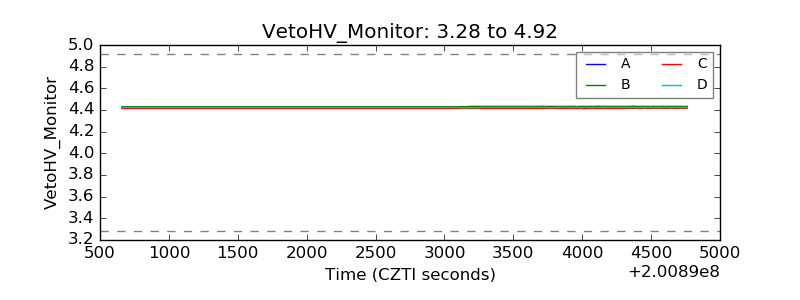 |
| Veto LLD | 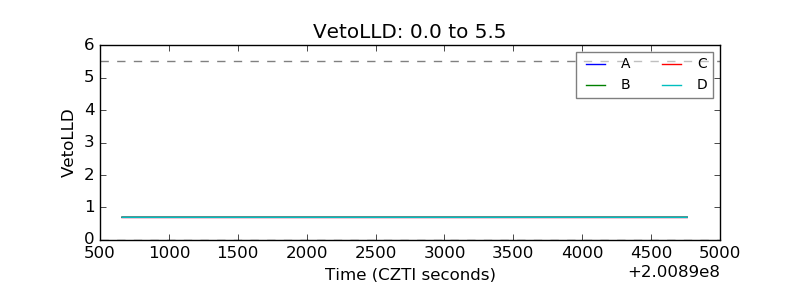 |
| Alpha Counter | 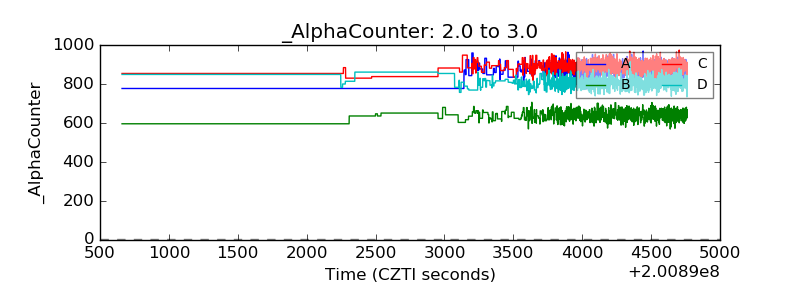 |
| _CPM_Rate | 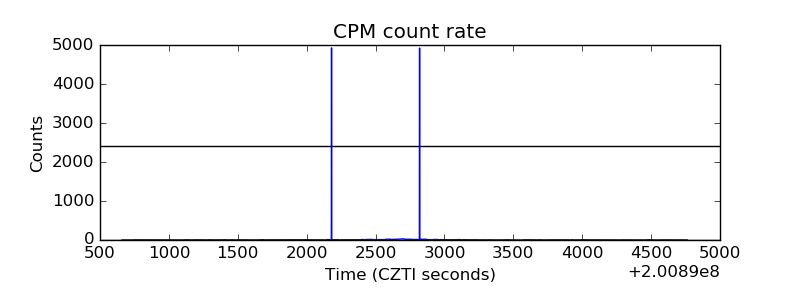 |
| CZT Counter | 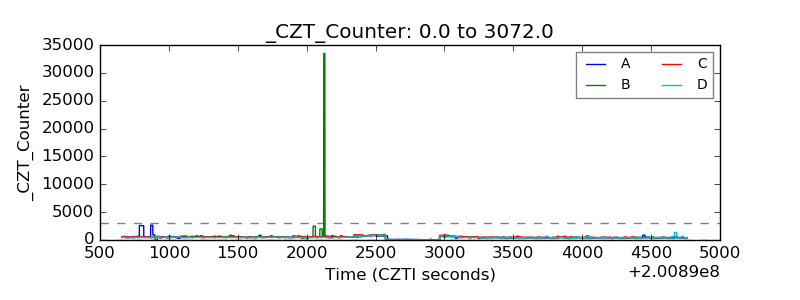 |
| +2.5 Volts monitor |  |
| +5 Volts monitor | 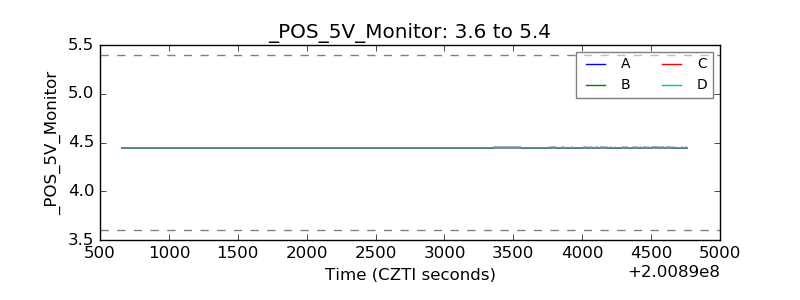 |
| _ROLL_ROT | 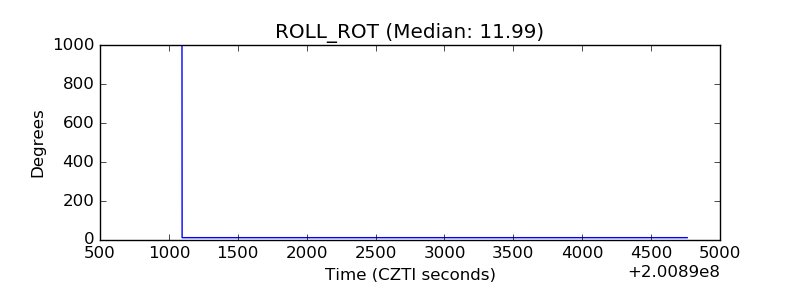 |
| _Roll_DEC | 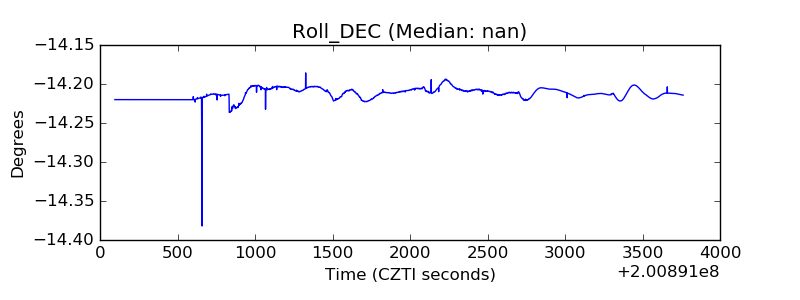 |
| _Roll_RA | 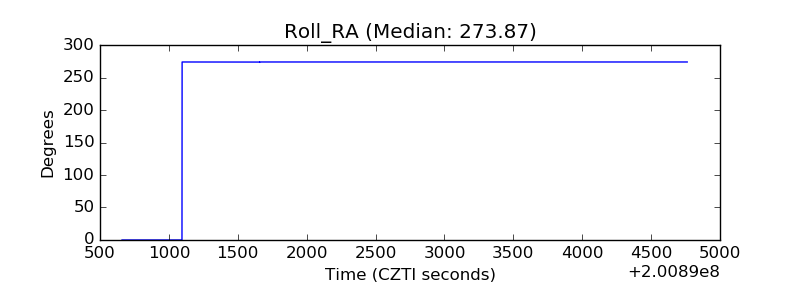 |
| Veto Counter | 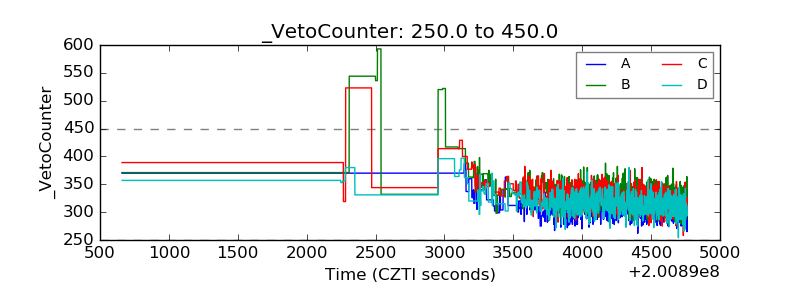 |