| Param | Original file | Final file |
|---|---|---|
| Filename | modeM0/AS1G05_112T01_9000000452_03391cztM0_level2.evt | modeM0/AS1G05_112T01_9000000452_03391cztM0_level2_quad_clean.evt |
| Size (bytes) | 471,611,520 | 80,363,520 |
| Size | 449.8 MB | 76.6 MB |
| Events in quadrant A | 3,300,542 | 489,233 |
| Events in quadrant B | 3,553,470 | 492,931 |
| Events in quadrant C | 3,644,977 | 484,343 |
| Events in quadrant D | 3,296,119 | 467,420 |
| Mode SS | |||
|---|---|---|---|
| Quadrant | BADHDUFLAG | Total packets | Discarded packets |
| A | 0 | 142 | 0 |
| B | 0 | 142 | 0 |
| C | 0 | 142 | 0 |
| D | 0 | 142 | 0 |
| Mode M0 | |||
|---|---|---|---|
| Quadrant | BADHDUFLAG | Total packets | Discarded packets |
| A | 0 | 14884 | 2 |
| B | 0 | 15205 | 1 |
| C | 0 | 15459 | 1 |
| D | 0 | 15217 | 1 |
| Quadrant | Total seconds | Saturated seconds | Saturation percentage |
|---|---|---|---|
| A | 7179 | 144 | 2.005850% |
| B | 7179 | 121 | 1.685472% |
| C | 7179 | 79 | 1.100432% |
| D | 7179 | 103 | 1.434740% |
Noise dominated data is calculated using 1-second bins in cleaned event files. If a bin has >2000 counts, and if more than 50% of those come from <1% of pixels, then it is considered to be noise-dominated and hence unusable.
| Quadrant | # 1 sec bins | Bins with >0 counts | Bins with >2000 counts | High rate bins dominated by noise | Noise dominated (total time) | Noise dominated (detector-on time) | Marked lightcurve |
|---|---|---|---|---|---|---|---|
| A | 7199 | 7180 | 6 | 6 | 0.08% | 0.08% | 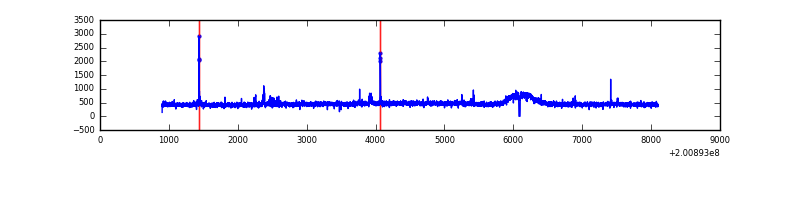 |
| B | 7199 | 7180 | 0 | 0 | 0.00% | 0.00% | 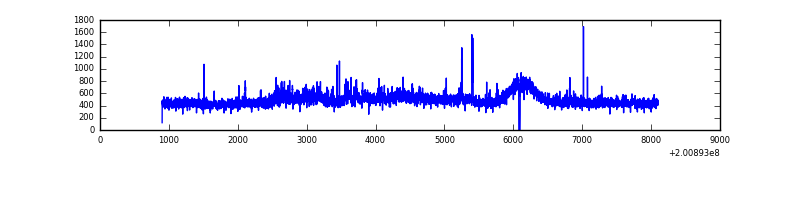 |
| C | 7199 | 7180 | 18 | 18 | 0.25% | 0.25% | 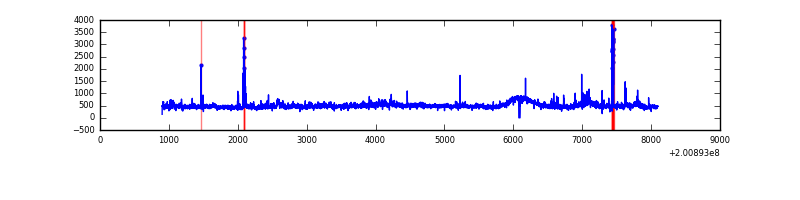 |
| D | 7199 | 7180 | 34 | 34 | 0.47% | 0.47% | 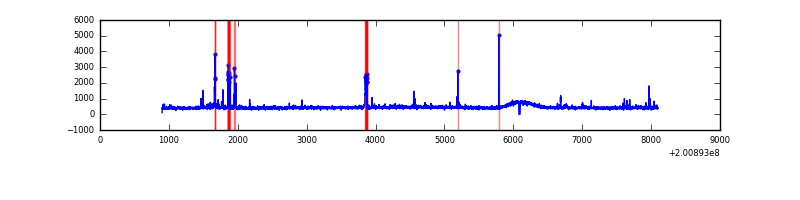 |
Top three noisy pixels from each quadrant. If the there are fewer than three noisy pixels in the level2.evt file, extra rows are filled as -1
| Pixel properties | Quadrant properties | ||||||
|---|---|---|---|---|---|---|---|
| Quadrant | DetID | PixID | Counts | Sigma | Mean | Median | Sigma |
| A | 0 | 118 | 60966 | 351.17 | 833 | 813 | 171.3 |
| A | 0 | 226 | 14051 | 77.28 | 833 | 813 | 171.3 |
| A | 15 | 170 | 12867 | 70.37 | 833 | 813 | 171.3 |
| B | 15 | 204 | 213874 | 1293.48 | 843 | 820 | 164.7 |
| B | 0 | 229 | 37494 | 222.65 | 843 | 820 | 164.7 |
| B | 14 | 167 | 30736 | 181.62 | 843 | 820 | 164.7 |
| C | 9 | 144 | 261172 | 1366.49 | 809 | 812 | 190.5 |
| C | 1 | 16 | 70287 | 364.64 | 809 | 812 | 190.5 |
| C | 1 | 192 | 65378 | 338.87 | 809 | 812 | 190.5 |
| D | 13 | 223 | 131760 | 662.24 | 811 | 784 | 197.8 |
| D | 10 | 172 | 53946 | 268.8 | 811 | 784 | 197.8 |
| D | 5 | 233 | 25868 | 126.83 | 811 | 784 | 197.8 |
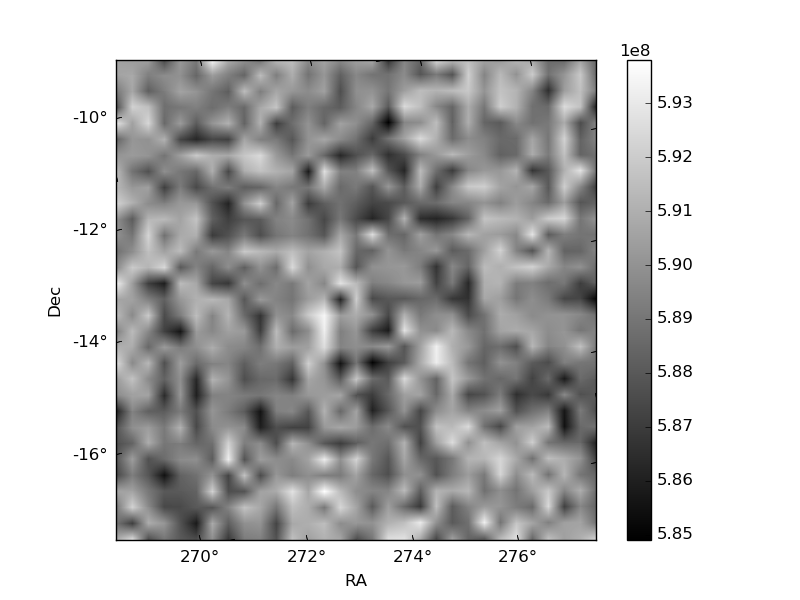
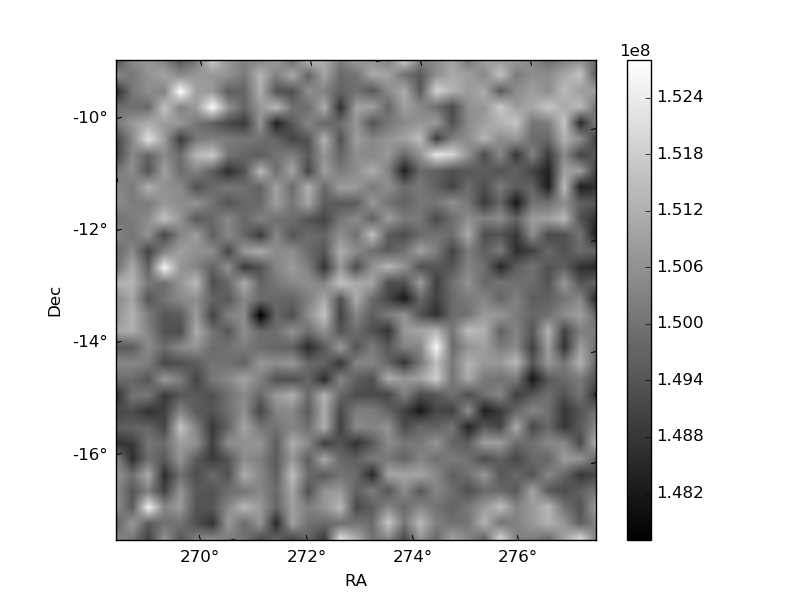
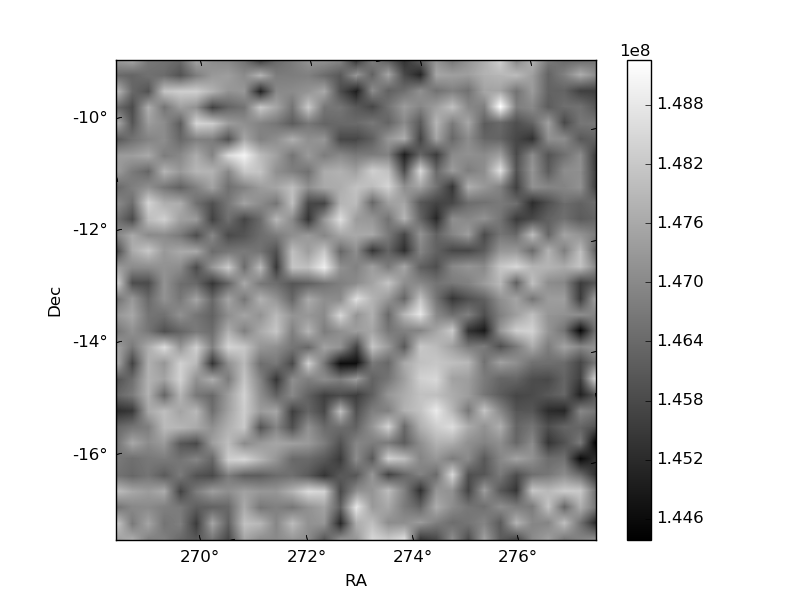
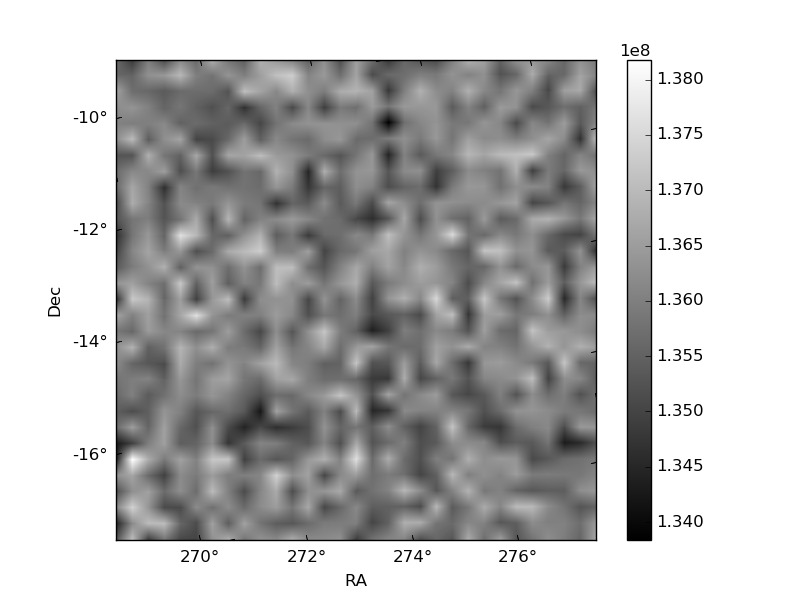
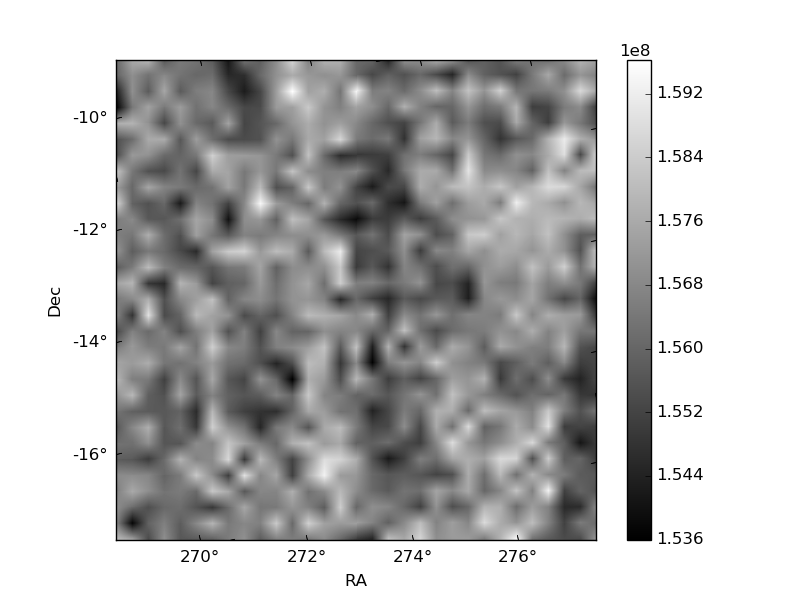
Histogram calculated using DETX and DETY for each event in the final _common_clean file
| Quadrant A | 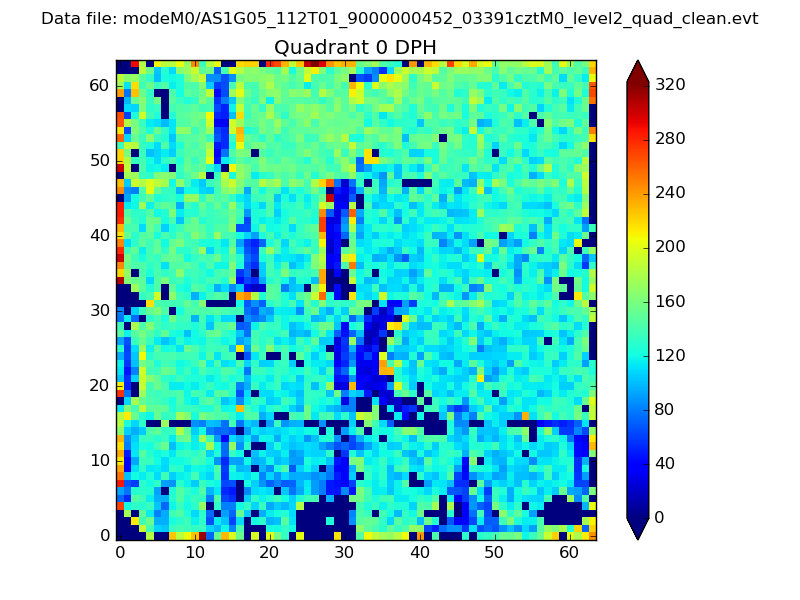 |
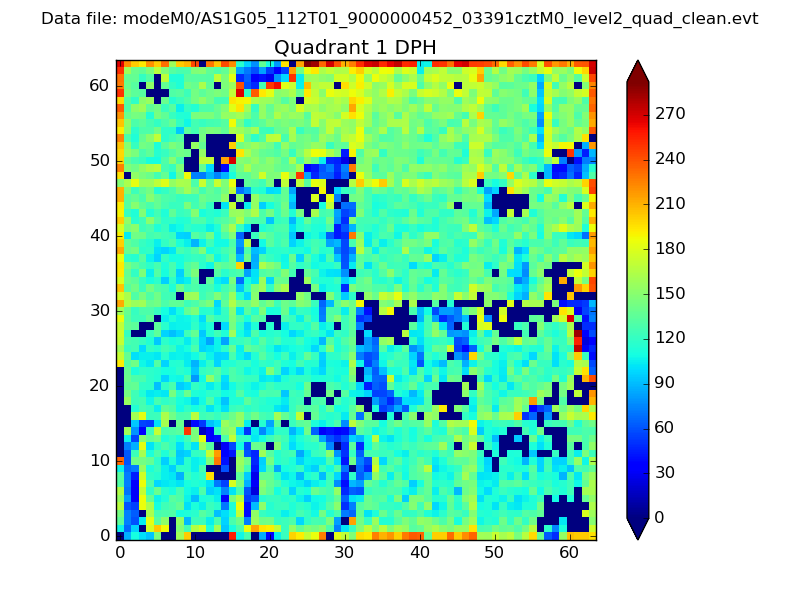 |
Quadrant B |
|---|---|---|---|
| Quadrant D | 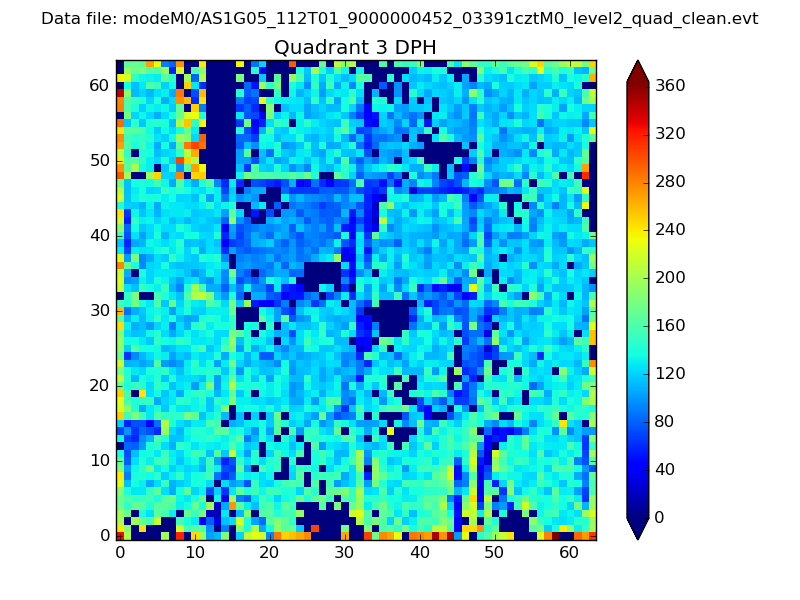 |
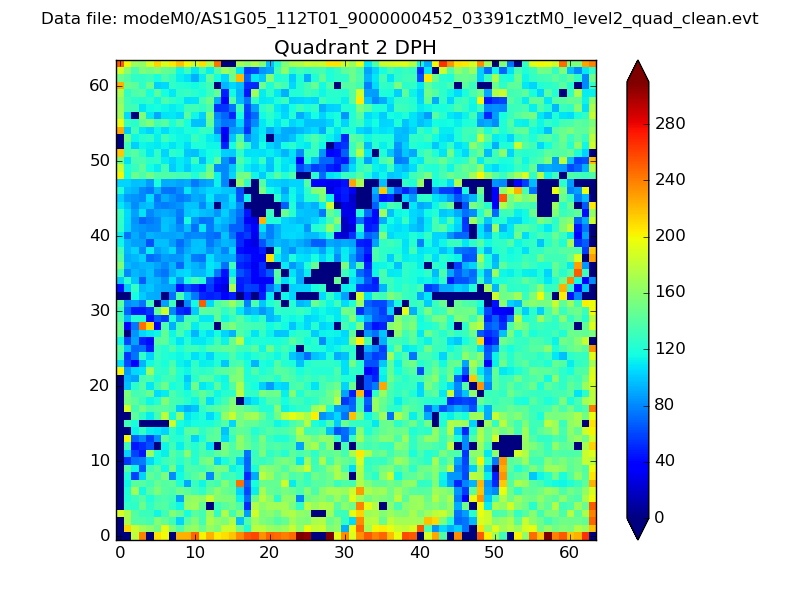 |
Quadrant C |
| Plot type | Count rate plots | Images |
|---|---|---|
| Comparison with Poisson distribution Blue bars denote a histogram of data divided into 1 sec bins. Red curve is a Poisson curve with rate = median count rate of data. |
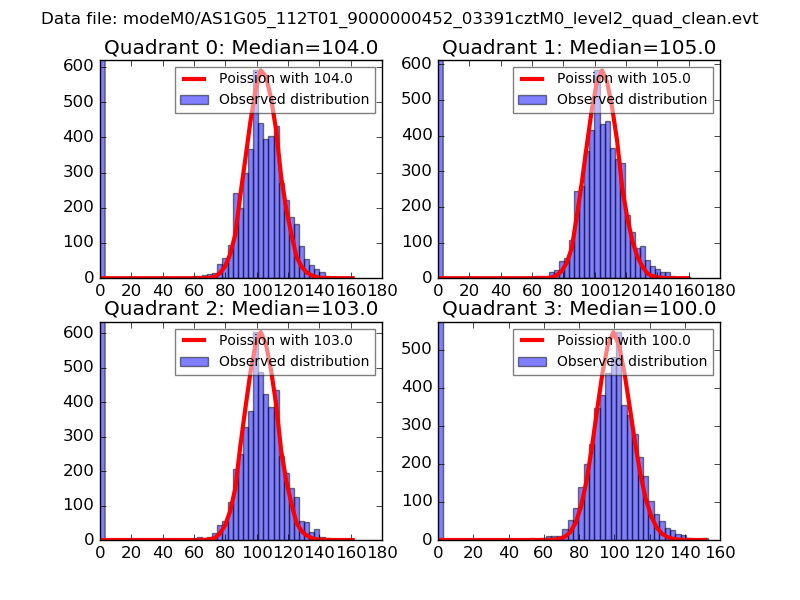 |
 |
| Quadrant-wise count rates Data is divided into 100 sec bins |
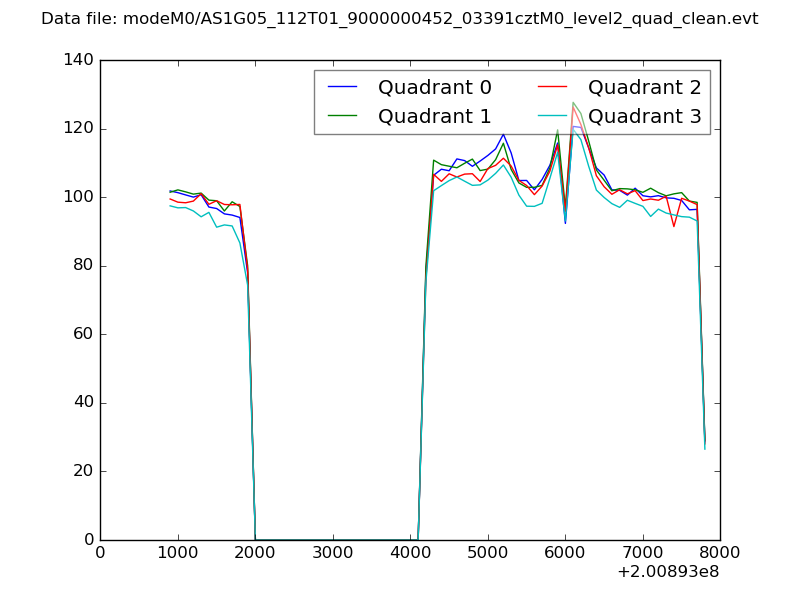 |
|
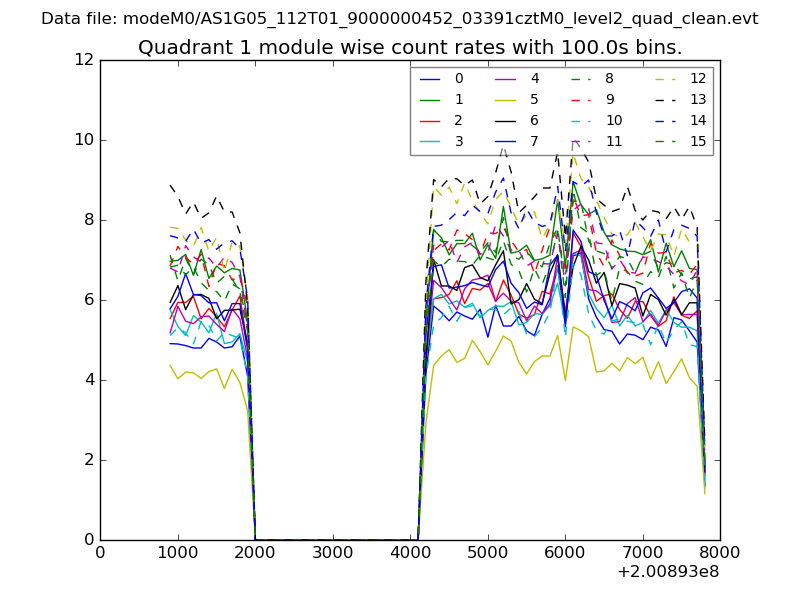
| Module-wise count rates for Quadrant A Data is divided into 100 sec bins |
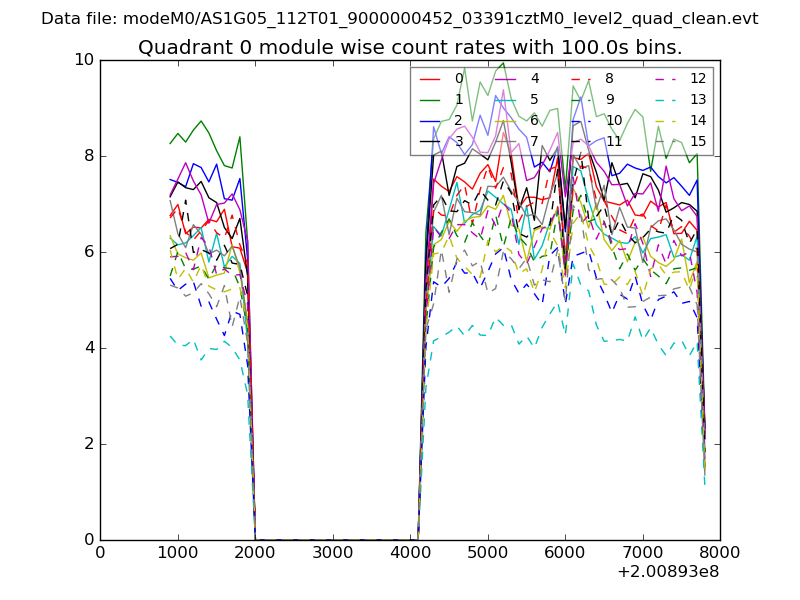 |
 |
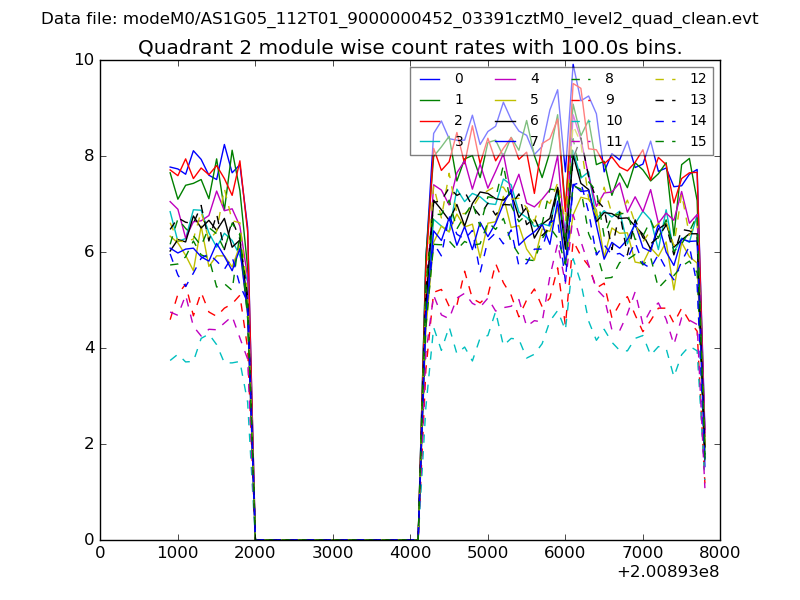
| Module-wise count rates for Quadrant B Data is divided into 100 sec bins |
 |
 |
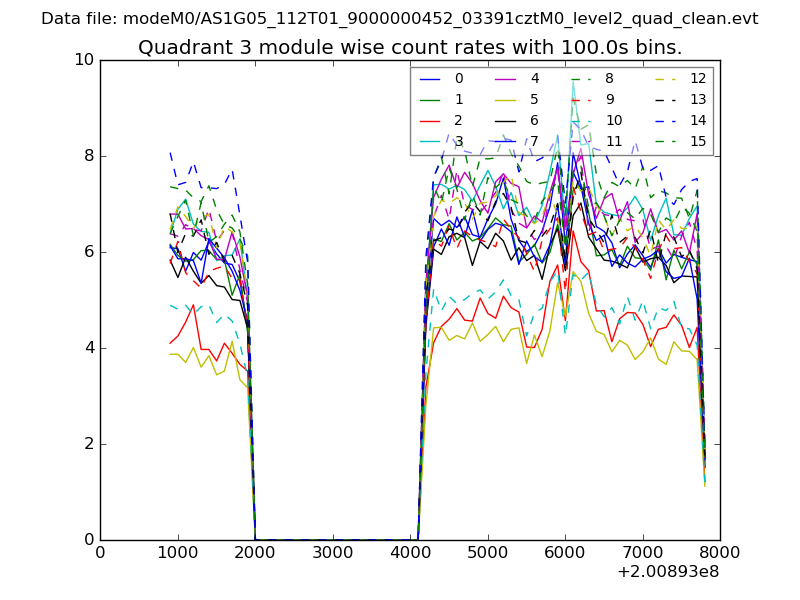
| Module-wise count rates for Quadrant C Data is divided into 100 sec bins |
 |
 |
| Module-wise count rates for Quadrant D Data is divided into 100 sec bins |
 |
 |
| Parameter | Plot |
|---|---|
| CZT HV Monitor | 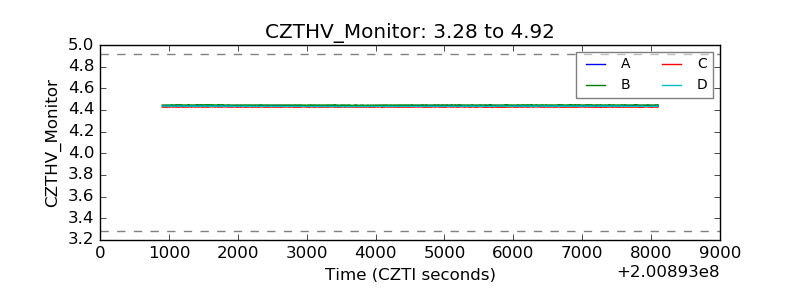 |
| D_VDD | 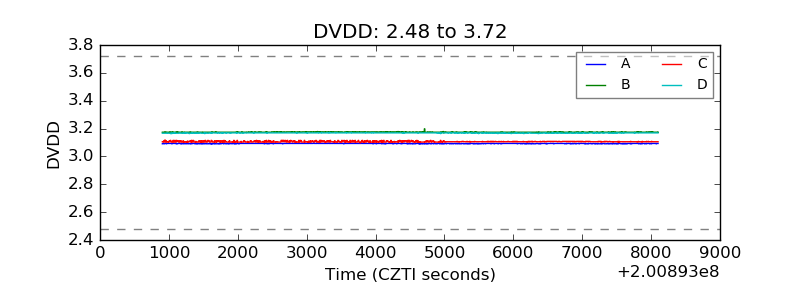 |
| Temperature 1 | 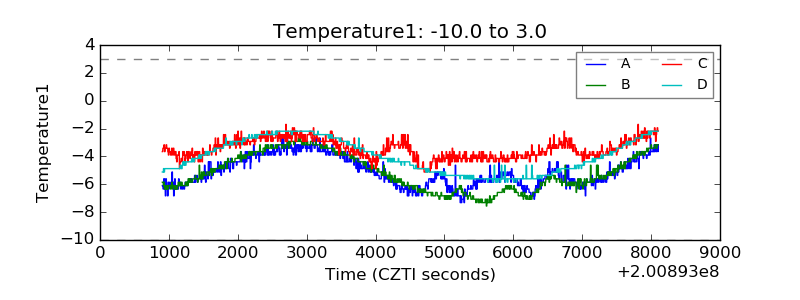 |
| Veto HV Monitor | 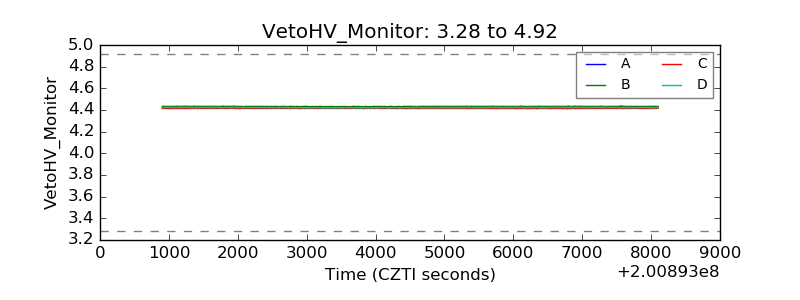 |
| Veto LLD | 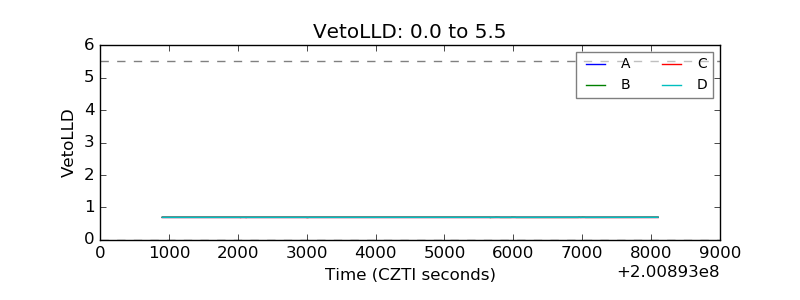 |
| Alpha Counter | 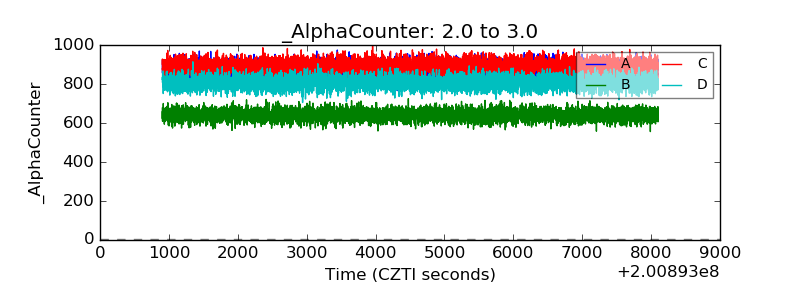 |
| _CPM_Rate | 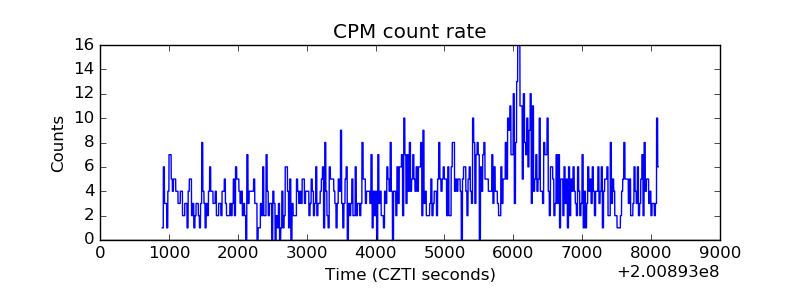 |
| CZT Counter | 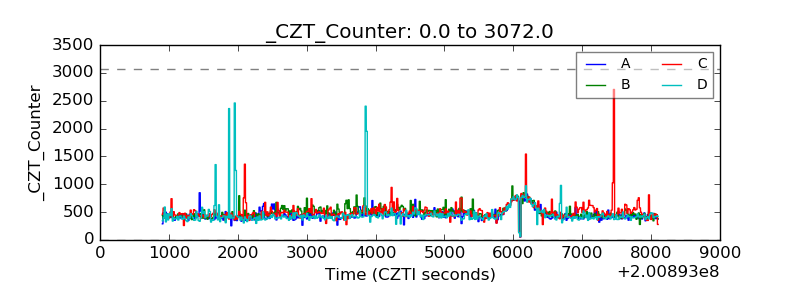 |
| +2.5 Volts monitor | 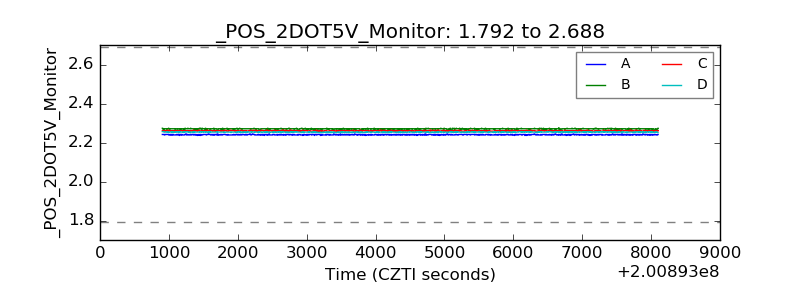 |
| +5 Volts monitor |  |
| _ROLL_ROT | 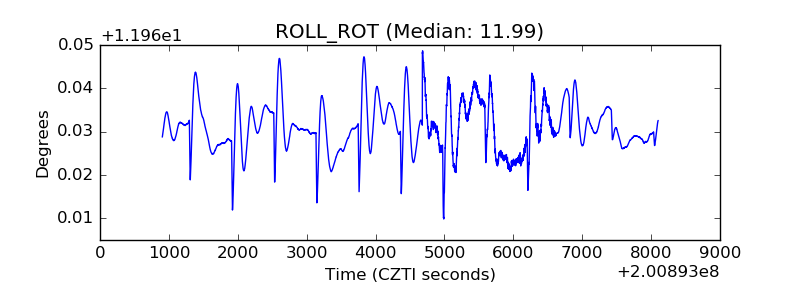 |
| _Roll_DEC | 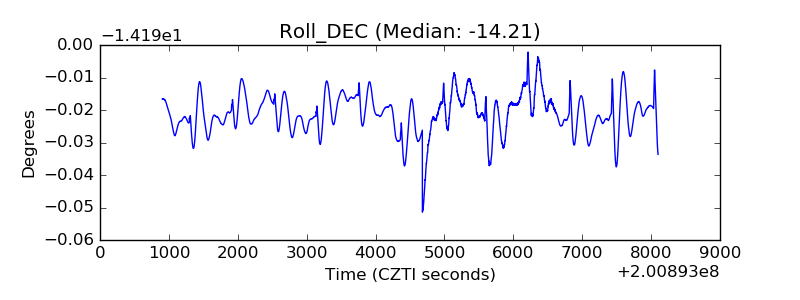 |
| _Roll_RA | 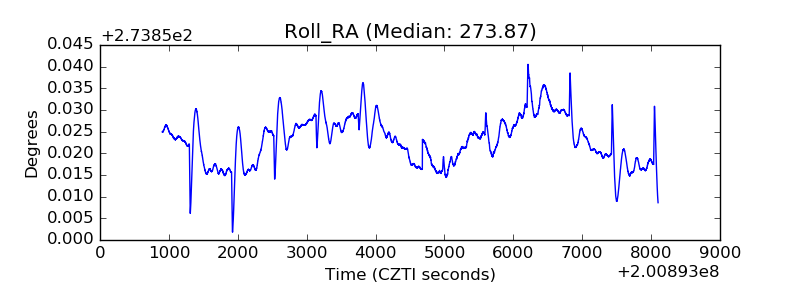 |
| Veto Counter | 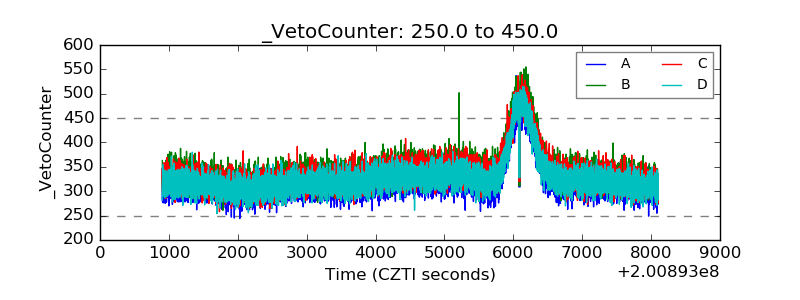 |