| Param | Original file | Final file |
|---|---|---|
| Filename | modeM0/AS1G05_112T01_9000000452_03392cztM0_level2.evt | modeM0/AS1G05_112T01_9000000452_03392cztM0_level2_quad_clean.evt |
| Size (bytes) | 807,200,640 | 122,918,400 |
| Size | 769.8 MB | 117.2 MB |
| Events in quadrant A | 5,622,355 | 731,985 |
| Events in quadrant B | 5,923,063 | 737,361 |
| Events in quadrant C | 6,715,178 | 724,202 |
| Events in quadrant D | 5,376,620 | 702,853 |
| Mode M9 | |||
|---|---|---|---|
| Quadrant | BADHDUFLAG | Total packets | Discarded packets |
| A | 0 | 3 | 0 |
| B | 0 | 2 | 0 |
| C | 0 | 2 | 0 |
| D | 0 | 2 | 0 |
| Mode SS | |||
|---|---|---|---|
| Quadrant | BADHDUFLAG | Total packets | Discarded packets |
| A | 0 | 242 | 0 |
| B | 0 | 242 | 0 |
| C | 0 | 242 | 0 |
| D | 0 | 242 | 0 |
| Mode M0 | |||
|---|---|---|---|
| Quadrant | BADHDUFLAG | Total packets | Discarded packets |
| A | 0 | 25016 | 1 |
| B | 0 | 25184 | 1 |
| C | 0 | 28018 | 1 |
| D | 0 | 24886 | 5 |
| Quadrant | Total seconds | Saturated seconds | Saturation percentage |
|---|---|---|---|
| A | 11938 | 352 | 2.948568% |
| B | 11938 | 285 | 2.387335% |
| C | 11938 | 315 | 2.638633% |
| D | 11937 | 277 | 2.320516% |
Noise dominated data is calculated using 1-second bins in cleaned event files. If a bin has >2000 counts, and if more than 50% of those come from <1% of pixels, then it is considered to be noise-dominated and hence unusable.
| Quadrant | # 1 sec bins | Bins with >0 counts | Bins with >2000 counts | High rate bins dominated by noise | Noise dominated (total time) | Noise dominated (detector-on time) | Marked lightcurve |
|---|---|---|---|---|---|---|---|
| A | 19380 | 11940 | 18 | 18 | 0.09% | 0.15% |  |
| B | 19380 | 11940 | 5 | 5 | 0.03% | 0.04% |  |
| C | 19380 | 11940 | 22 | 22 | 0.11% | 0.18% | 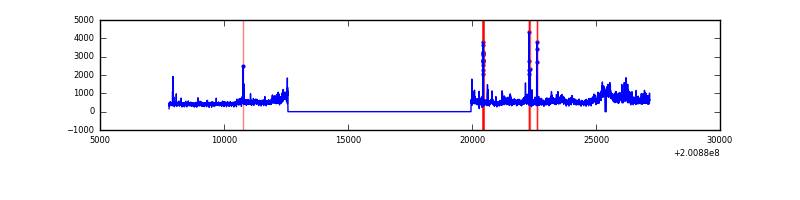 |
| D | 19380 | 11939 | 14 | 14 | 0.07% | 0.12% |  |
Top three noisy pixels from each quadrant. If the there are fewer than three noisy pixels in the level2.evt file, extra rows are filled as -1
| Pixel properties | Quadrant properties | ||||||
|---|---|---|---|---|---|---|---|
| Quadrant | DetID | PixID | Counts | Sigma | Mean | Median | Sigma |
| A | 0 | 118 | 163653 | 564.25 | 1397 | 1363 | 287.6 |
| A | 15 | 170 | 35320 | 118.06 | 1397 | 1363 | 287.6 |
| A | 0 | 226 | 29362 | 97.35 | 1397 | 1363 | 287.6 |
| B | 15 | 204 | 304242 | 1102.94 | 1412 | 1377 | 274.6 |
| B | 14 | 167 | 79571 | 284.76 | 1412 | 1377 | 274.6 |
| B | 2 | 249 | 30651 | 106.61 | 1412 | 1377 | 274.6 |
| C | 9 | 144 | 1218685 | 3818.19 | 1359 | 1366 | 318.8 |
| C | 1 | 16 | 134288 | 416.92 | 1359 | 1366 | 318.8 |
| C | 12 | 4 | 15868 | 45.49 | 1359 | 1366 | 318.8 |
| D | 2 | 206 | 71441 | 211.08 | 1364 | 1320 | 332.2 |
| D | 13 | 223 | 51693 | 151.63 | 1364 | 1320 | 332.2 |
| D | 10 | 34 | 37173 | 107.93 | 1364 | 1320 | 332.2 |
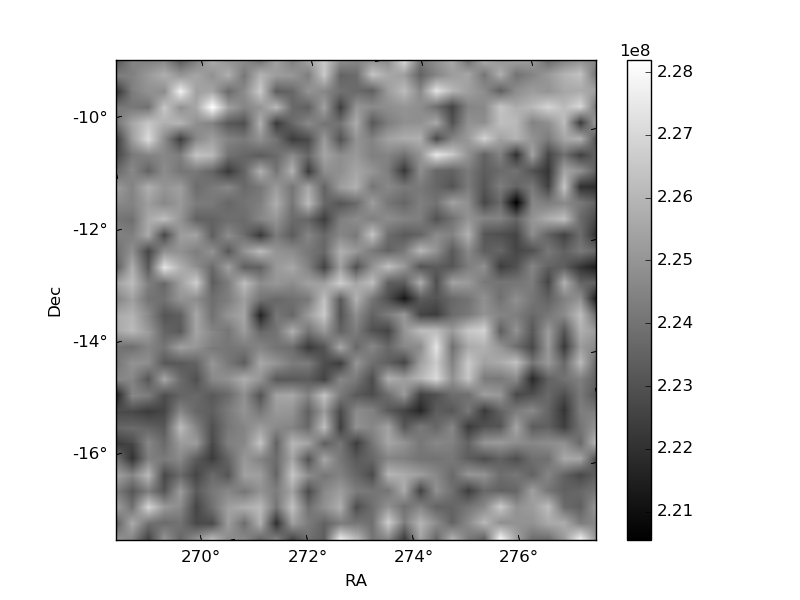
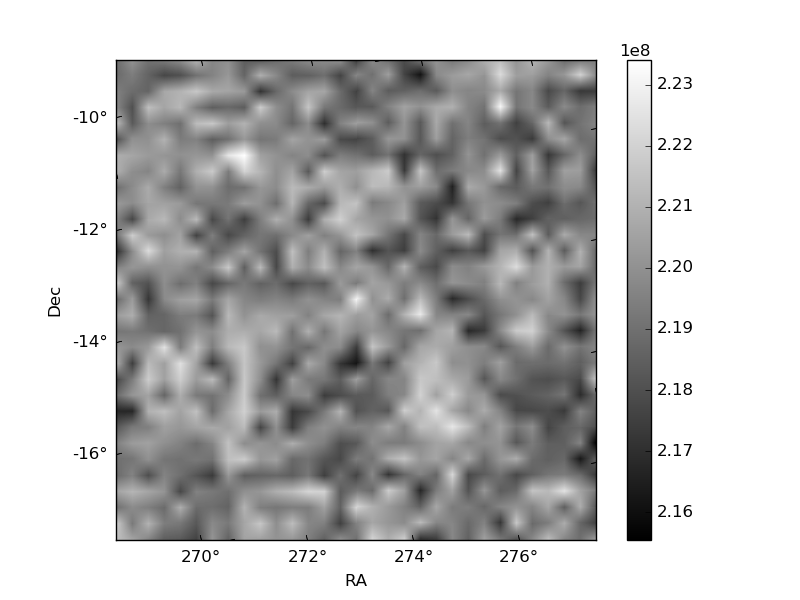
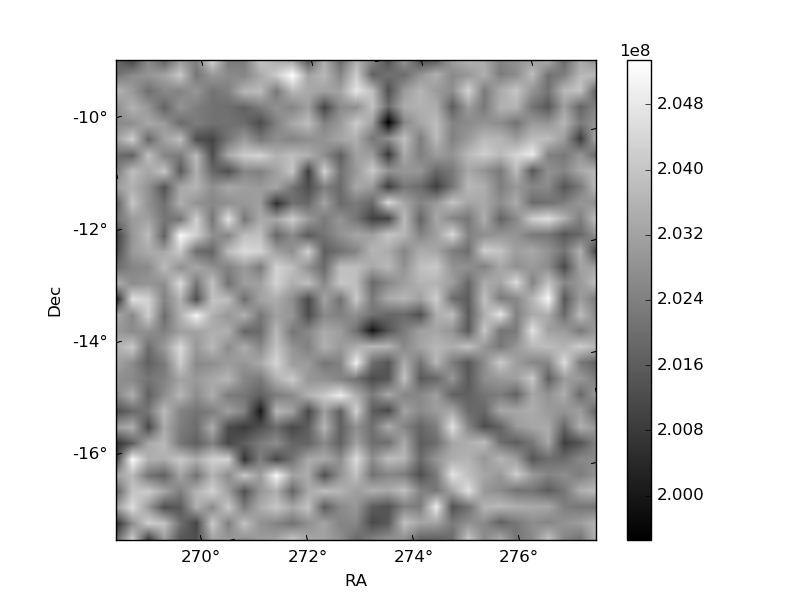
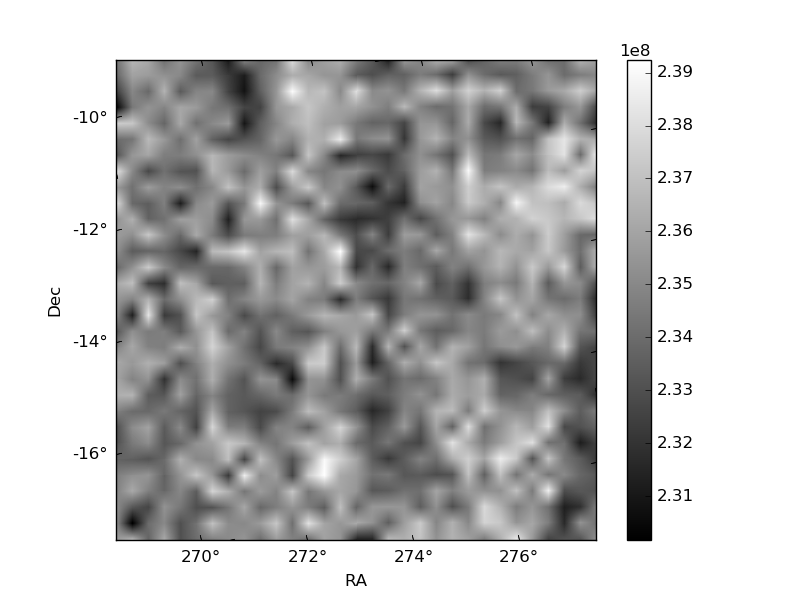
Histogram calculated using DETX and DETY for each event in the final _common_clean file
| Quadrant A | 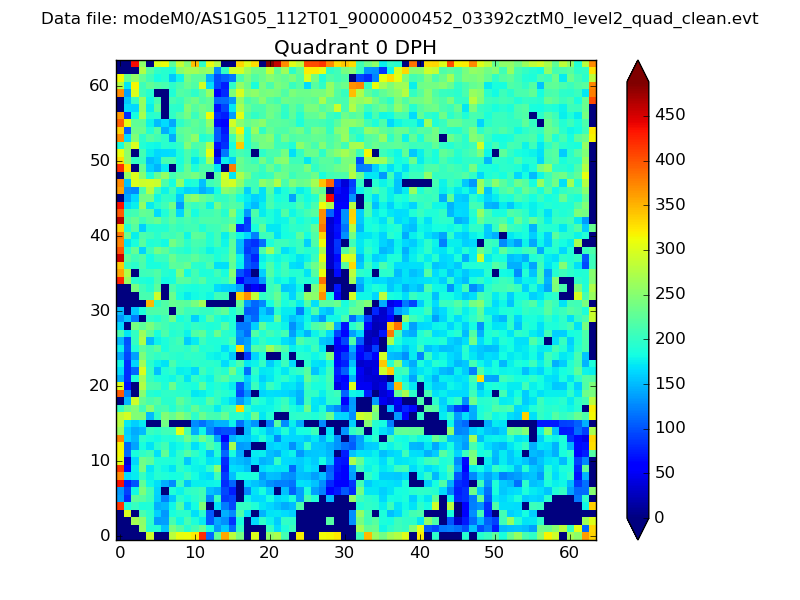 |
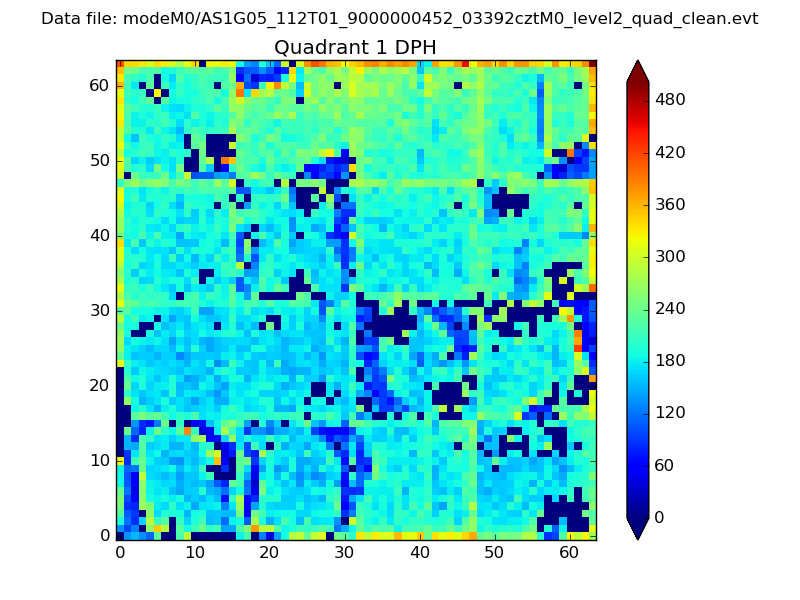 |
Quadrant B |
|---|---|---|---|
| Quadrant D | 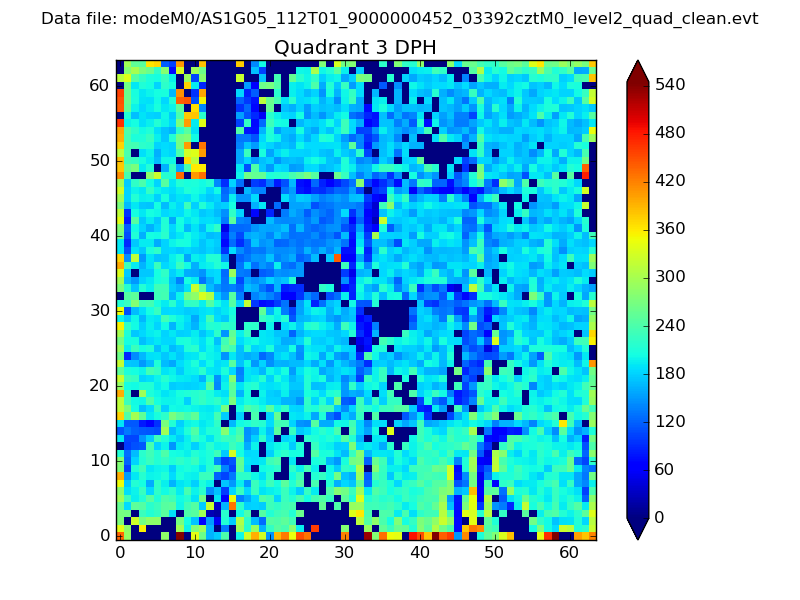 |
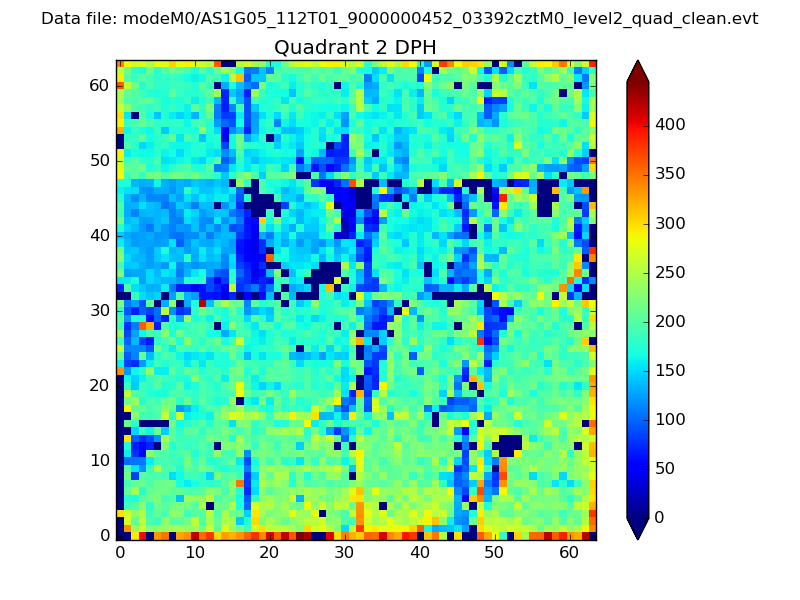 |
Quadrant C |
| Plot type | Count rate plots | Images |
|---|---|---|
| Comparison with Poisson distribution Blue bars denote a histogram of data divided into 1 sec bins. Red curve is a Poisson curve with rate = median count rate of data. |
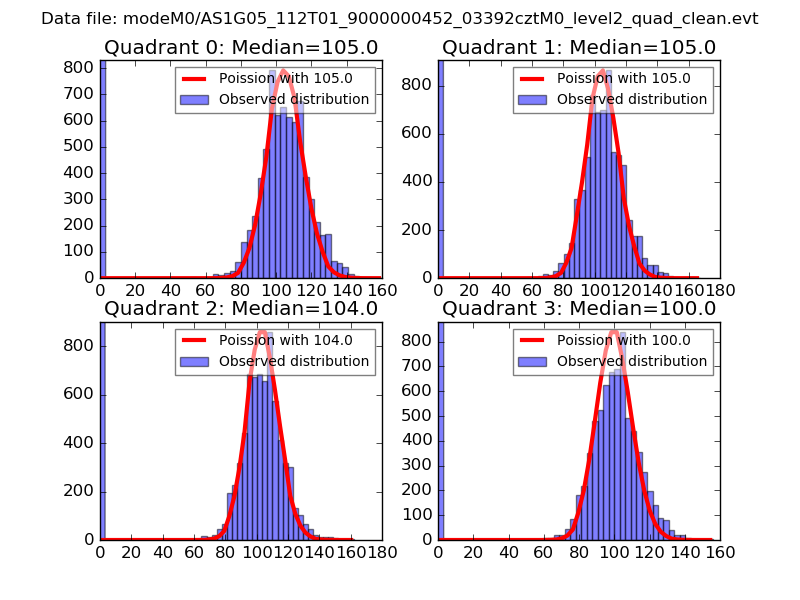 |
 |
| Quadrant-wise count rates Data is divided into 100 sec bins |
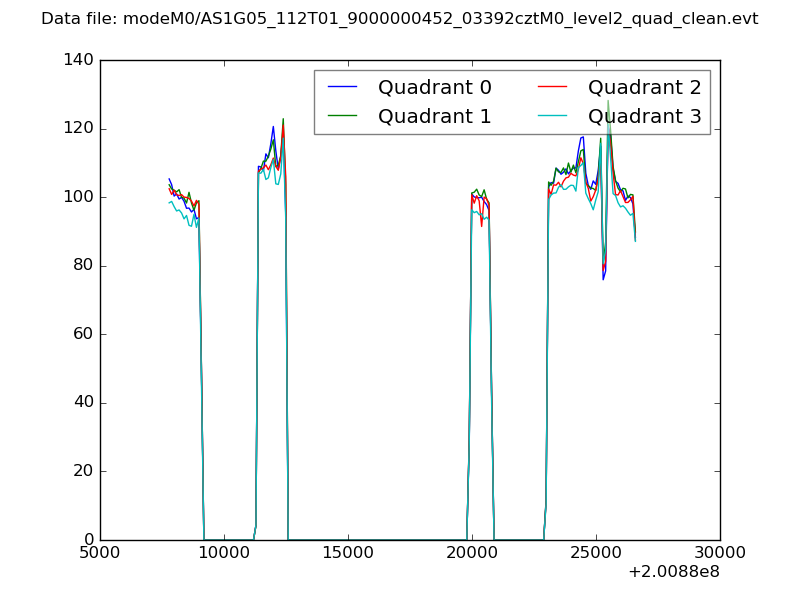 |
|
| Module-wise count rates for Quadrant A Data is divided into 100 sec bins |
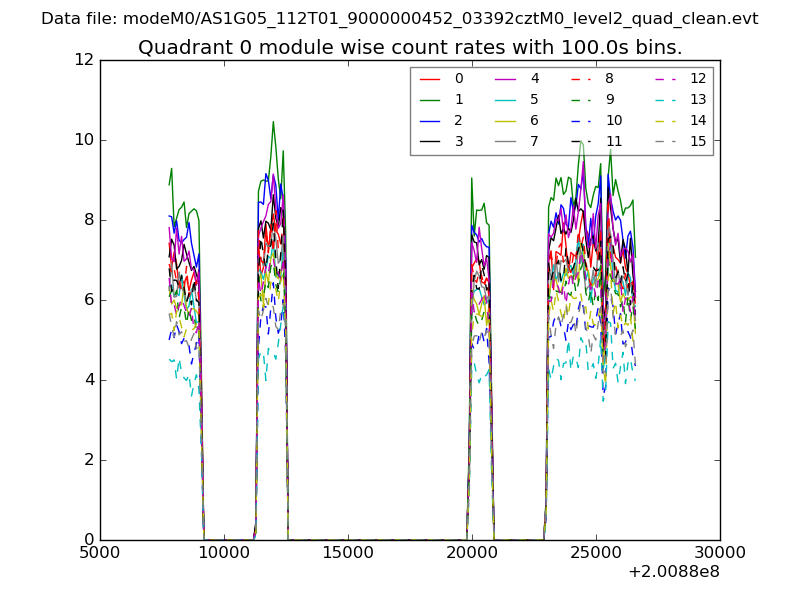 |
 |
| Module-wise count rates for Quadrant B Data is divided into 100 sec bins |
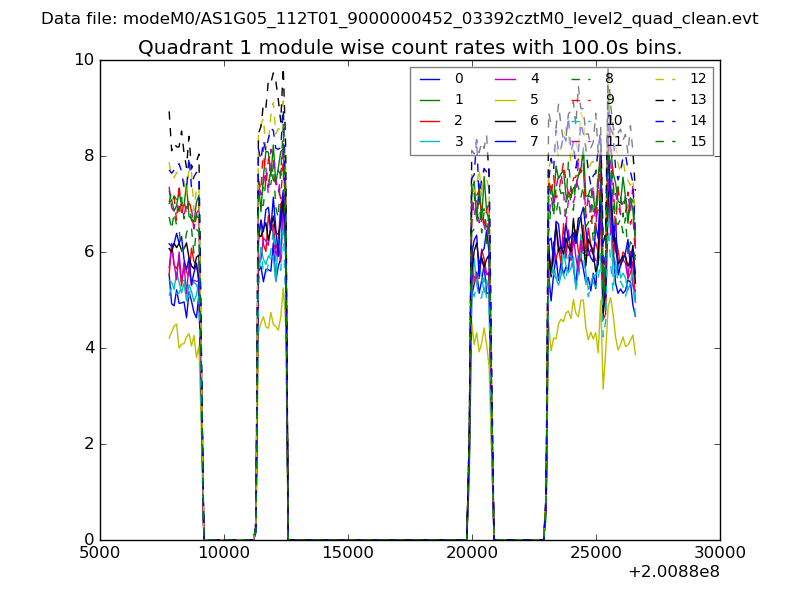 |
 |
| Module-wise count rates for Quadrant C Data is divided into 100 sec bins |
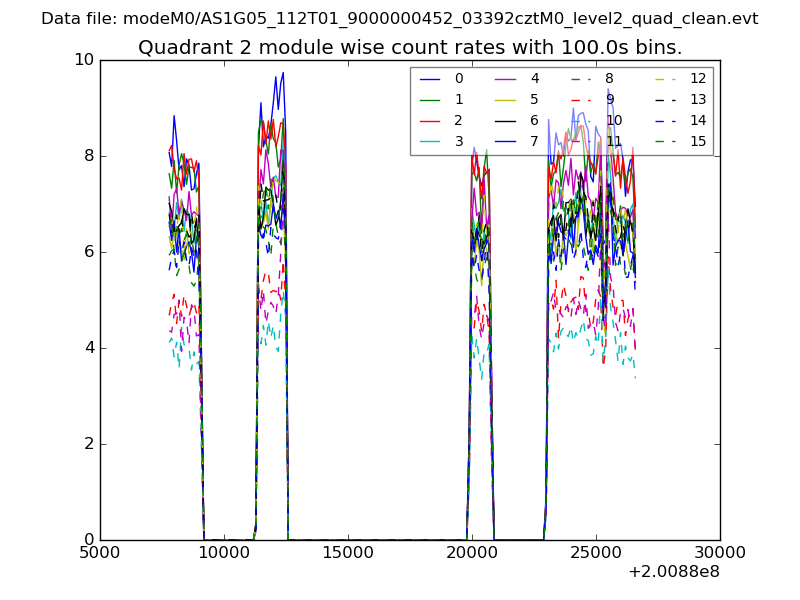 |
 |
| Module-wise count rates for Quadrant D Data is divided into 100 sec bins |
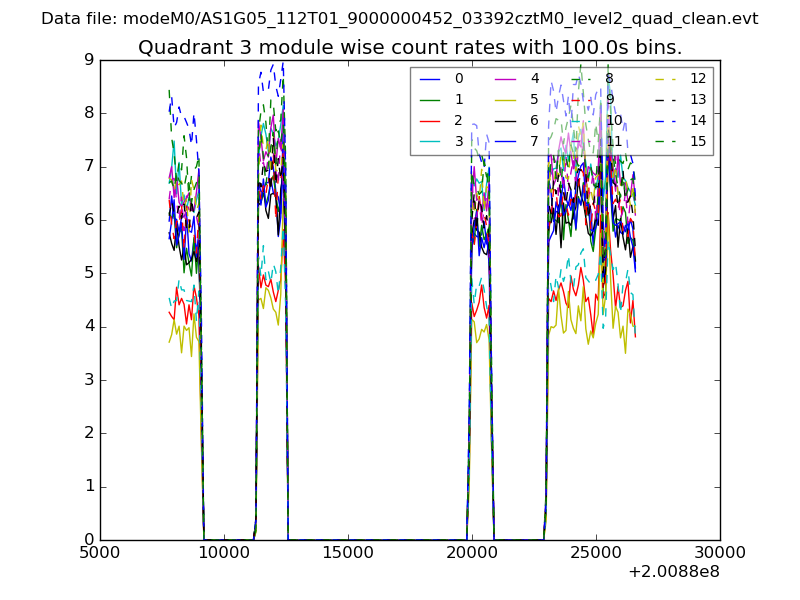 |
 |
| Parameter | Plot |
|---|---|
| CZT HV Monitor | 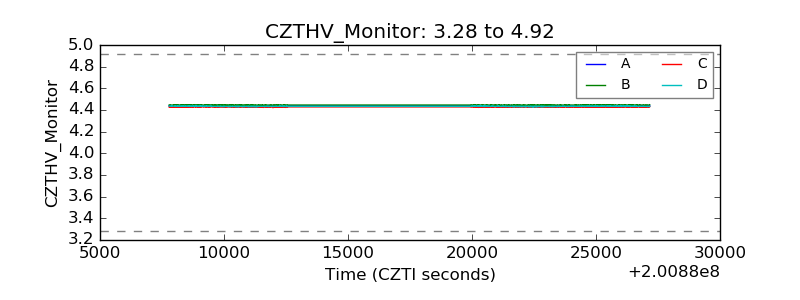 |
| D_VDD | 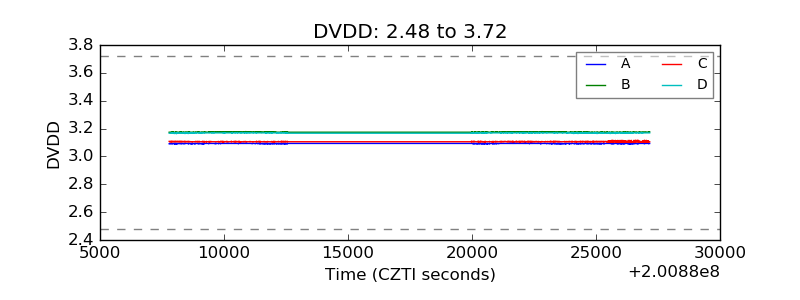 |
| Temperature 1 | 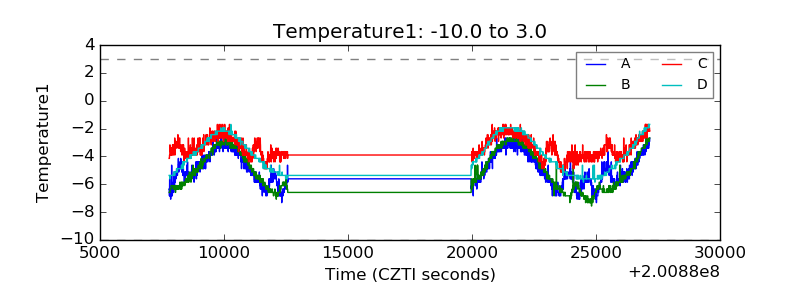 |
| Veto HV Monitor | 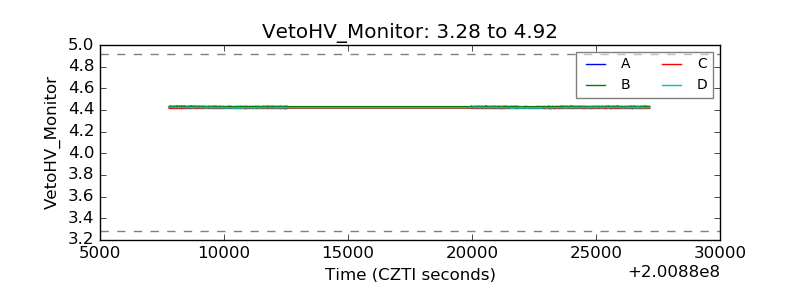 |
| Veto LLD | 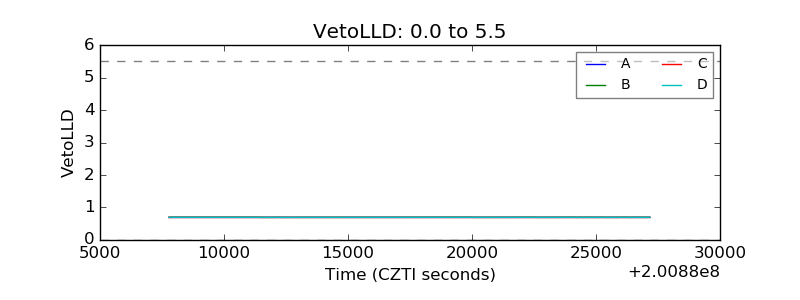 |
| Alpha Counter | 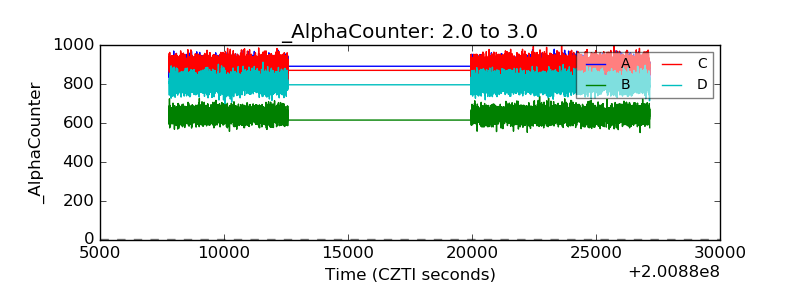 |
| _CPM_Rate | 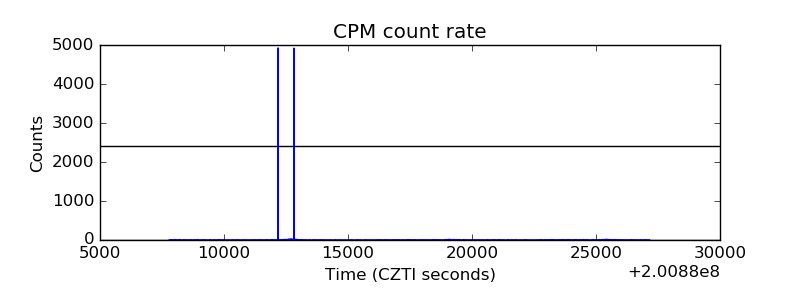 |
| CZT Counter | 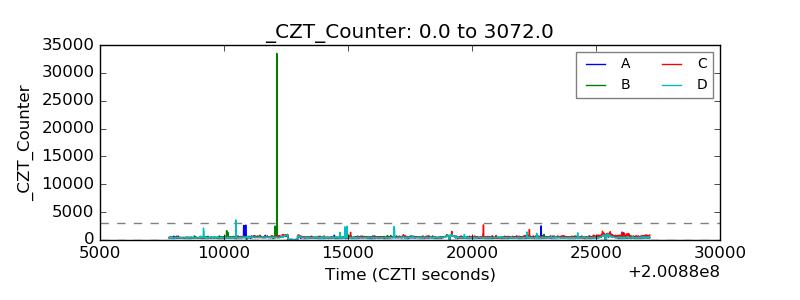 |
| +2.5 Volts monitor |  |
| +5 Volts monitor |  |
| _ROLL_ROT | 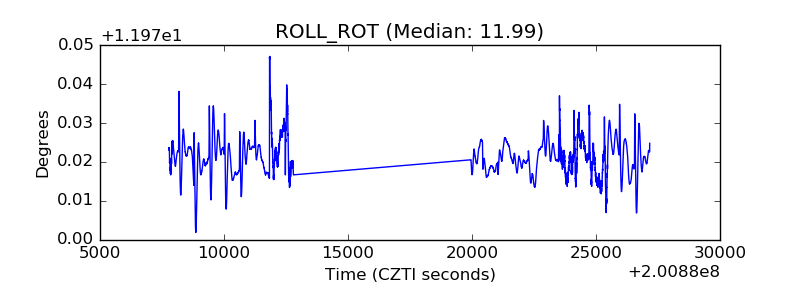 |
| _Roll_DEC | 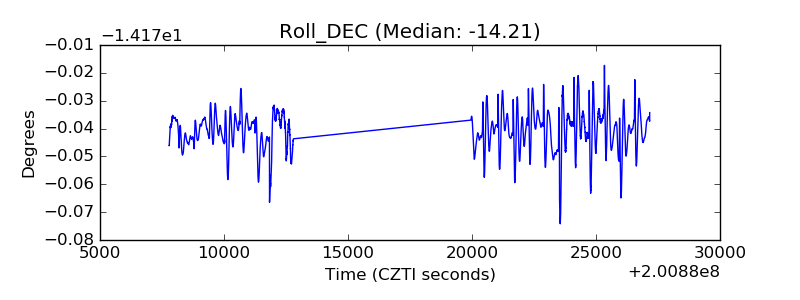 |
| _Roll_RA | 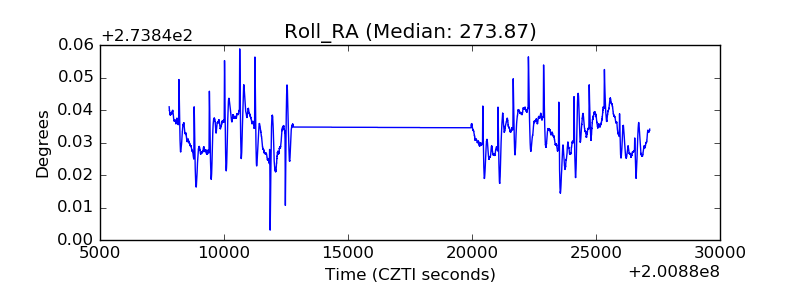 |
| Veto Counter | 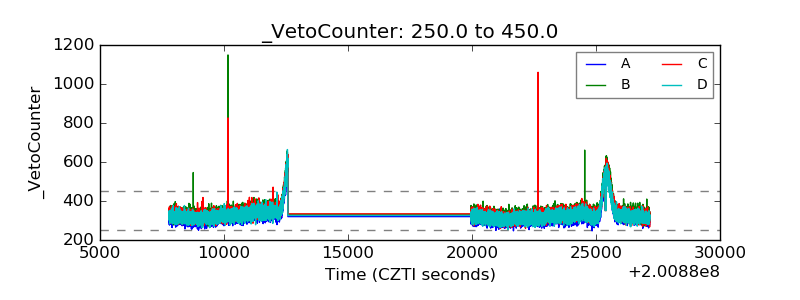 |