| Param | Original file | Final file |
|---|---|---|
| Filename | modeM0/AS1G05_112T01_9000000452_03395cztM0_level2.evt | modeM0/AS1G05_112T01_9000000452_03395cztM0_level2_quad_clean.evt |
| Size (bytes) | 916,200,000 | 128,312,640 |
| Size | 873.8 MB | 122.4 MB |
| Events in quadrant A | 6,186,933 | 744,059 |
| Events in quadrant B | 6,878,667 | 744,400 |
| Events in quadrant C | 7,687,831 | 727,767 |
| Events in quadrant D | 6,055,693 | 712,396 |
| Mode M9 | |||
|---|---|---|---|
| Quadrant | BADHDUFLAG | Total packets | Discarded packets |
| A | 0 | 9 | 0 |
| B | 0 | 9 | 0 |
| C | 0 | 9 | 0 |
| D | 0 | 9 | 0 |
| Mode SS | |||
|---|---|---|---|
| Quadrant | BADHDUFLAG | Total packets | Discarded packets |
| A | 0 | 282 | 0 |
| B | 0 | 282 | 0 |
| C | 0 | 282 | 0 |
| D | 0 | 282 | 0 |
| Mode M0 | |||
|---|---|---|---|
| Quadrant | BADHDUFLAG | Total packets | Discarded packets |
| A | 0 | 28317 | 2 |
| B | 0 | 29035 | 2 |
| C | 0 | 32728 | 2 |
| D | 0 | 28548 | 2 |
| Quadrant | Total seconds | Saturated seconds | Saturation percentage |
|---|---|---|---|
| A | 13849 | 189 | 1.364719% |
| B | 13849 | 197 | 1.422485% |
| C | 13849 | 210 | 1.516355% |
| D | 13849 | 163 | 1.176980% |
Noise dominated data is calculated using 1-second bins in cleaned event files. If a bin has >2000 counts, and if more than 50% of those come from <1% of pixels, then it is considered to be noise-dominated and hence unusable.
| Quadrant | # 1 sec bins | Bins with >0 counts | Bins with >2000 counts | High rate bins dominated by noise | Noise dominated (total time) | Noise dominated (detector-on time) | Marked lightcurve |
|---|---|---|---|---|---|---|---|
| A | 14804 | 13852 | 5 | 5 | 0.03% | 0.04% | 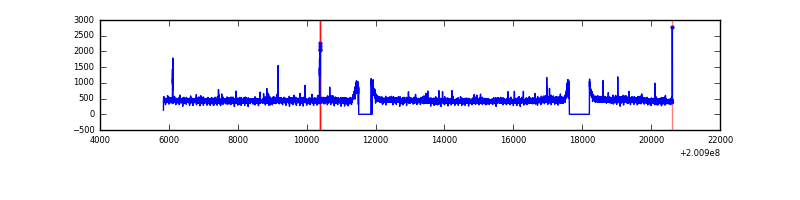 |
| B | 14804 | 13852 | 9 | 9 | 0.06% | 0.06% | 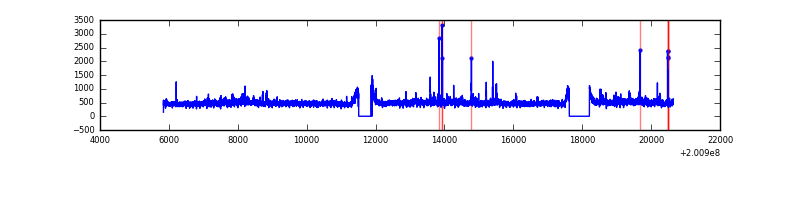 |
| C | 14804 | 13852 | 38 | 38 | 0.26% | 0.27% | 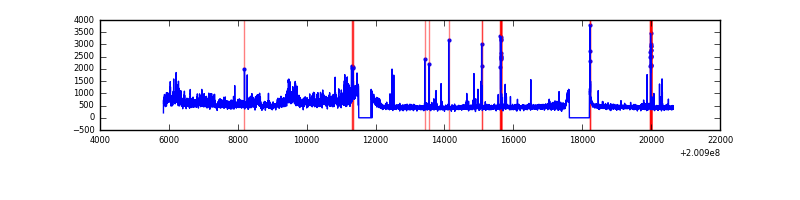 |
| D | 14804 | 13852 | 15 | 15 | 0.10% | 0.11% | 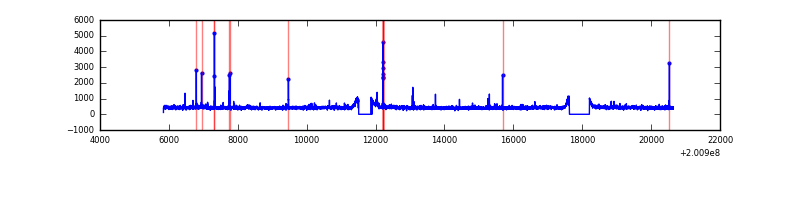 |
Top three noisy pixels from each quadrant. If the there are fewer than three noisy pixels in the level2.evt file, extra rows are filled as -1
| Pixel properties | Quadrant properties | ||||||
|---|---|---|---|---|---|---|---|
| Quadrant | DetID | PixID | Counts | Sigma | Mean | Median | Sigma |
| A | 0 | 118 | 35261 | 102.82 | 1591 | 1555 | 327.8 |
| A | 0 | 226 | 19177 | 53.75 | 1591 | 1555 | 327.8 |
| A | 12 | 194 | 16679 | 46.13 | 1591 | 1555 | 327.8 |
| B | 15 | 204 | 465379 | 1481.66 | 1610 | 1570 | 313.0 |
| B | 0 | 229 | 70040 | 218.73 | 1610 | 1570 | 313.0 |
| B | 14 | 167 | 26620 | 80.02 | 1610 | 1570 | 313.0 |
| C | 9 | 144 | 1189803 | 3287.12 | 1542 | 1551 | 361.5 |
| C | 1 | 192 | 276147 | 759.63 | 1542 | 1551 | 361.5 |
| C | 14 | 223 | 94180 | 256.24 | 1542 | 1551 | 361.5 |
| D | 13 | 223 | 76074 | 196.79 | 1550 | 1500 | 379.0 |
| D | 2 | 206 | 41319 | 105.08 | 1550 | 1500 | 379.0 |
| D | 10 | 34 | 26406 | 65.72 | 1550 | 1500 | 379.0 |
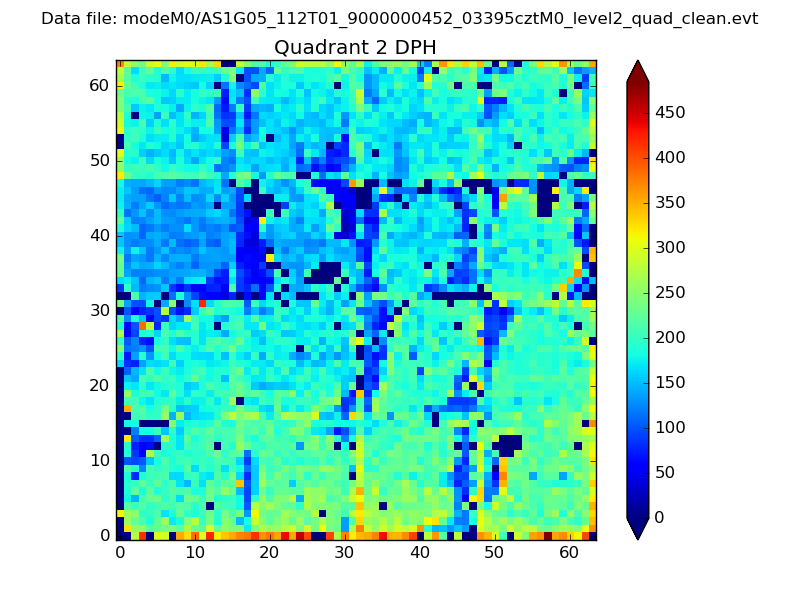
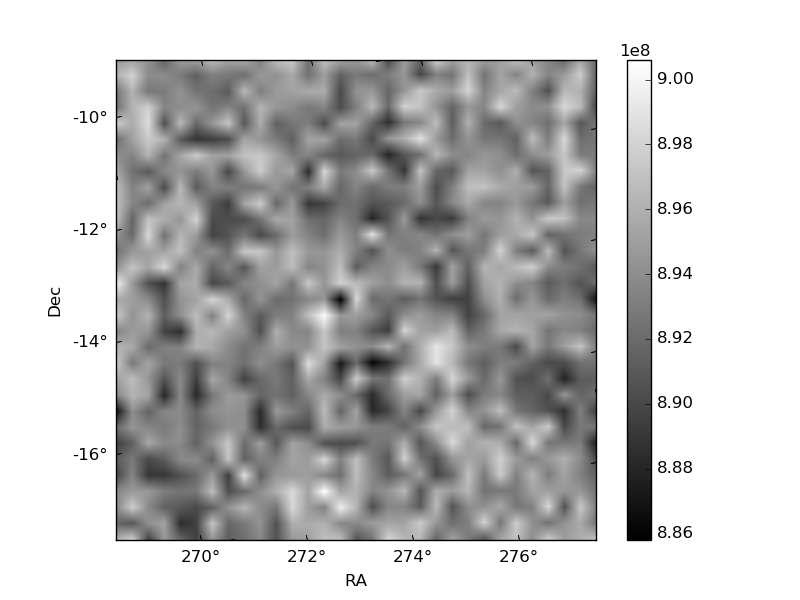
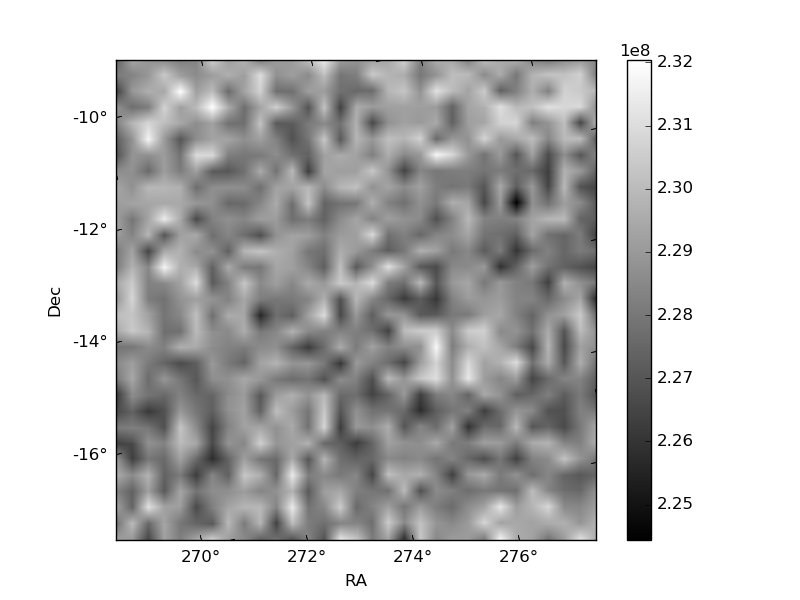
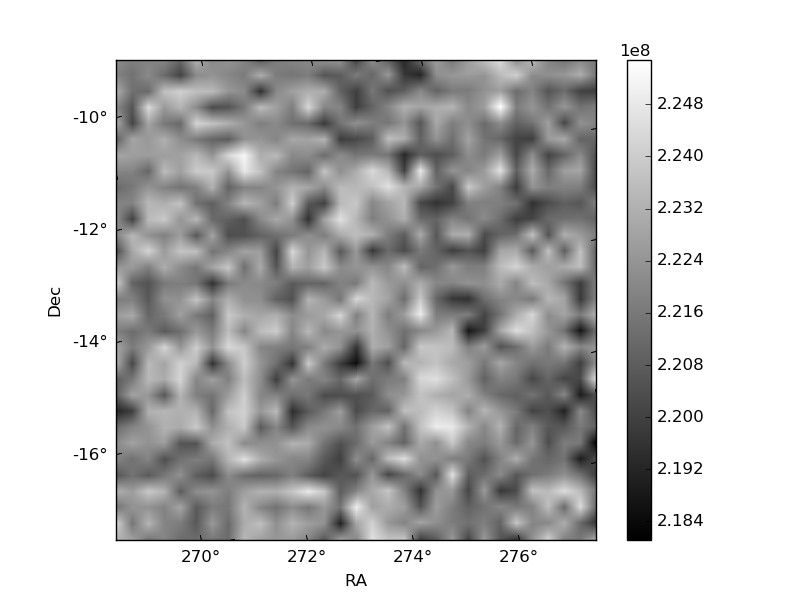
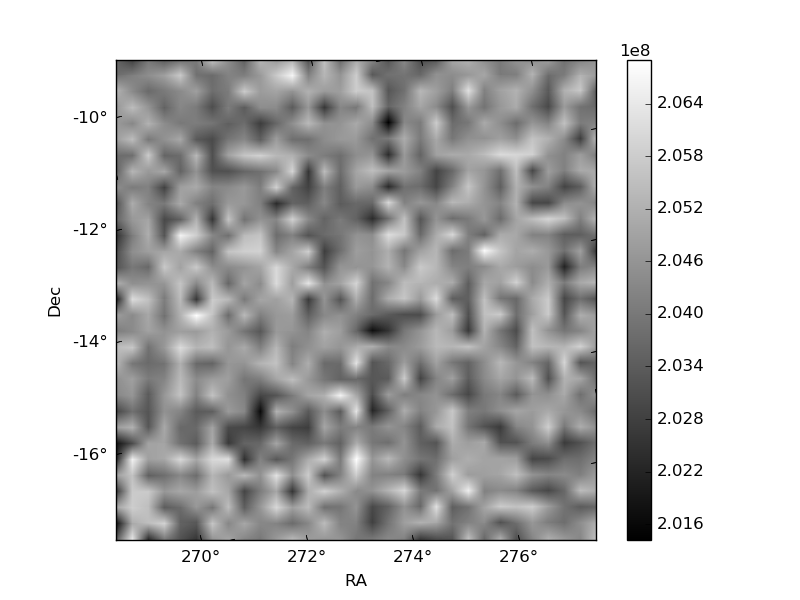
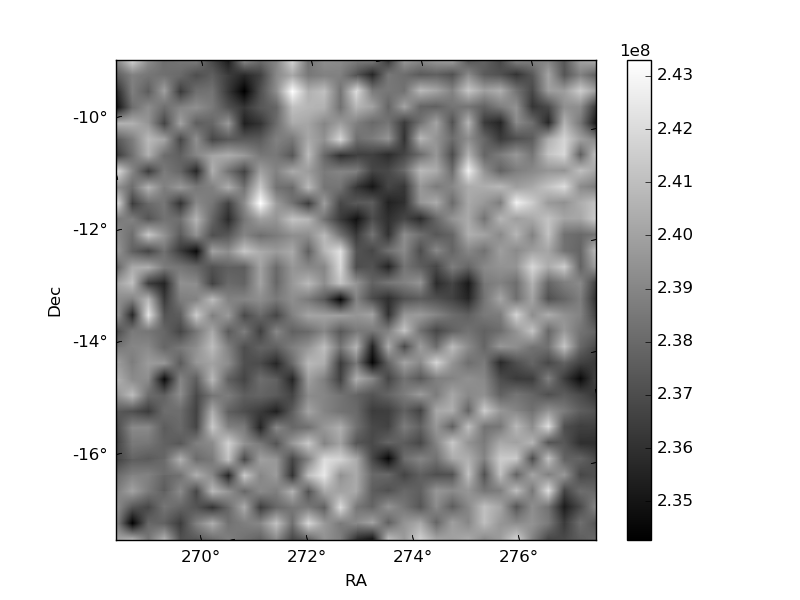
Histogram calculated using DETX and DETY for each event in the final _common_clean file
| Quadrant A | 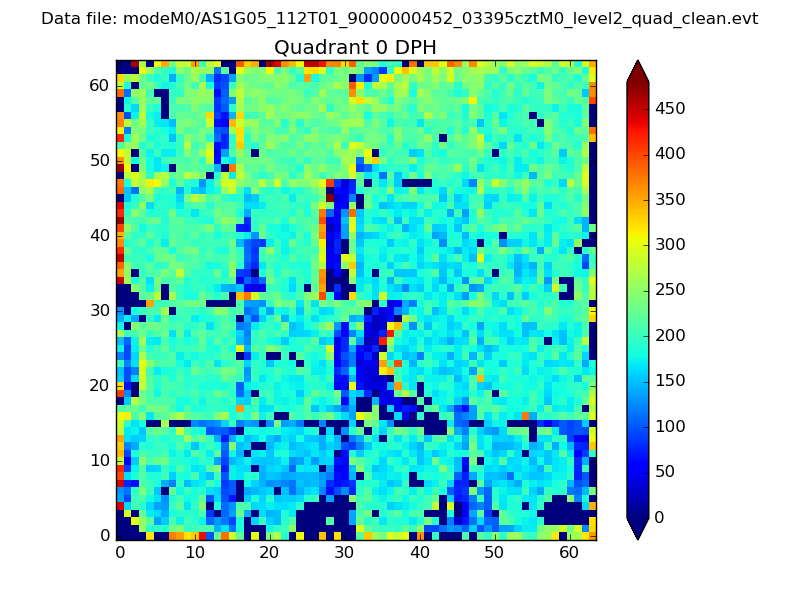 |
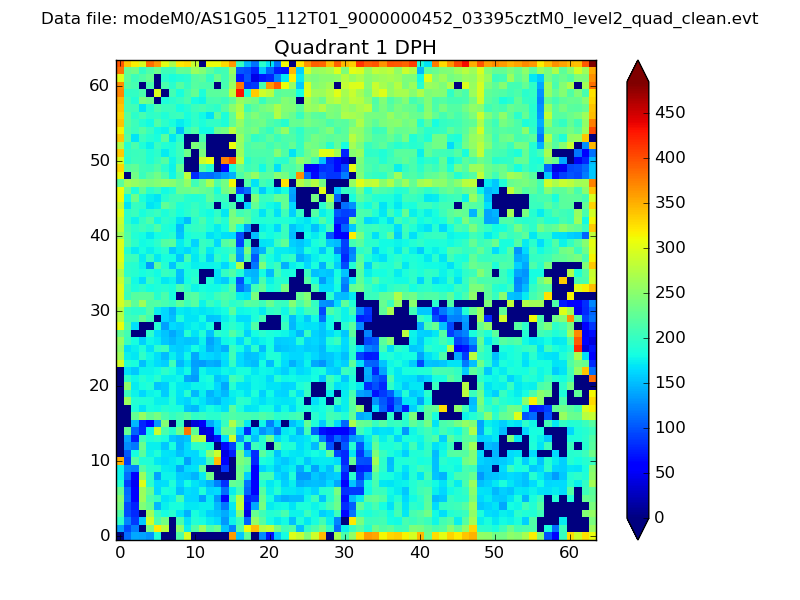 |
Quadrant B |
|---|---|---|---|
| Quadrant D | 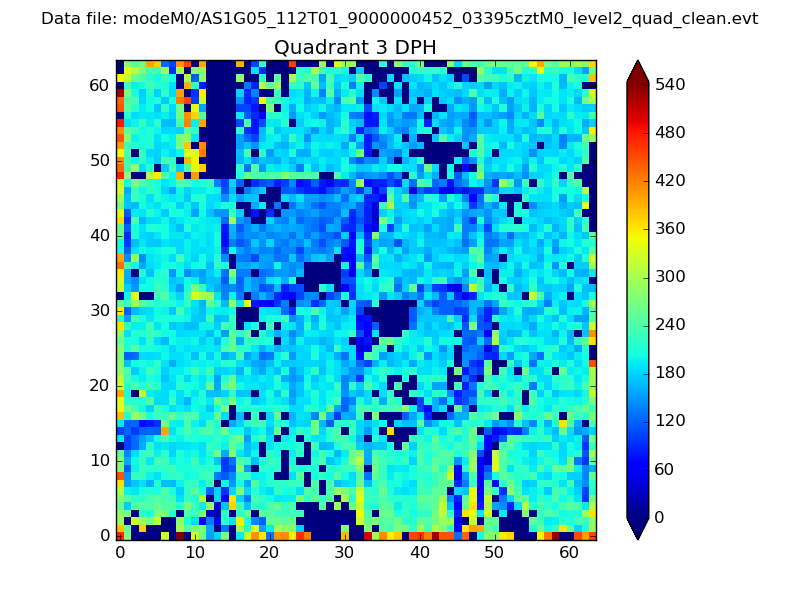 |
 |
Quadrant C |
| Plot type | Count rate plots | Images |
|---|---|---|
| Comparison with Poisson distribution Blue bars denote a histogram of data divided into 1 sec bins. Red curve is a Poisson curve with rate = median count rate of data. |
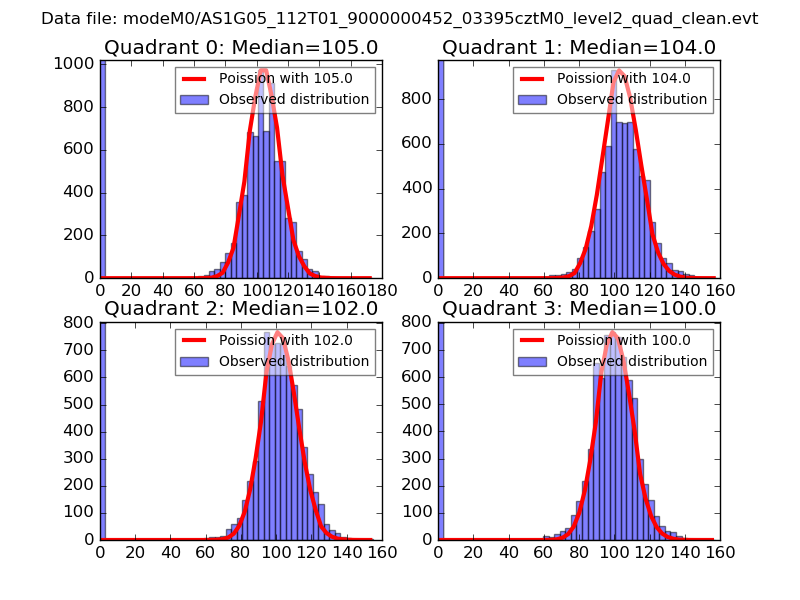 |
 |
| Quadrant-wise count rates Data is divided into 100 sec bins |
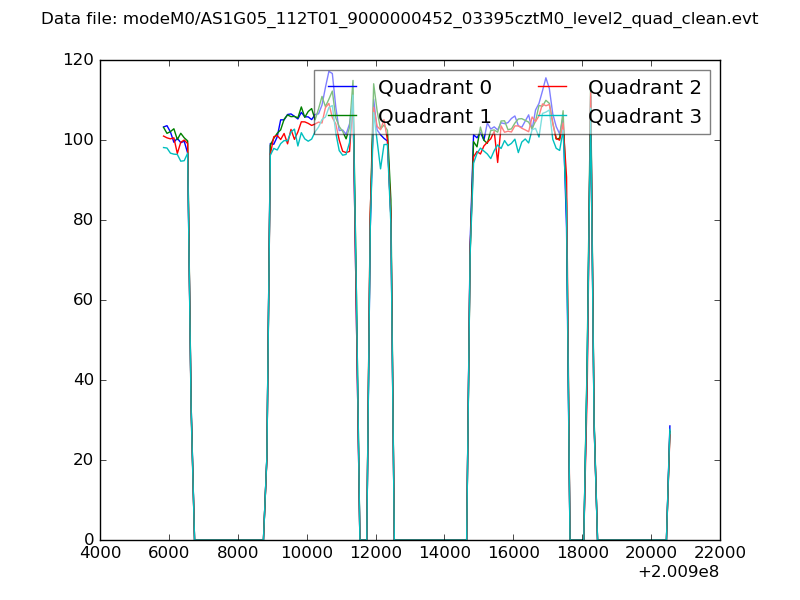 |
|
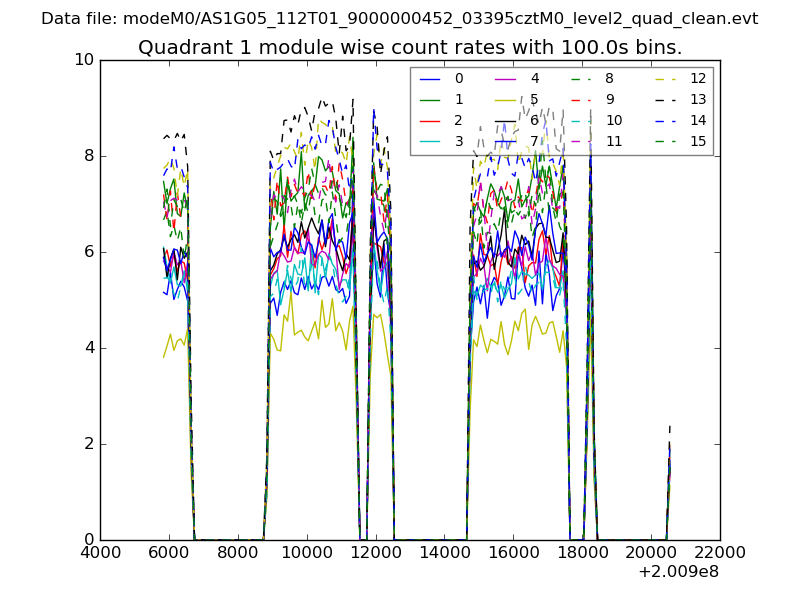
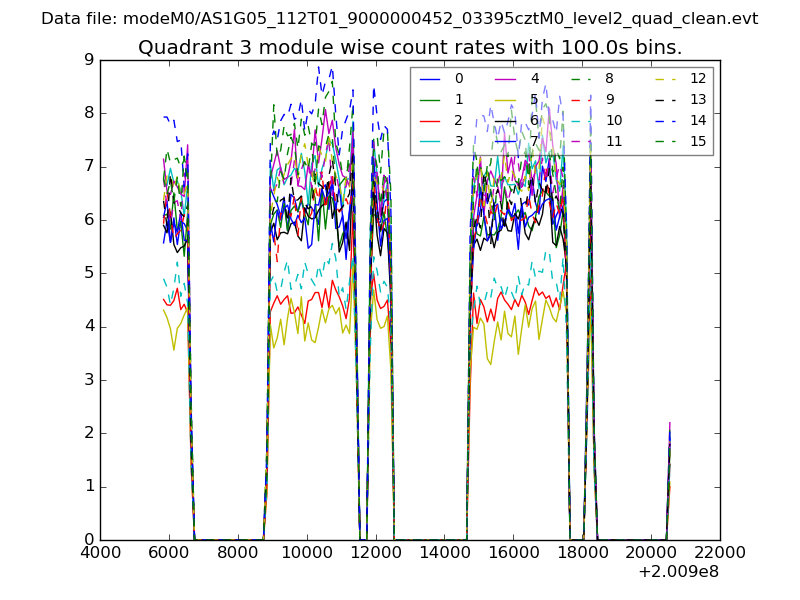
| Module-wise count rates for Quadrant A Data is divided into 100 sec bins |
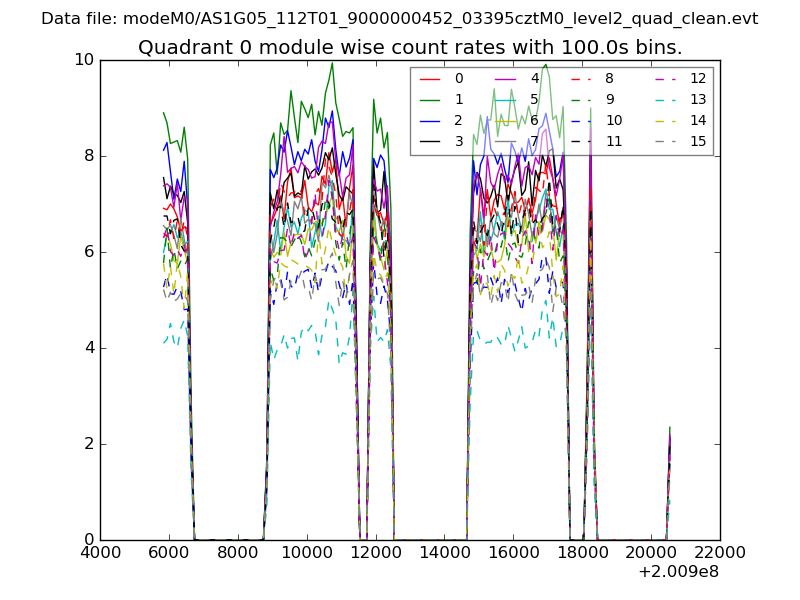 |
 |
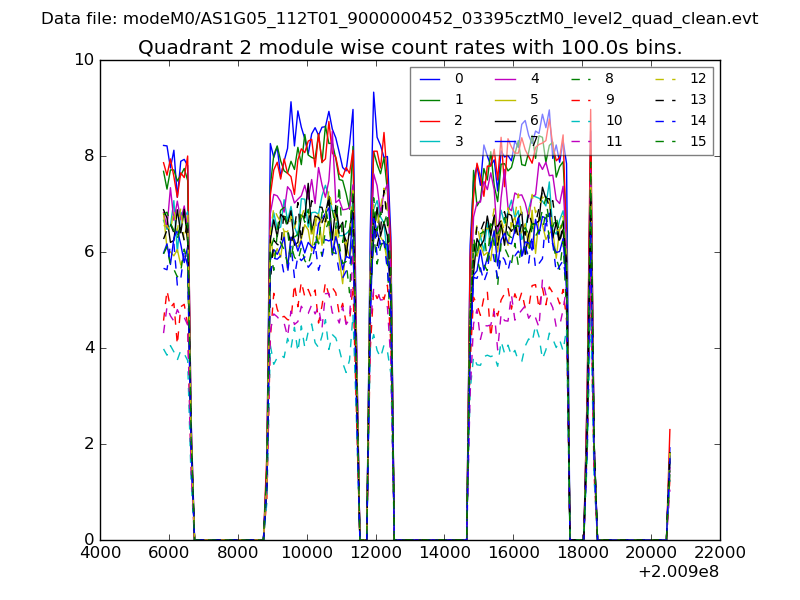
| Module-wise count rates for Quadrant B Data is divided into 100 sec bins |
 |
 |
| Module-wise count rates for Quadrant C Data is divided into 100 sec bins |
 |
 |
| Module-wise count rates for Quadrant D Data is divided into 100 sec bins |
 |
 |
| Parameter | Plot |
|---|---|
| CZT HV Monitor | 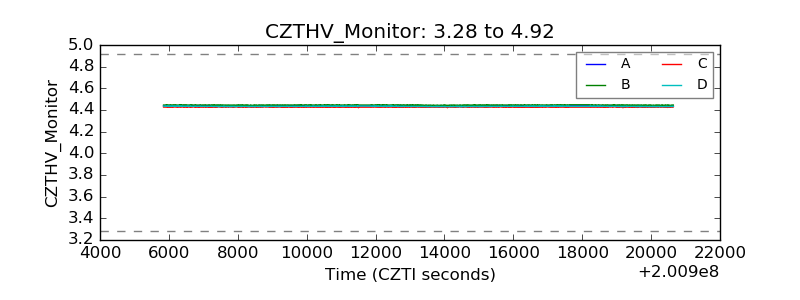 |
| D_VDD | 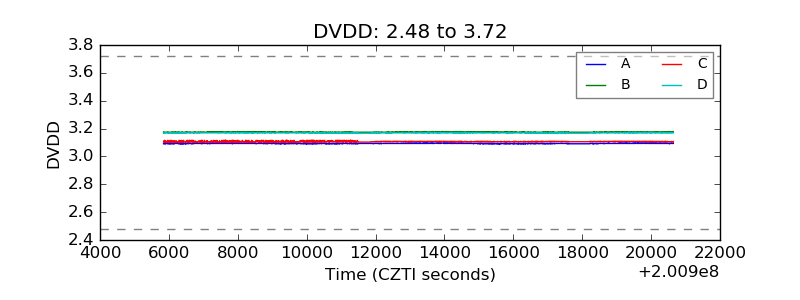 |
| Temperature 1 | 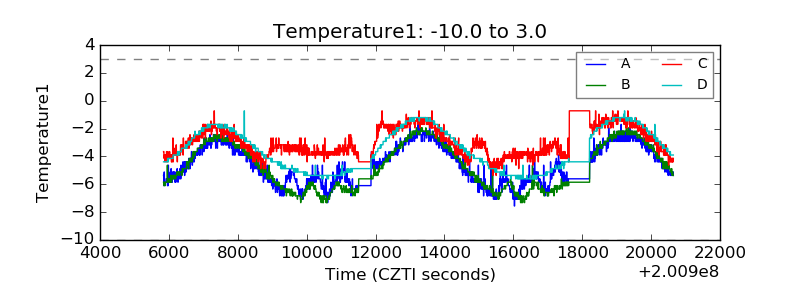 |
| Veto HV Monitor | 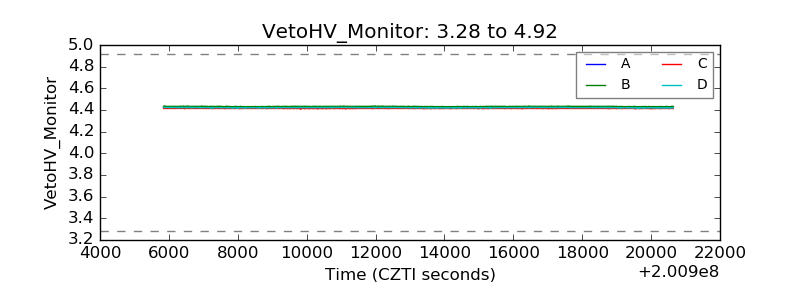 |
| Veto LLD | 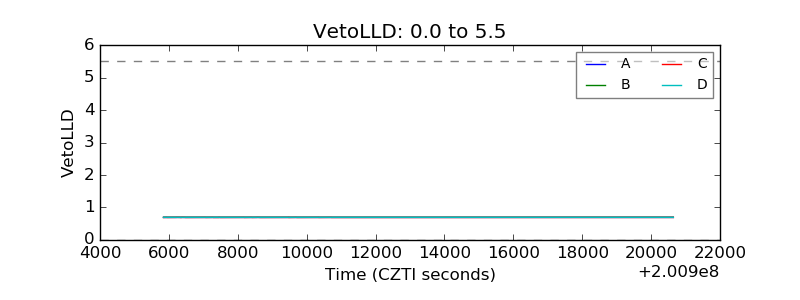 |
| Alpha Counter | 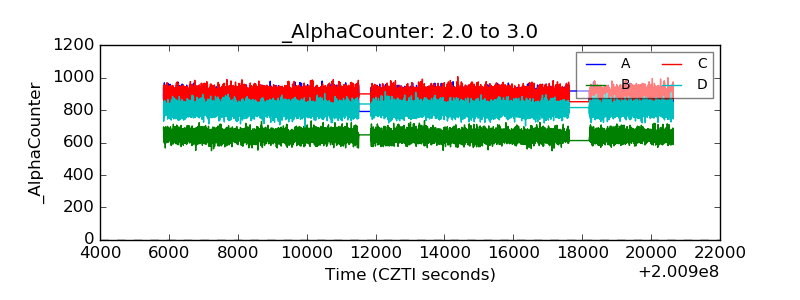 |
| _CPM_Rate | 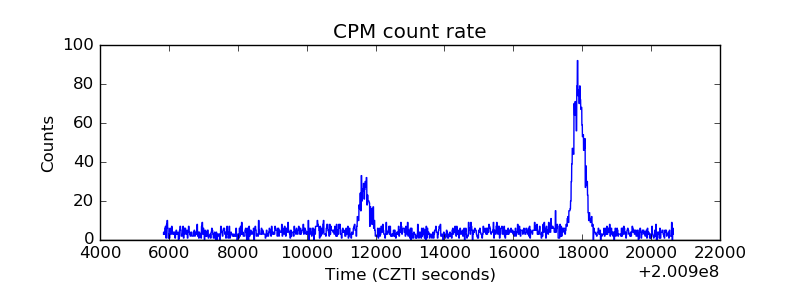 |
| CZT Counter | 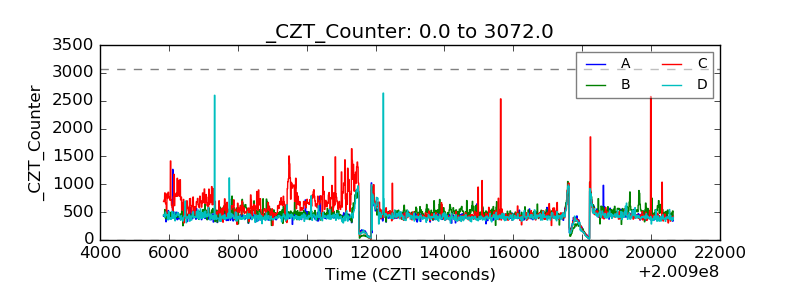 |
| +2.5 Volts monitor | 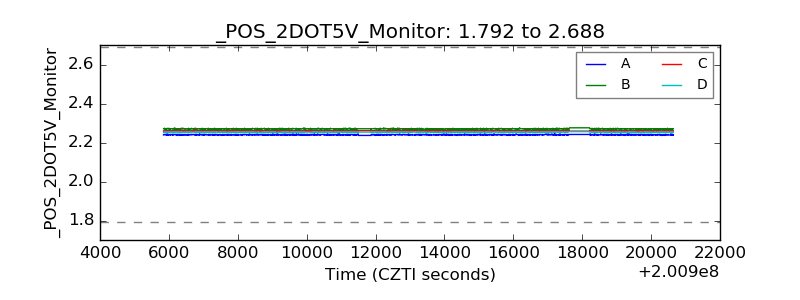 |
| +5 Volts monitor |  |
| _ROLL_ROT | 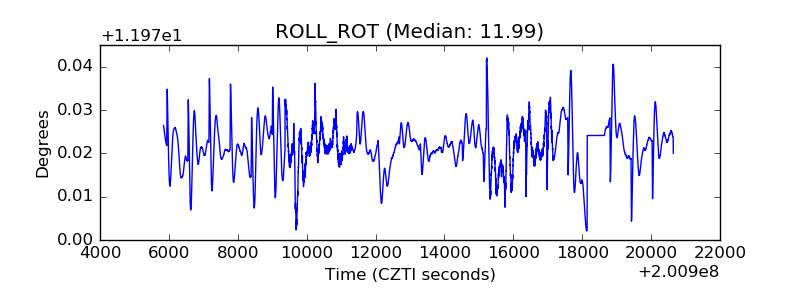 |
| _Roll_DEC | 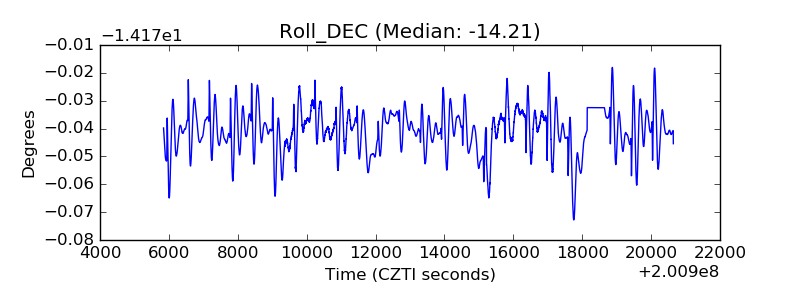 |
| _Roll_RA | 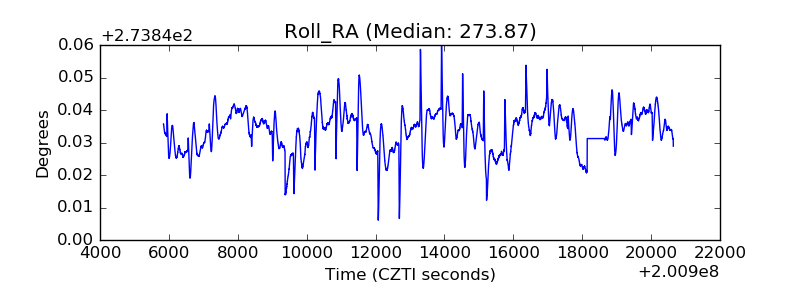 |
| Veto Counter | 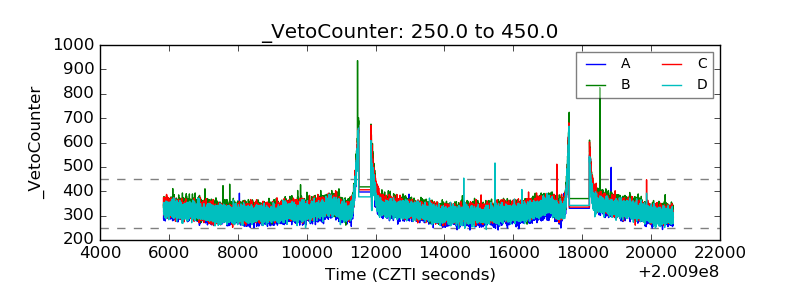 |