| Param | Original file | Final file |
|---|---|---|
| Filename | modeM0/AS1G05_210T01_9000000454_03395cztM0_level2.evt | modeM0/AS1G05_210T01_9000000454_03395cztM0_level2_quad_clean.evt |
| Size (bytes) | 223,640,640 | 33,154,560 |
| Size | 213.3 MB | 31.6 MB |
| Events in quadrant A | 1,578,167 | 192,601 |
| Events in quadrant B | 1,799,937 | 193,062 |
| Events in quadrant C | 1,632,886 | 191,073 |
| Events in quadrant D | 1,530,000 | 186,669 |
| Mode M9 | |||
|---|---|---|---|
| Quadrant | BADHDUFLAG | Total packets | Discarded packets |
| A | 0 | 8 | 0 |
| B | 0 | 8 | 0 |
| C | 0 | 8 | 0 |
| D | 0 | 8 | 0 |
| Mode SS | |||
|---|---|---|---|
| Quadrant | BADHDUFLAG | Total packets | Discarded packets |
| A | 0 | 68 | 0 |
| B | 0 | 68 | 0 |
| C | 0 | 68 | 0 |
| D | 0 | 68 | 0 |
| Mode M0 | |||
|---|---|---|---|
| Quadrant | BADHDUFLAG | Total packets | Discarded packets |
| A | 0 | 6961 | 2 |
| B | 0 | 7493 | 1 |
| C | 0 | 7086 | 1 |
| D | 0 | 7027 | 1 |
| Quadrant | Total seconds | Saturated seconds | Saturation percentage |
|---|---|---|---|
| A | 3388 | 95 | 2.804014% |
| B | 3388 | 107 | 3.158205% |
| C | 3388 | 81 | 2.390791% |
| D | 3388 | 75 | 2.213695% |
Noise dominated data is calculated using 1-second bins in cleaned event files. If a bin has >2000 counts, and if more than 50% of those come from <1% of pixels, then it is considered to be noise-dominated and hence unusable.
| Quadrant | # 1 sec bins | Bins with >0 counts | Bins with >2000 counts | High rate bins dominated by noise | Noise dominated (total time) | Noise dominated (detector-on time) | Marked lightcurve |
|---|---|---|---|---|---|---|---|
| A | 4108 | 3389 | 0 | 0 | 0.00% | 0.00% | 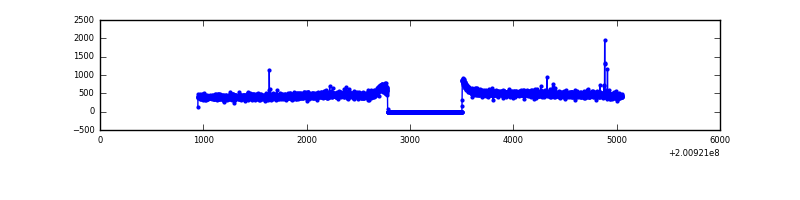 |
| B | 4108 | 3389 | 14 | 14 | 0.34% | 0.41% | 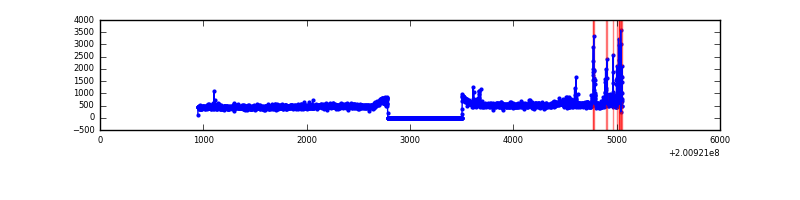 |
| C | 4108 | 3389 | 3 | 3 | 0.07% | 0.09% | 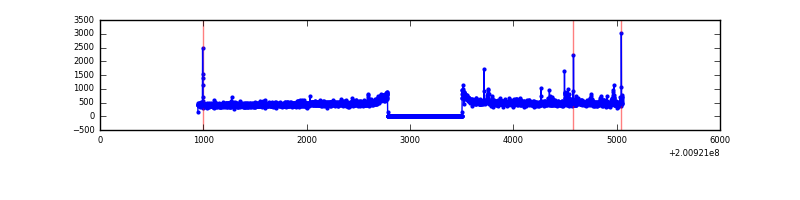 |
| D | 4108 | 3389 | 2 | 2 | 0.05% | 0.06% | 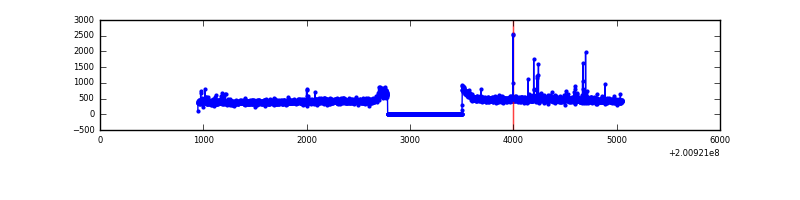 |
Top three noisy pixels from each quadrant. If the there are fewer than three noisy pixels in the level2.evt file, extra rows are filled as -1
| Pixel properties | Quadrant properties | ||||||
|---|---|---|---|---|---|---|---|
| Quadrant | DetID | PixID | Counts | Sigma | Mean | Median | Sigma |
| A | 0 | 118 | 9654 | 107.34 | 407 | 397 | 86.2 |
| A | 0 | 226 | 5035 | 53.78 | 407 | 397 | 86.2 |
| A | 12 | 194 | 4215 | 44.27 | 407 | 397 | 86.2 |
| B | 2 | 249 | 97462 | 1168.98 | 412 | 401 | 83.0 |
| B | 15 | 204 | 53528 | 639.85 | 412 | 401 | 83.0 |
| B | 4 | 81 | 29451 | 349.87 | 412 | 401 | 83.0 |
| C | 14 | 223 | 27397 | 288.38 | 396 | 396 | 93.6 |
| C | 1 | 192 | 16786 | 175.05 | 396 | 396 | 93.6 |
| C | 9 | 54 | 12056 | 124.53 | 396 | 396 | 93.6 |
| D | 2 | 206 | 29024 | 295.26 | 392 | 378 | 97.0 |
| D | 5 | 233 | 7688 | 75.34 | 392 | 378 | 97.0 |
| D | 10 | 172 | 6073 | 58.7 | 392 | 378 | 97.0 |
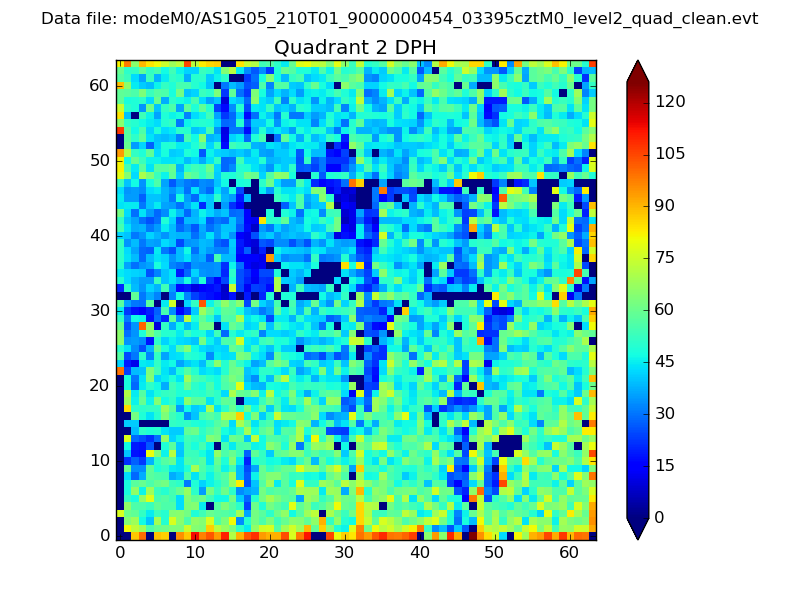
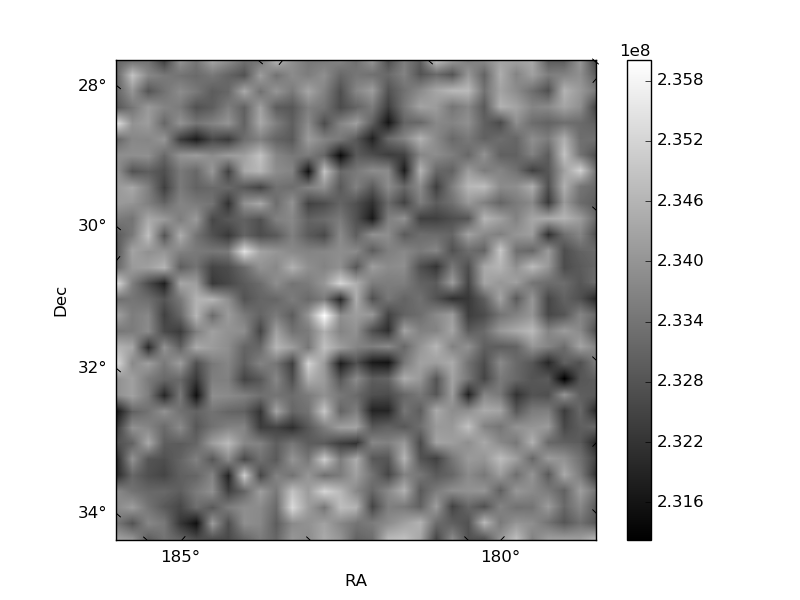
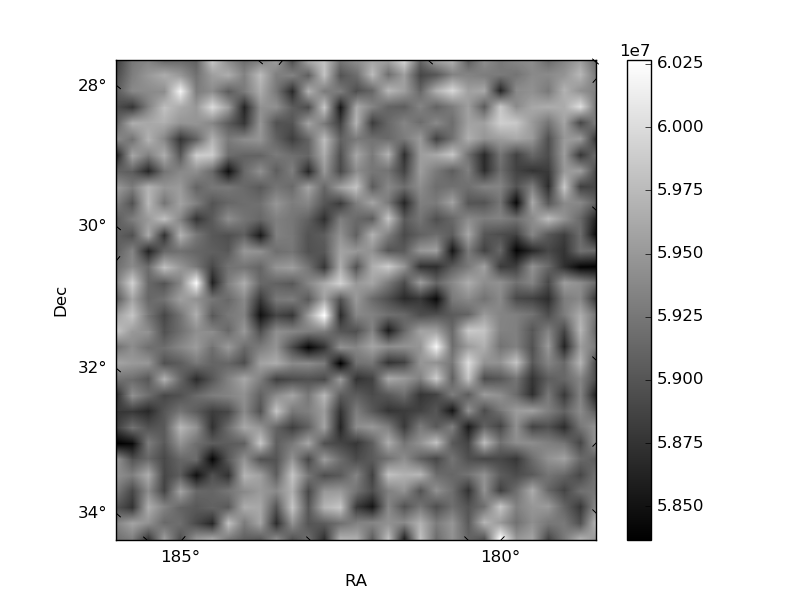
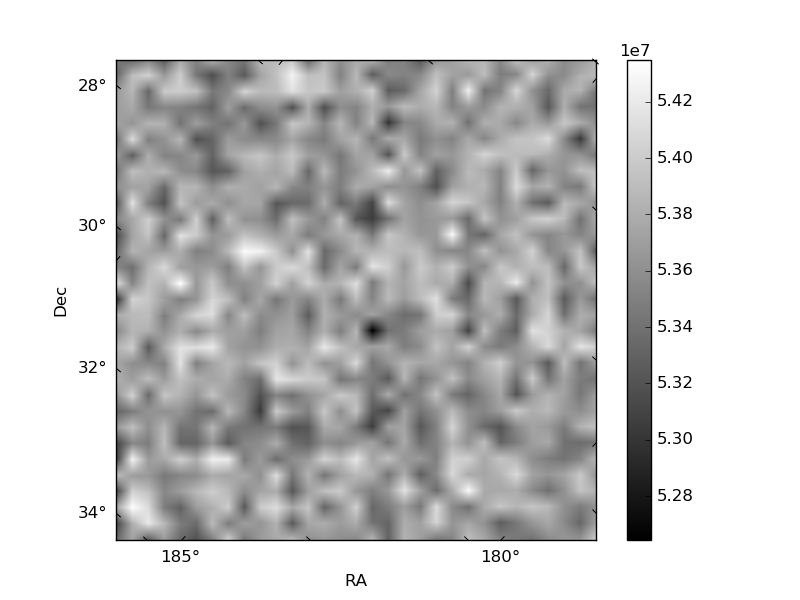
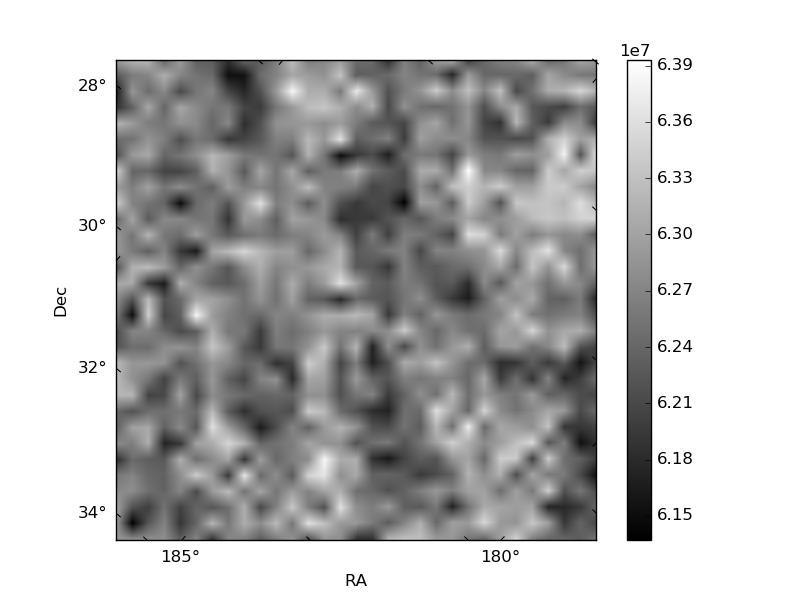
Histogram calculated using DETX and DETY for each event in the final _common_clean file
| Quadrant A | 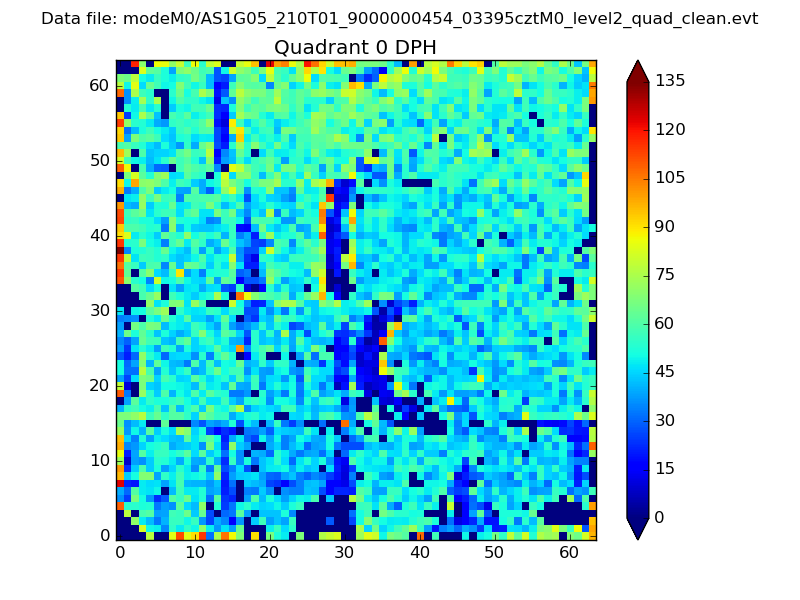 |
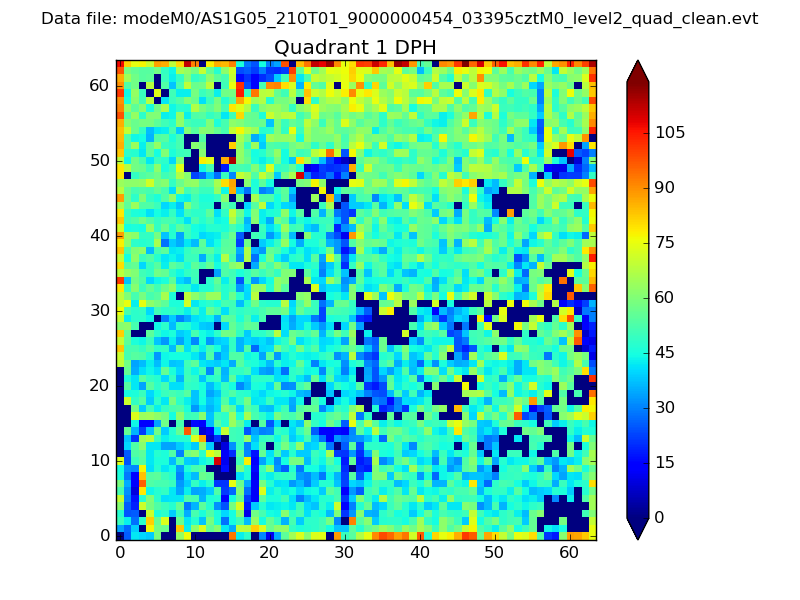 |
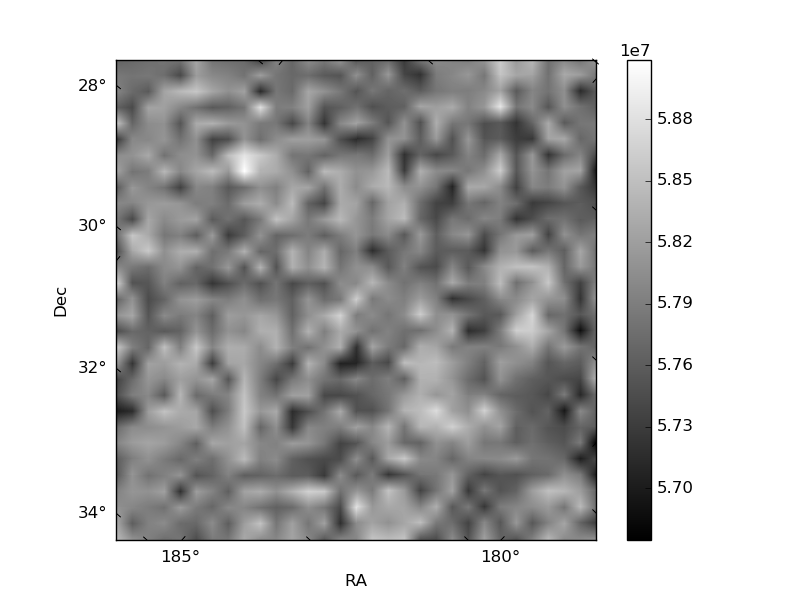
Quadrant B |
|---|---|---|---|
| Quadrant D | 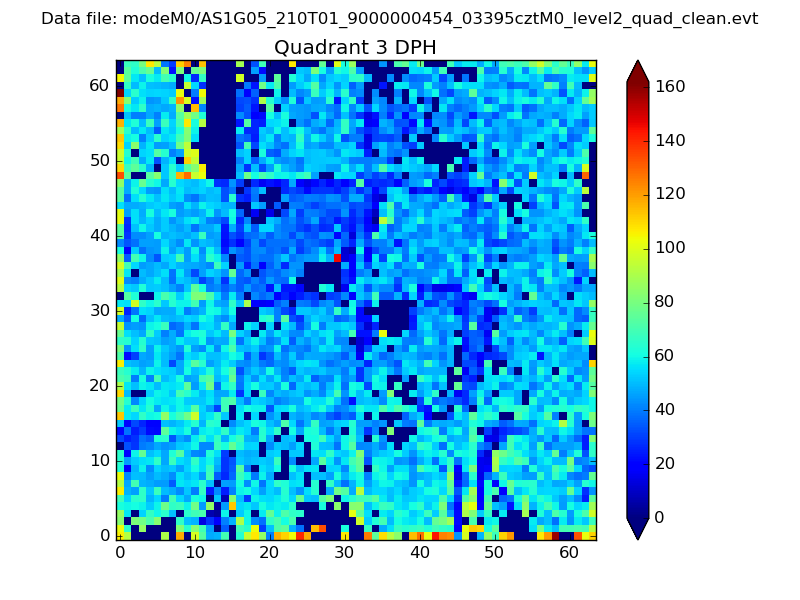 |
 |
Quadrant C |
| Plot type | Count rate plots | Images |
|---|---|---|
| Comparison with Poisson distribution Blue bars denote a histogram of data divided into 1 sec bins. Red curve is a Poisson curve with rate = median count rate of data. |
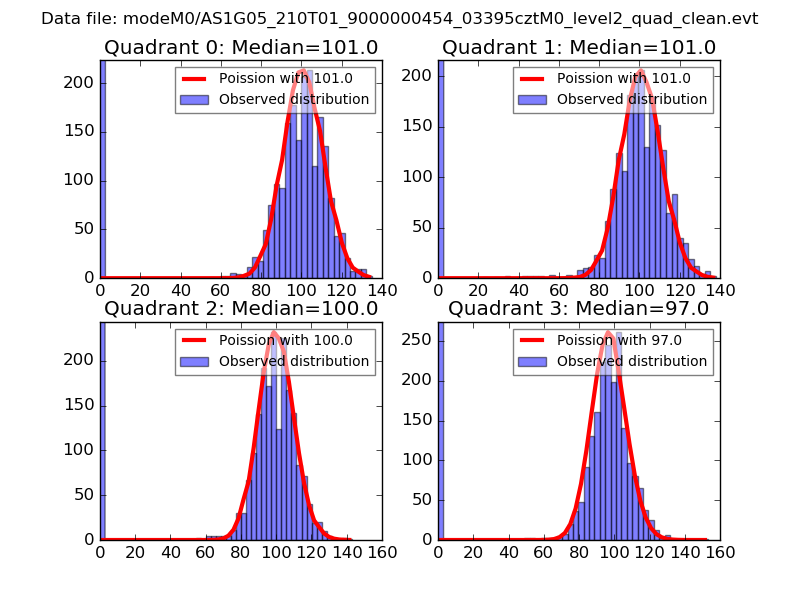 |
 |
| Quadrant-wise count rates Data is divided into 100 sec bins |
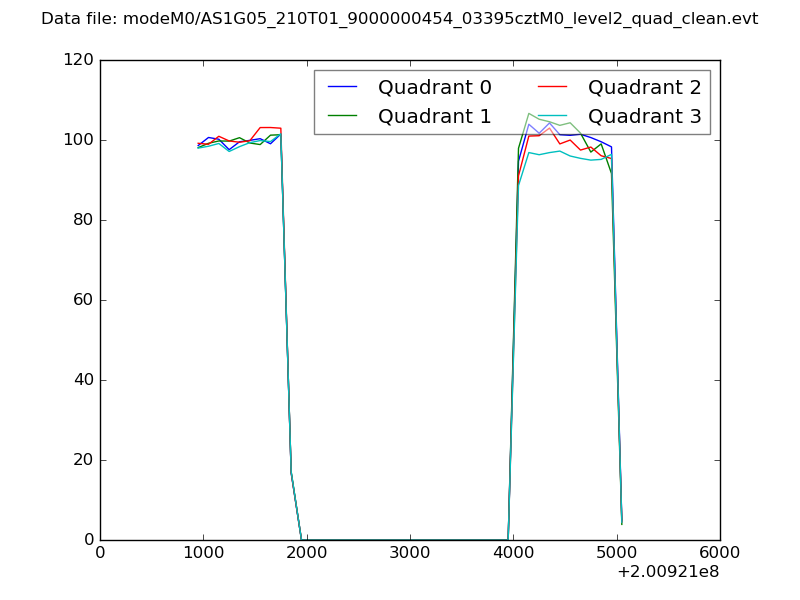 |
|
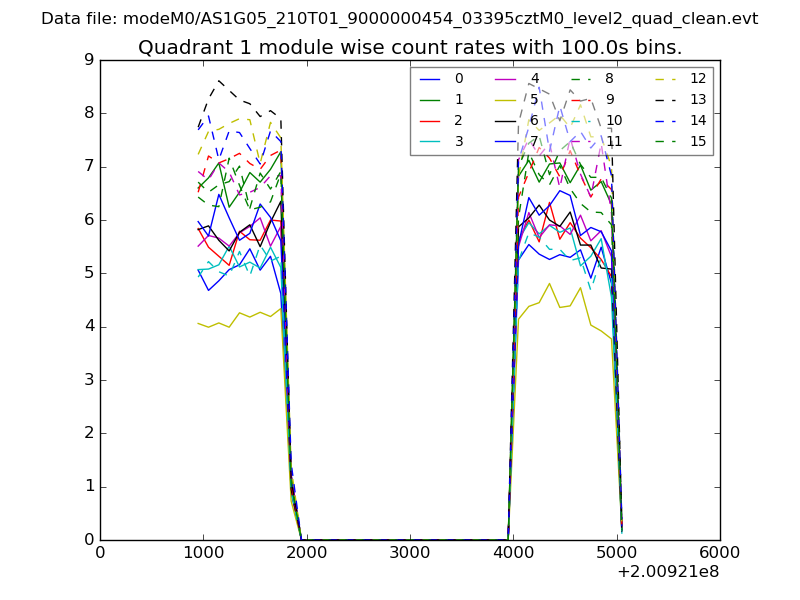
| Module-wise count rates for Quadrant A Data is divided into 100 sec bins |
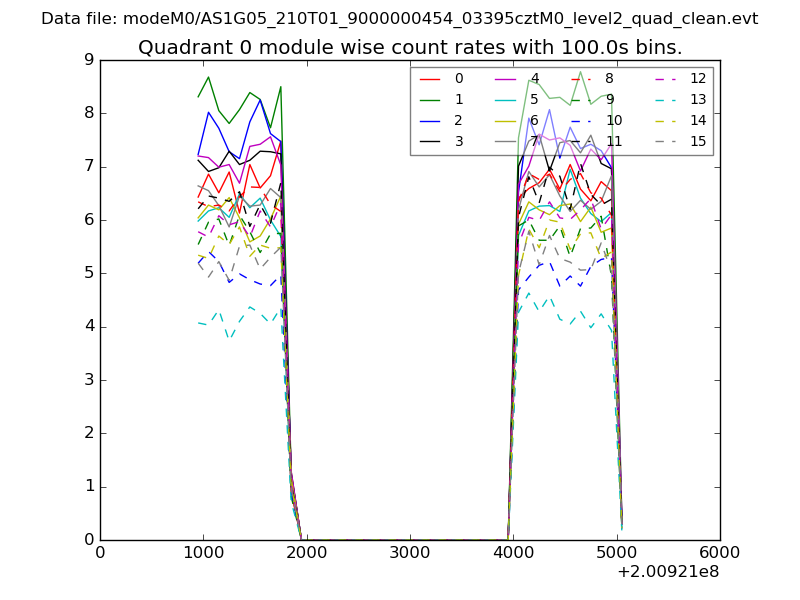 |
 |
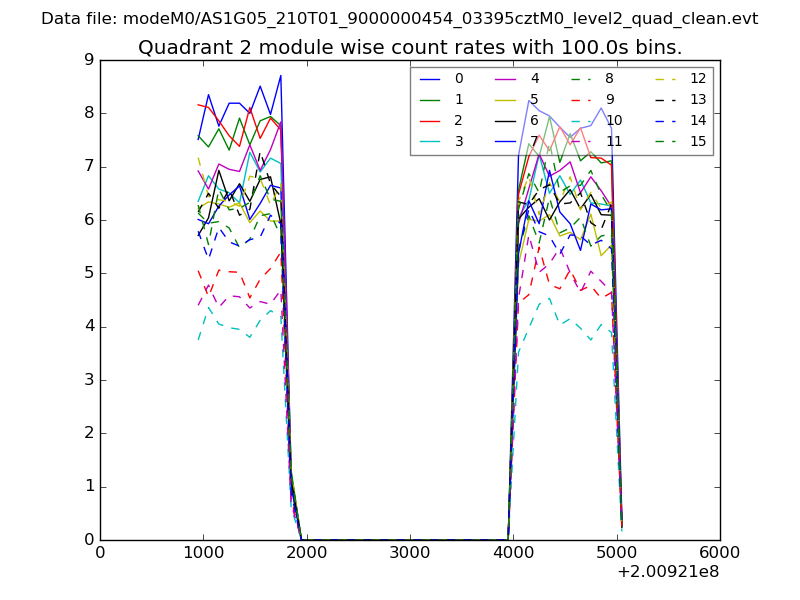
| Module-wise count rates for Quadrant B Data is divided into 100 sec bins |
 |
 |
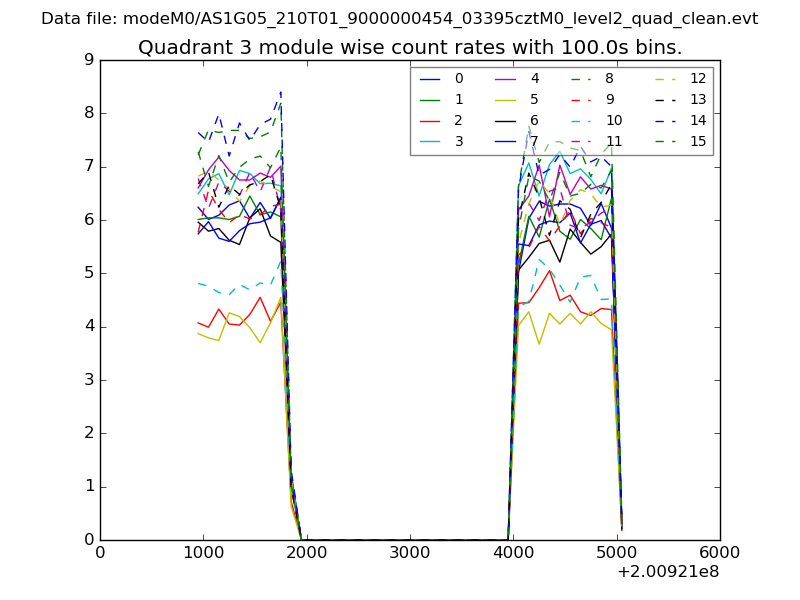
| Module-wise count rates for Quadrant C Data is divided into 100 sec bins |
 |
 |
| Module-wise count rates for Quadrant D Data is divided into 100 sec bins |
 |
 |
| Parameter | Plot |
|---|---|
| CZT HV Monitor | 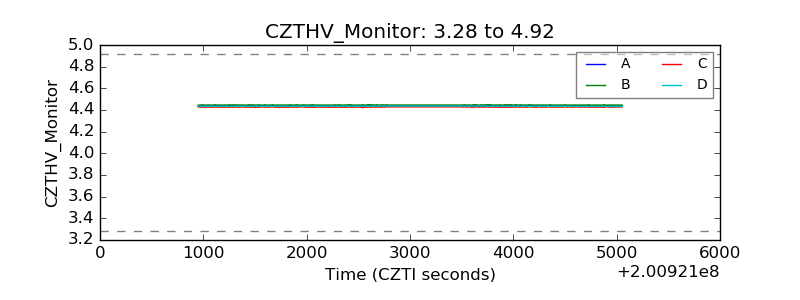 |
| D_VDD | 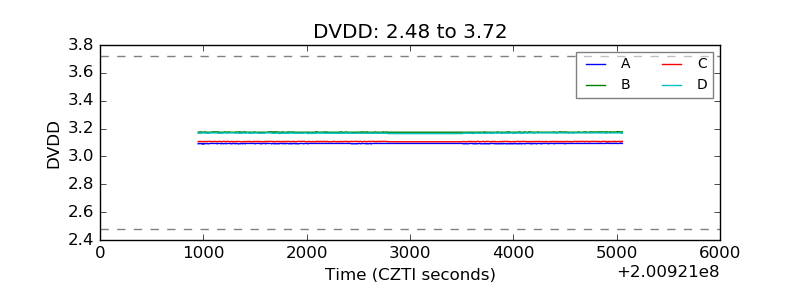 |
| Temperature 1 | 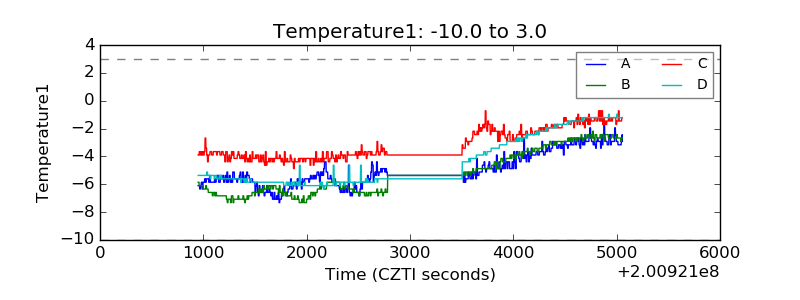 |
| Veto HV Monitor | 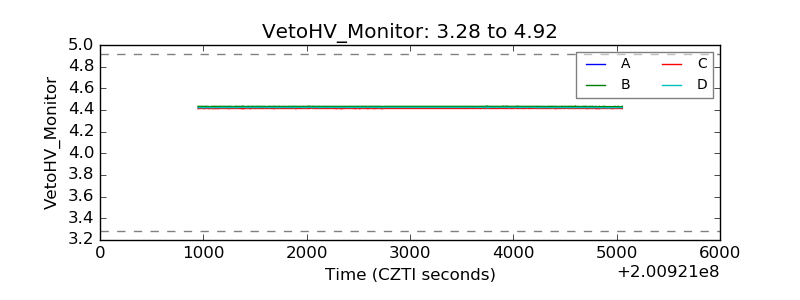 |
| Veto LLD | 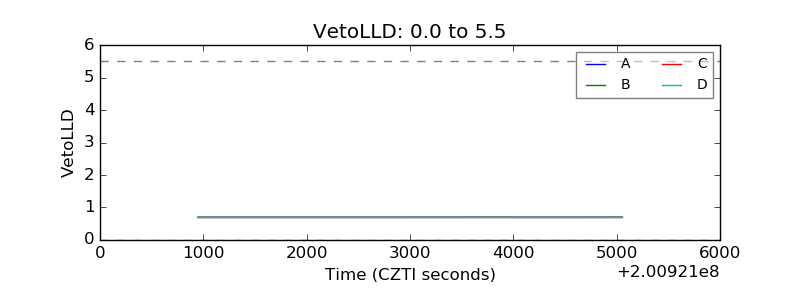 |
| Alpha Counter | 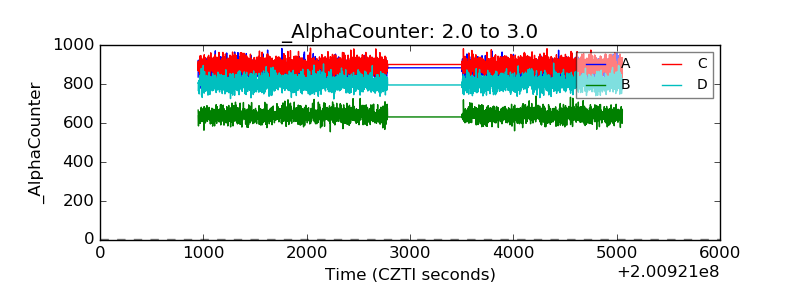 |
| _CPM_Rate | 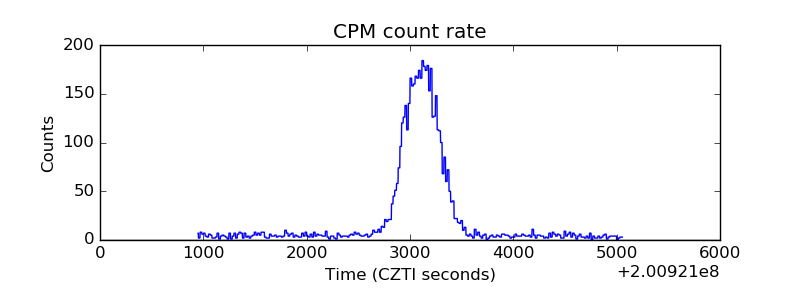 |
| CZT Counter | 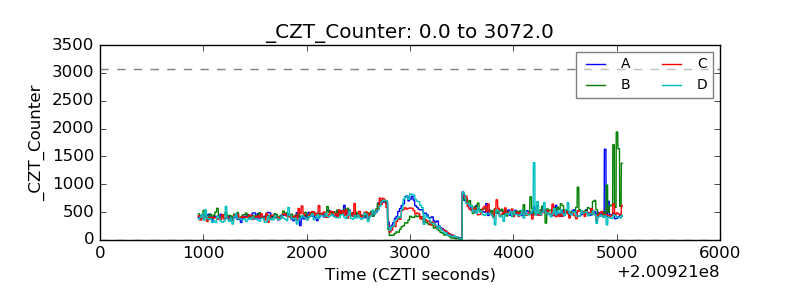 |
| +2.5 Volts monitor |  |
| +5 Volts monitor |  |
| Veto Counter | 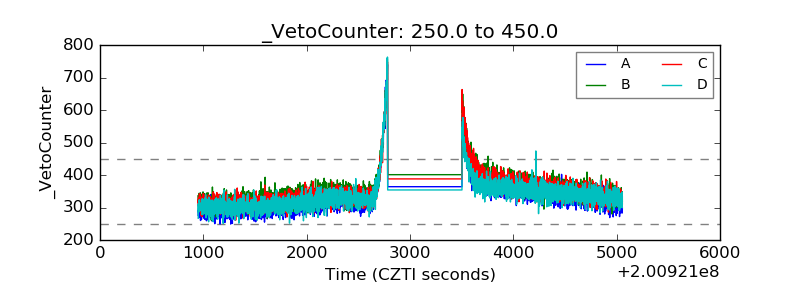 |