| Param | Original file | Final file |
|---|---|---|
| Filename | modeM0/AS1G05_210T01_9000000454_03396cztM0_level2.evt | modeM0/AS1G05_210T01_9000000454_03396cztM0_level2_quad_clean.evt |
| Size (bytes) | 428,644,800 | 81,089,280 |
| Size | 408.8 MB | 77.3 MB |
| Events in quadrant A | 2,867,662 | 508,795 |
| Events in quadrant B | 3,772,842 | 506,635 |
| Events in quadrant C | 3,074,460 | 501,857 |
| Events in quadrant D | 2,829,991 | 490,465 |
| Mode M9 | |||
|---|---|---|---|
| Quadrant | BADHDUFLAG | Total packets | Discarded packets |
| A | 0 | 9 | 0 |
| B | 0 | 9 | 0 |
| C | 0 | 9 | 0 |
| D | 0 | 9 | 0 |
| Mode SS | |||
|---|---|---|---|
| Quadrant | BADHDUFLAG | Total packets | Discarded packets |
| A | 0 | 130 | 0 |
| B | 0 | 130 | 0 |
| C | 0 | 130 | 0 |
| D | 0 | 130 | 0 |
| Mode M0 | |||
|---|---|---|---|
| Quadrant | BADHDUFLAG | Total packets | Discarded packets |
| A | 0 | 13099 | 2 |
| B | 0 | 15495 | 1 |
| C | 0 | 13530 | 1 |
| D | 0 | 13278 | 1 |
| Quadrant | Total seconds | Saturated seconds | Saturation percentage |
|---|---|---|---|
| A | 6419 | 73 | 1.137249% |
| B | 6419 | 192 | 2.991120% |
| C | 6419 | 68 | 1.059355% |
| D | 6419 | 68 | 1.059355% |
Noise dominated data is calculated using 1-second bins in cleaned event files. If a bin has >2000 counts, and if more than 50% of those come from <1% of pixels, then it is considered to be noise-dominated and hence unusable.
| Quadrant | # 1 sec bins | Bins with >0 counts | Bins with >2000 counts | High rate bins dominated by noise | Noise dominated (total time) | Noise dominated (detector-on time) | Marked lightcurve |
|---|---|---|---|---|---|---|---|
| A | 7319 | 6420 | 1 | 1 | 0.01% | 0.02% | 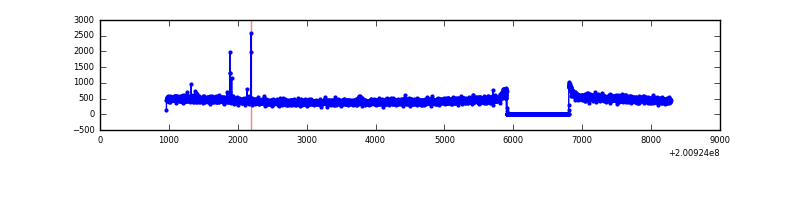 |
| B | 7319 | 6420 | 85 | 85 | 1.16% | 1.32% | 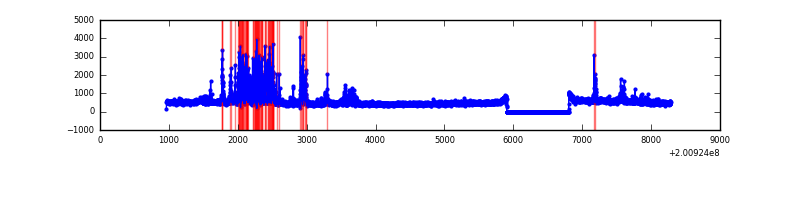 |
| C | 7319 | 6420 | 9 | 9 | 0.12% | 0.14% | 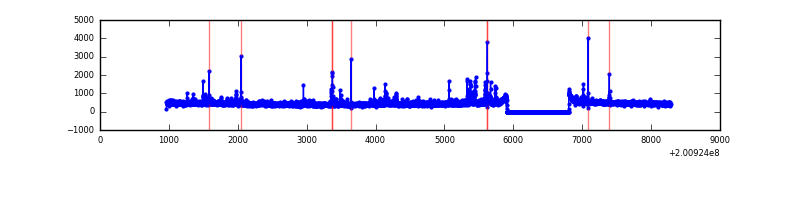 |
| D | 7319 | 6420 | 8 | 8 | 0.11% | 0.12% | 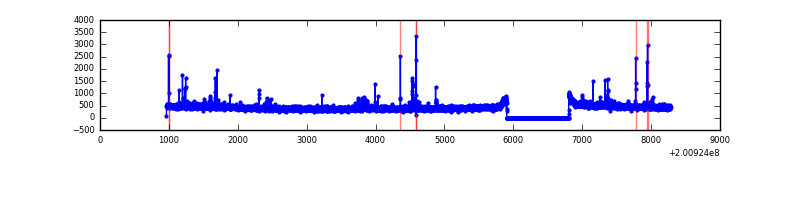 |
Top three noisy pixels from each quadrant. If the there are fewer than three noisy pixels in the level2.evt file, extra rows are filled as -1
| Pixel properties | Quadrant properties | ||||||
|---|---|---|---|---|---|---|---|
| Quadrant | DetID | PixID | Counts | Sigma | Mean | Median | Sigma |
| A | 0 | 118 | 11021 | 67.5 | 739 | 720 | 152.6 |
| A | 0 | 226 | 8498 | 50.97 | 739 | 720 | 152.6 |
| A | 12 | 194 | 7828 | 46.58 | 739 | 720 | 152.6 |
| B | 2 | 249 | 517999 | 3561.45 | 742 | 723 | 145.2 |
| B | 15 | 204 | 243006 | 1668.12 | 742 | 723 | 145.2 |
| B | 14 | 167 | 52902 | 359.25 | 742 | 723 | 145.2 |
| C | 15 | 208 | 150630 | 885.11 | 720 | 723 | 169.4 |
| C | 9 | 54 | 32802 | 189.41 | 720 | 723 | 169.4 |
| C | 1 | 192 | 26651 | 153.09 | 720 | 723 | 169.4 |
| D | 2 | 206 | 47811 | 267.89 | 718 | 695 | 175.9 |
| D | 12 | 110 | 20822 | 114.44 | 718 | 695 | 175.9 |
| D | 10 | 172 | 14459 | 78.26 | 718 | 695 | 175.9 |
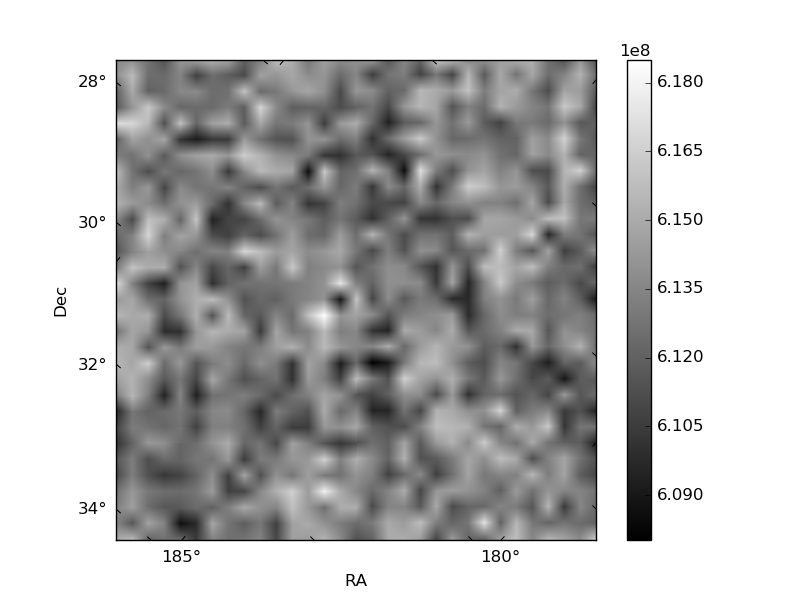
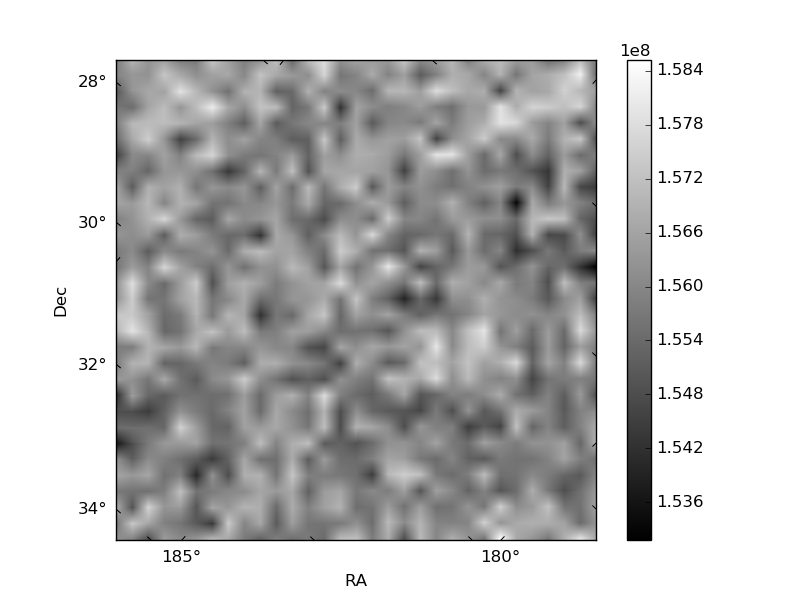
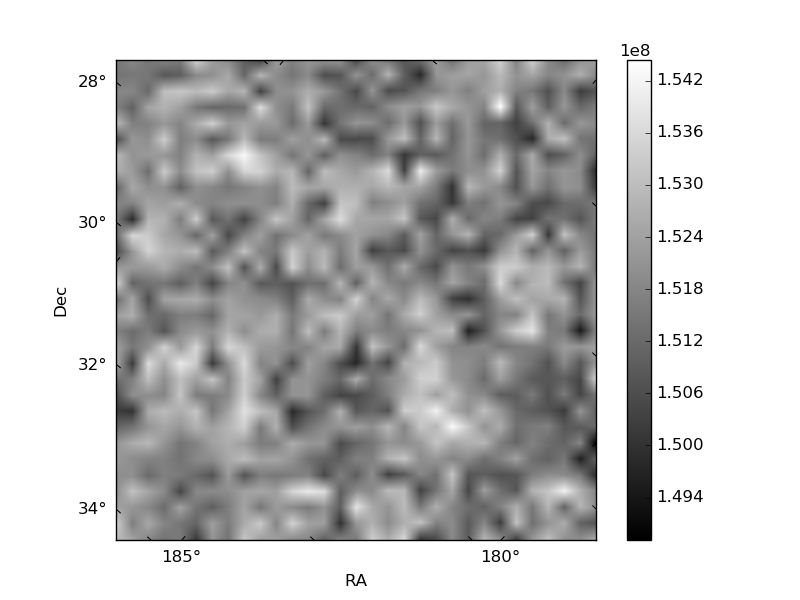
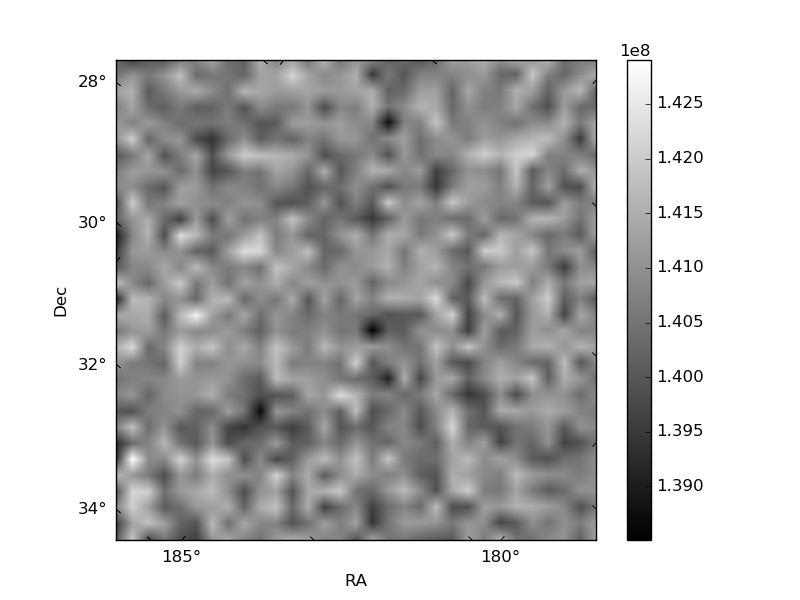
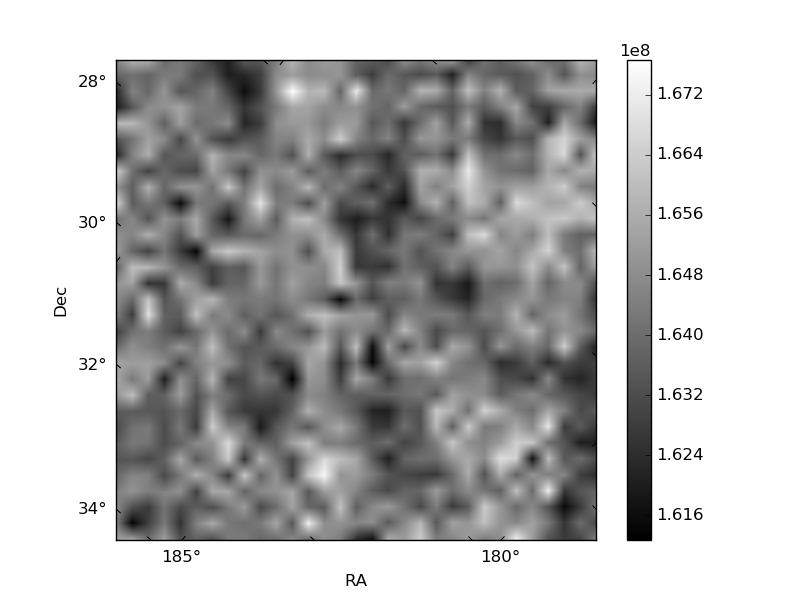
Histogram calculated using DETX and DETY for each event in the final _common_clean file
| Quadrant A | 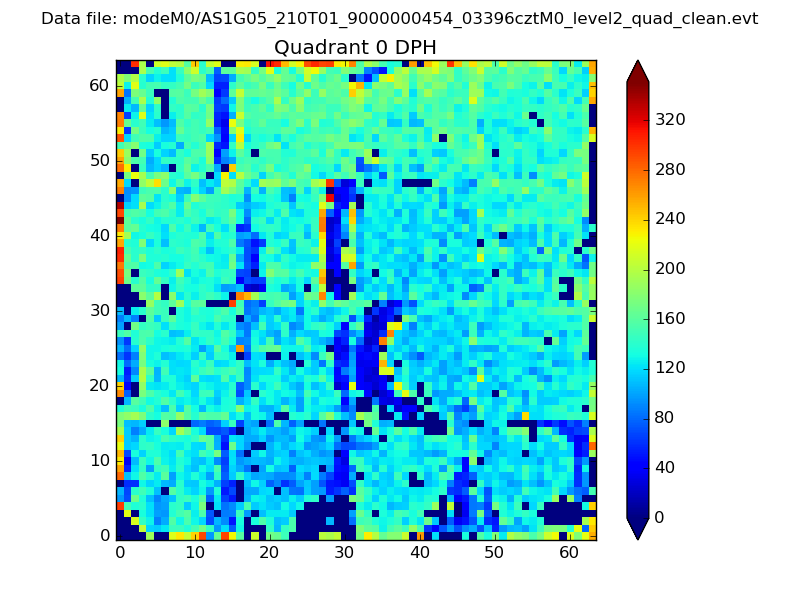 |
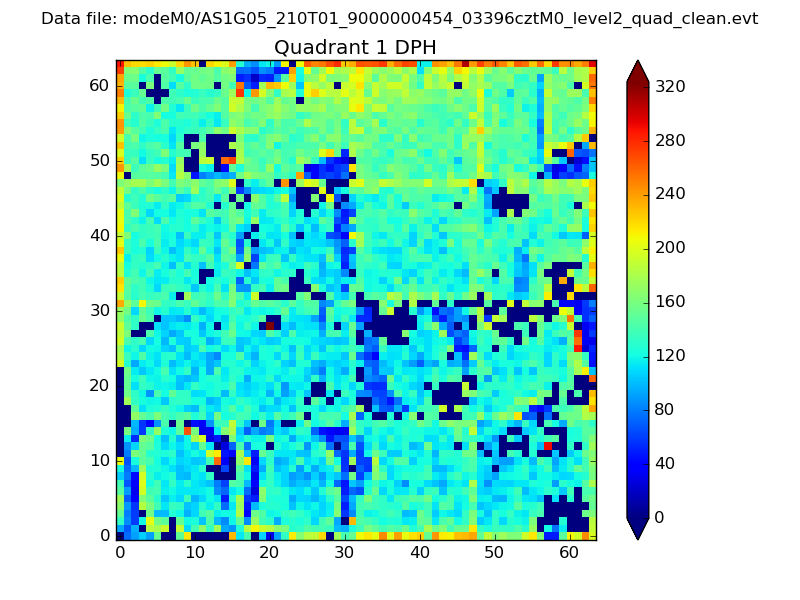 |
Quadrant B |
|---|---|---|---|
| Quadrant D | 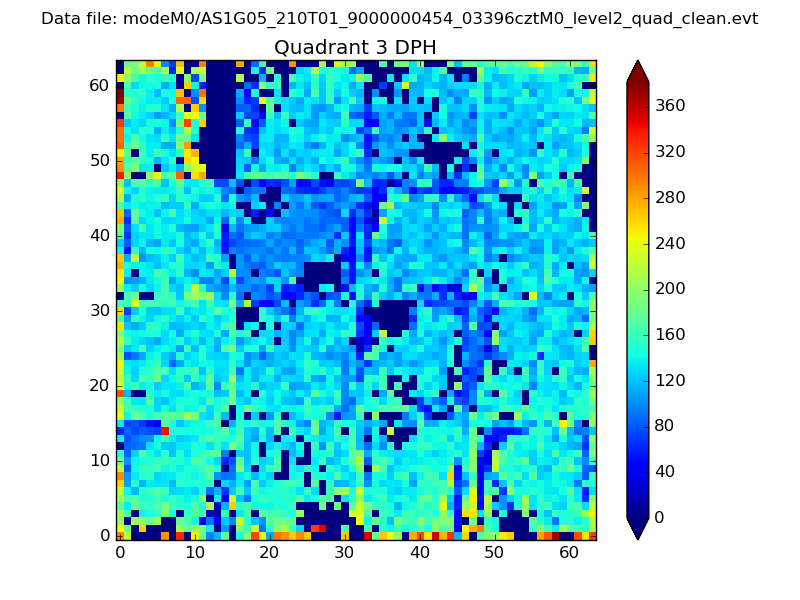 |
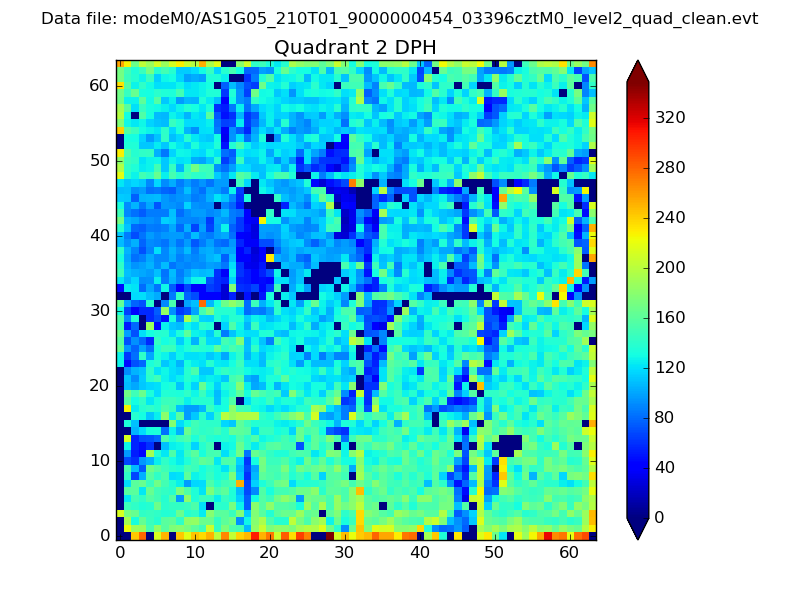 |
Quadrant C |
| Plot type | Count rate plots | Images |
|---|---|---|
| Comparison with Poisson distribution Blue bars denote a histogram of data divided into 1 sec bins. Red curve is a Poisson curve with rate = median count rate of data. |
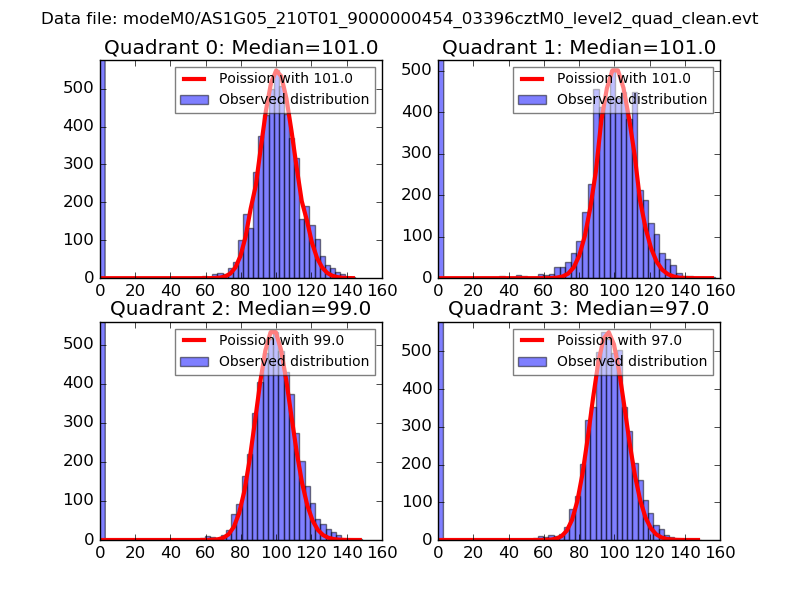 |
 |
| Quadrant-wise count rates Data is divided into 100 sec bins |
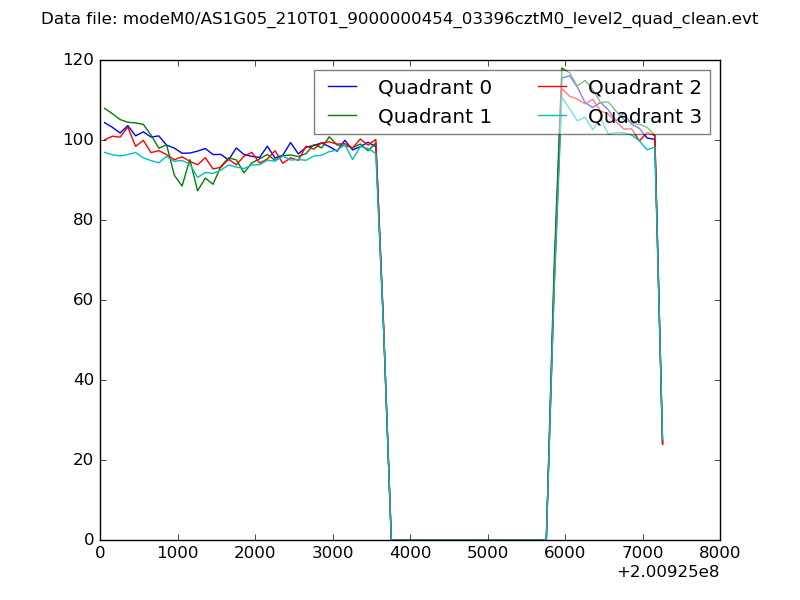 |
|
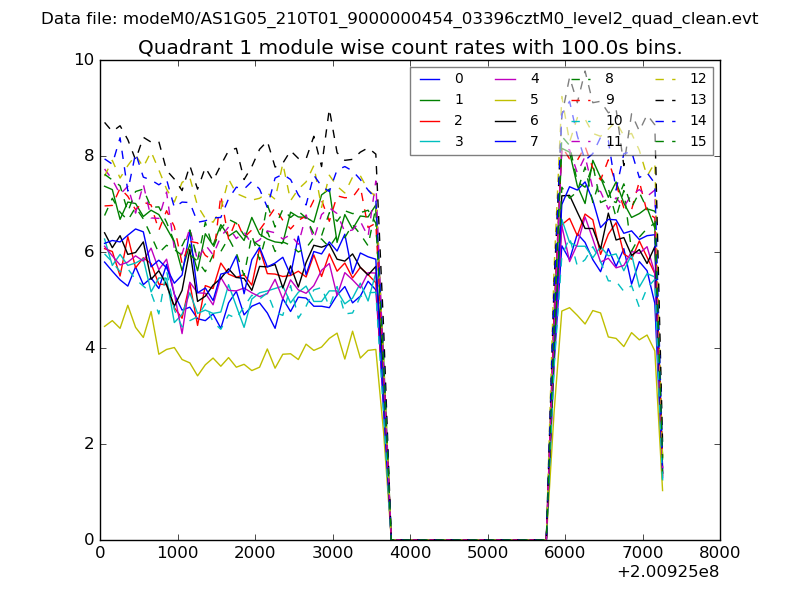
| Module-wise count rates for Quadrant A Data is divided into 100 sec bins |
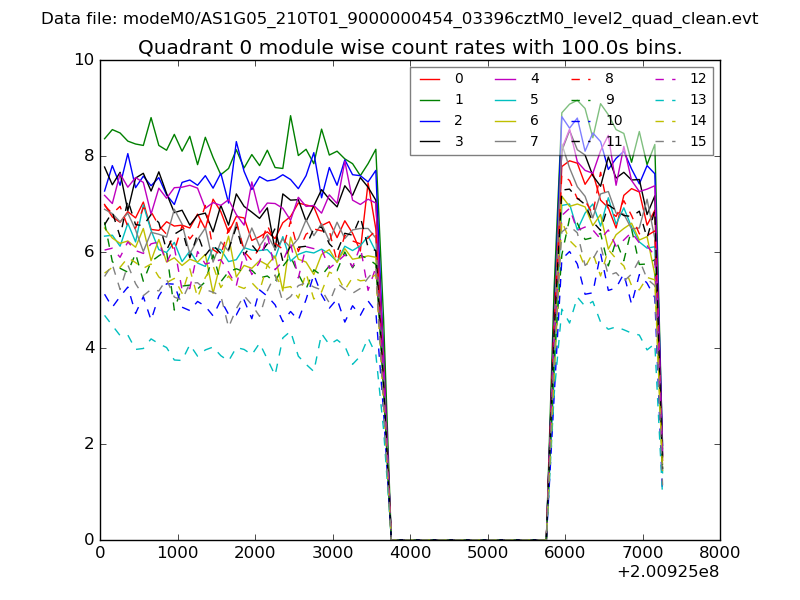 |
 |
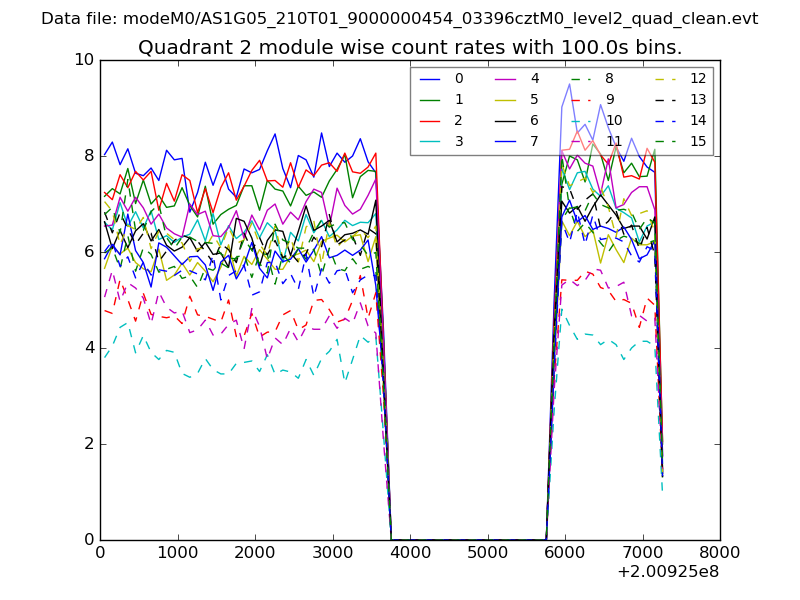
| Module-wise count rates for Quadrant B Data is divided into 100 sec bins |
 |
 |
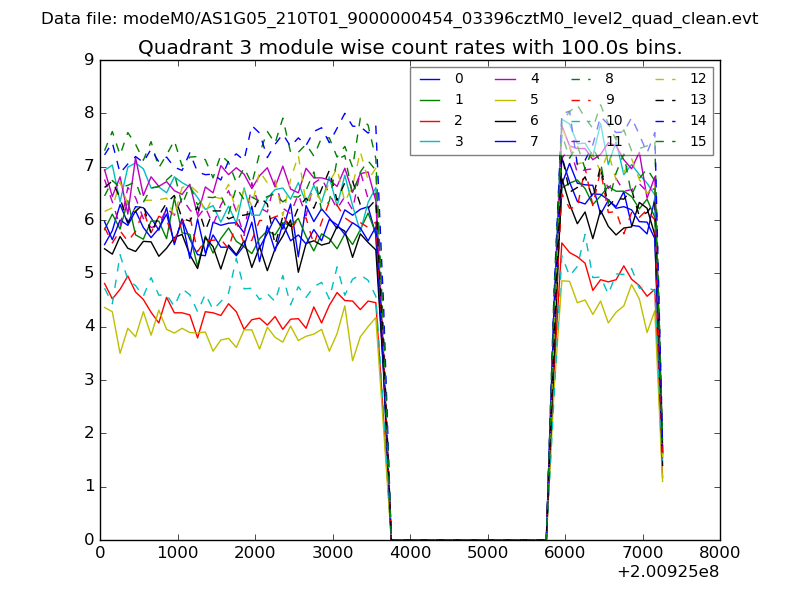
| Module-wise count rates for Quadrant C Data is divided into 100 sec bins |
 |
 |
| Module-wise count rates for Quadrant D Data is divided into 100 sec bins |
 |
 |
| Parameter | Plot |
|---|---|
| CZT HV Monitor | 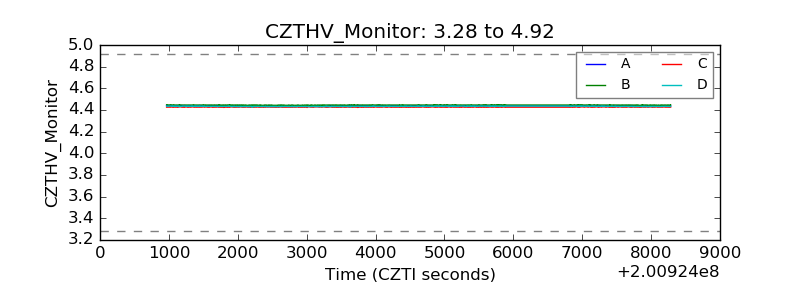 |
| D_VDD | 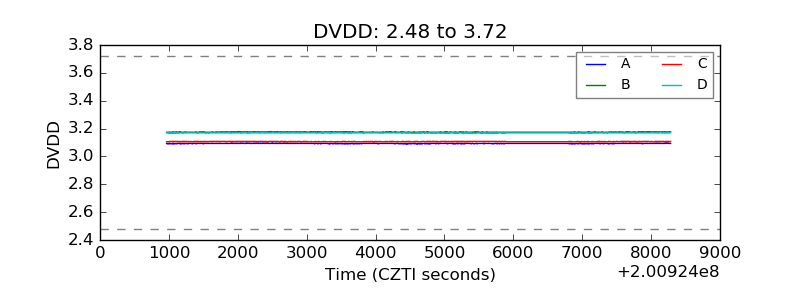 |
| Temperature 1 | 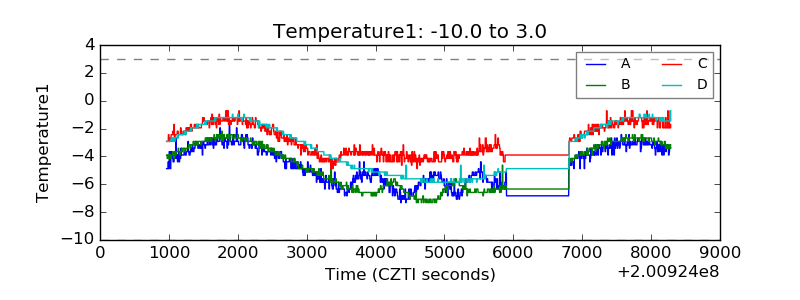 |
| Veto HV Monitor | 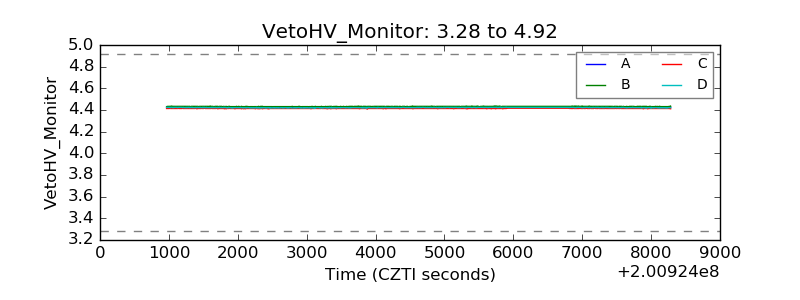 |
| Veto LLD | 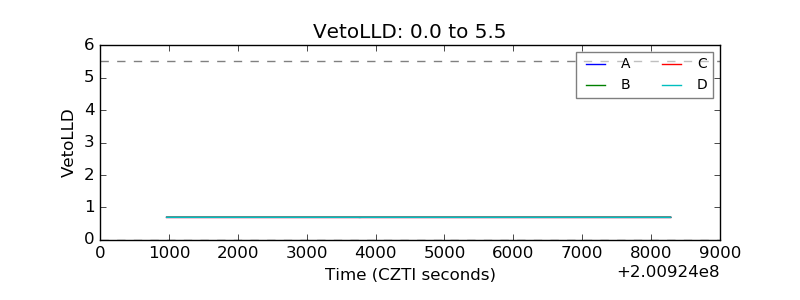 |
| Alpha Counter | 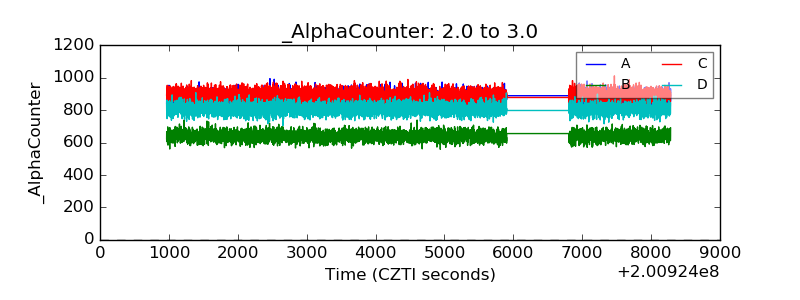 |
| _CPM_Rate | 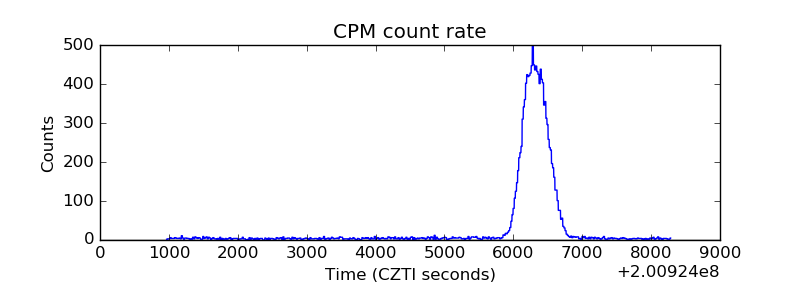 |
| CZT Counter | 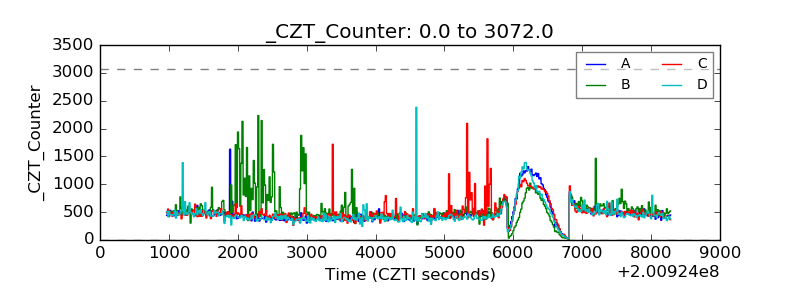 |
| +2.5 Volts monitor | 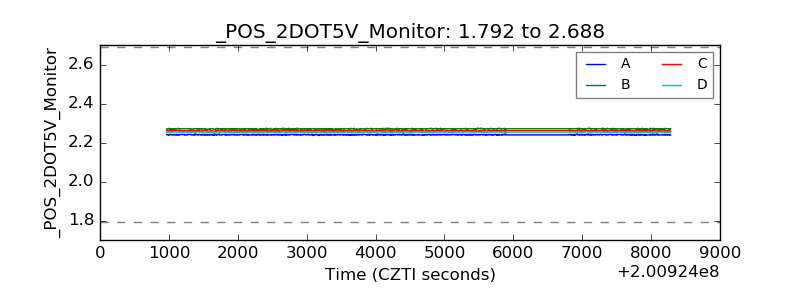 |
| +5 Volts monitor |  |
| Veto Counter | 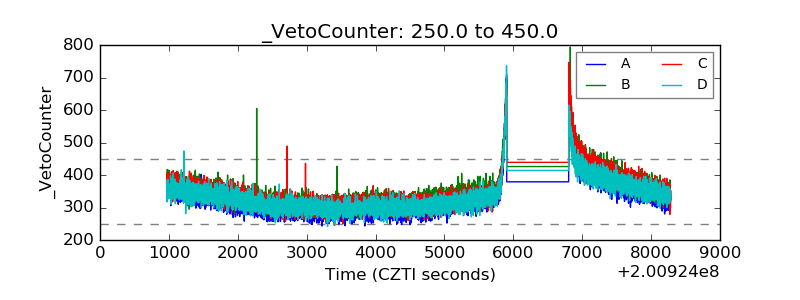 |