| Param | Original file | Final file |
|---|---|---|
| Filename | modeM0/AS1G05_210T01_9000000454_03398cztM0_level2.evt | modeM0/AS1G05_210T01_9000000454_03398cztM0_level2_quad_clean.evt |
| Size (bytes) | 431,991,360 | 84,795,840 |
| Size | 412.0 MB | 80.9 MB |
| Events in quadrant A | 2,988,241 | 533,529 |
| Events in quadrant B | 3,503,705 | 532,832 |
| Events in quadrant C | 3,208,358 | 527,123 |
| Events in quadrant D | 2,934,464 | 514,933 |
| Mode M9 | |||
|---|---|---|---|
| Quadrant | BADHDUFLAG | Total packets | Discarded packets |
| A | 0 | 13 | 0 |
| B | 0 | 13 | 0 |
| C | 0 | 13 | 0 |
| D | 0 | 14 | 0 |
| Mode SS | |||
|---|---|---|---|
| Quadrant | BADHDUFLAG | Total packets | Discarded packets |
| A | 0 | 132 | 0 |
| B | 0 | 132 | 0 |
| C | 0 | 132 | 0 |
| D | 0 | 132 | 0 |
| Mode M0 | |||
|---|---|---|---|
| Quadrant | BADHDUFLAG | Total packets | Discarded packets |
| A | 0 | 13583 | 3 |
| B | 0 | 15114 | 2 |
| C | 0 | 14231 | 2 |
| D | 0 | 13651 | 2 |
| Quadrant | Total seconds | Saturated seconds | Saturation percentage |
|---|---|---|---|
| A | 6593 | 46 | 0.697710% |
| B | 6593 | 101 | 1.531928% |
| C | 6593 | 92 | 1.395419% |
| D | 6593 | 43 | 0.652207% |
Noise dominated data is calculated using 1-second bins in cleaned event files. If a bin has >2000 counts, and if more than 50% of those come from <1% of pixels, then it is considered to be noise-dominated and hence unusable.
| Quadrant | # 1 sec bins | Bins with >0 counts | Bins with >2000 counts | High rate bins dominated by noise | Noise dominated (total time) | Noise dominated (detector-on time) | Marked lightcurve |
|---|---|---|---|---|---|---|---|
| A | 7673 | 6594 | 0 | 0 | 0.00% | 0.00% | 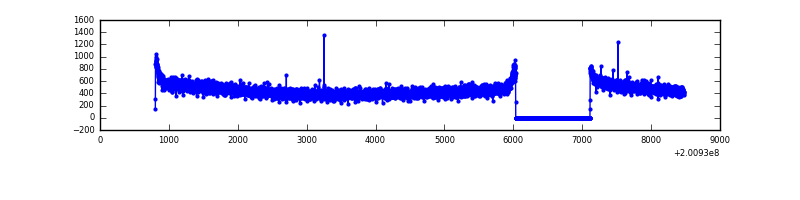 |
| B | 7673 | 6594 | 33 | 33 | 0.43% | 0.50% | 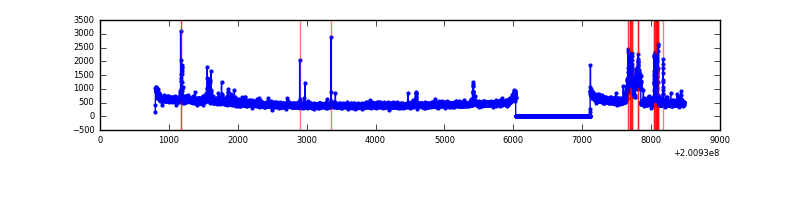 |
| C | 7673 | 6594 | 27 | 27 | 0.35% | 0.41% | 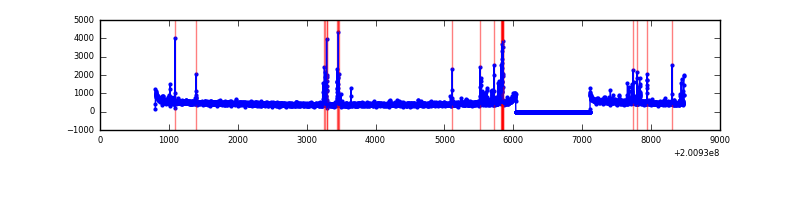 |
| D | 7673 | 6594 | 4 | 4 | 0.05% | 0.06% | 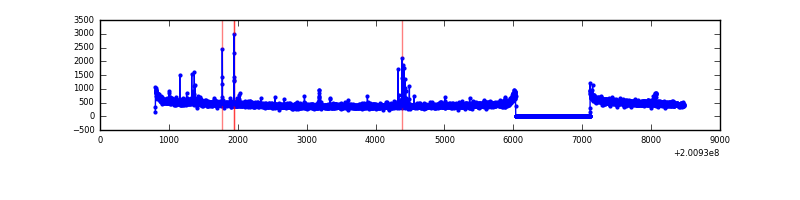 |
Top three noisy pixels from each quadrant. If the there are fewer than three noisy pixels in the level2.evt file, extra rows are filled as -1
| Pixel properties | Quadrant properties | ||||||
|---|---|---|---|---|---|---|---|
| Quadrant | DetID | PixID | Counts | Sigma | Mean | Median | Sigma |
| A | 12 | 194 | 8260 | 47.28 | 774 | 756 | 158.7 |
| A | 0 | 226 | 8219 | 47.02 | 774 | 756 | 158.7 |
| A | 13 | 14 | 5326 | 28.79 | 774 | 756 | 158.7 |
| B | 3 | 0 | 148403 | 979.87 | 781 | 762 | 150.7 |
| B | 14 | 167 | 126446 | 834.15 | 781 | 762 | 150.7 |
| B | 15 | 204 | 119234 | 786.28 | 781 | 762 | 150.7 |
| C | 7 | 220 | 141564 | 799.43 | 755 | 759 | 176.1 |
| C | 1 | 16 | 81961 | 461.03 | 755 | 759 | 176.1 |
| C | 15 | 208 | 17762 | 96.54 | 755 | 759 | 176.1 |
| D | 13 | 239 | 20602 | 109.92 | 754 | 732 | 180.8 |
| D | 2 | 206 | 20565 | 109.71 | 754 | 732 | 180.8 |
| D | 12 | 79 | 13378 | 69.96 | 754 | 732 | 180.8 |
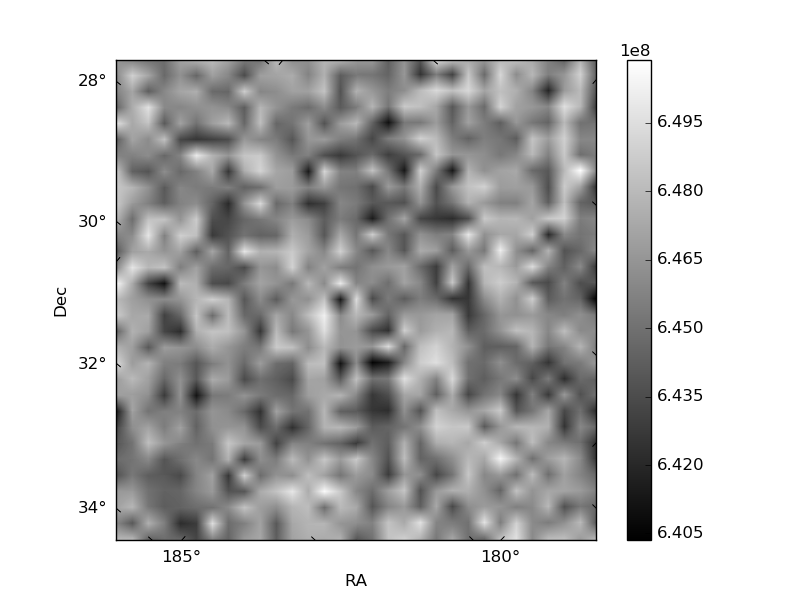
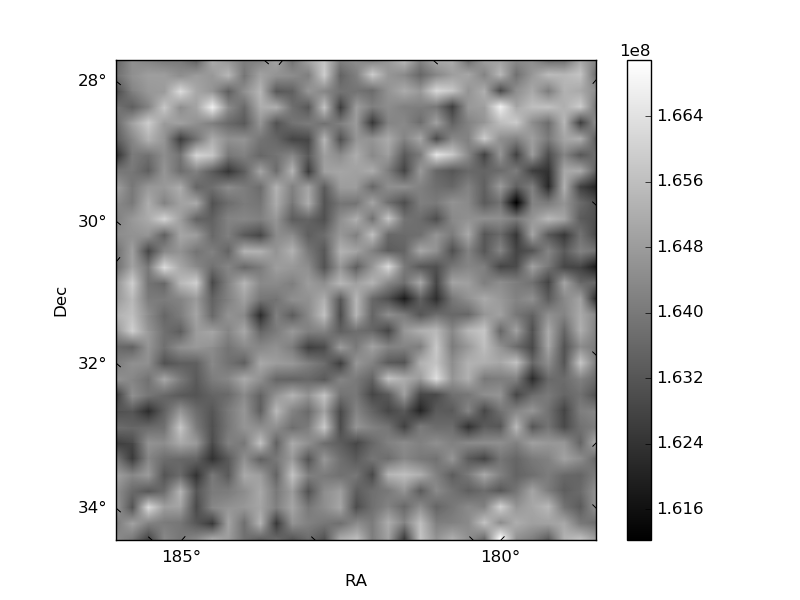
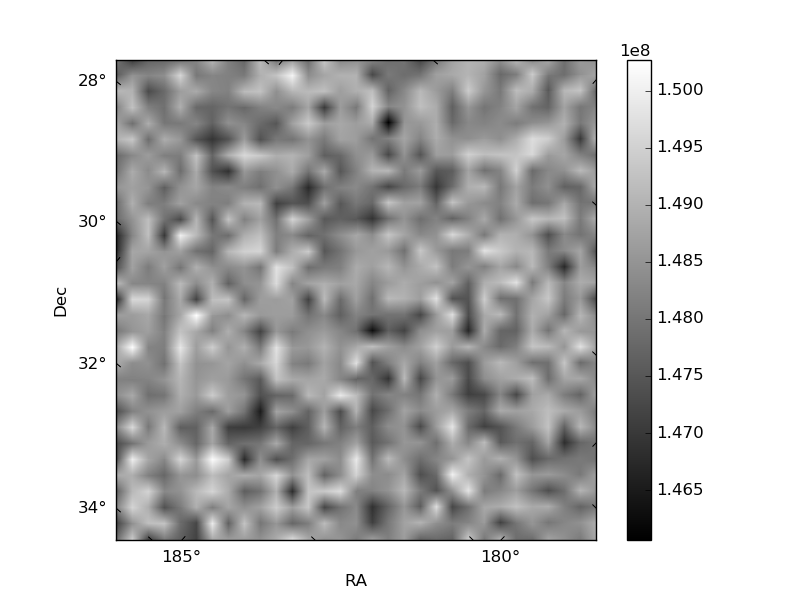
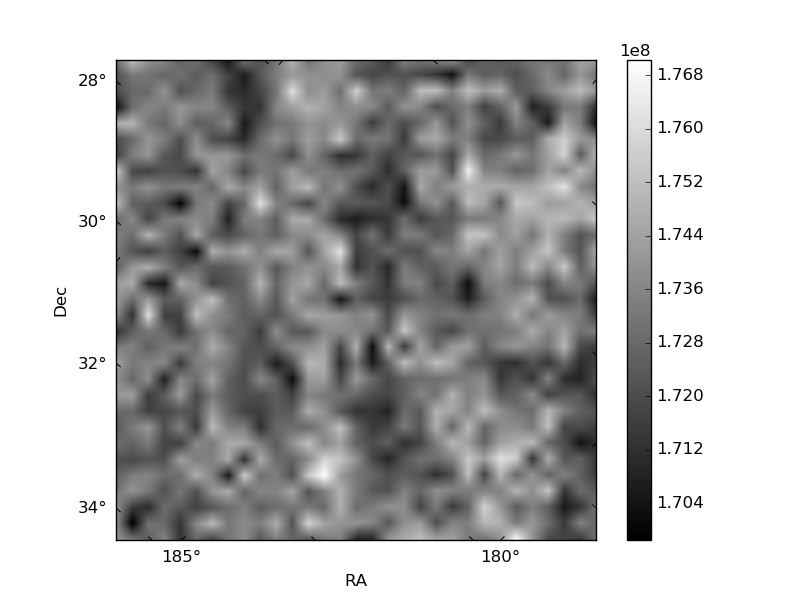
Histogram calculated using DETX and DETY for each event in the final _common_clean file
| Quadrant A | 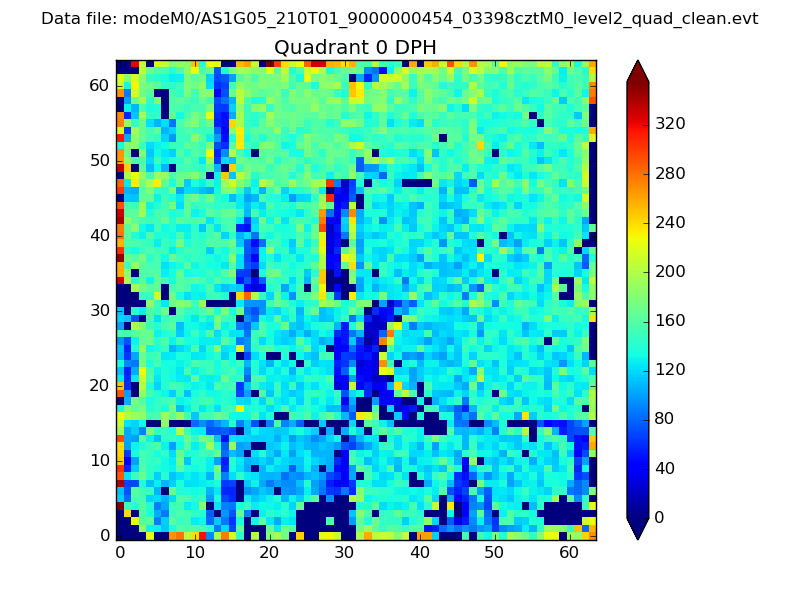 |
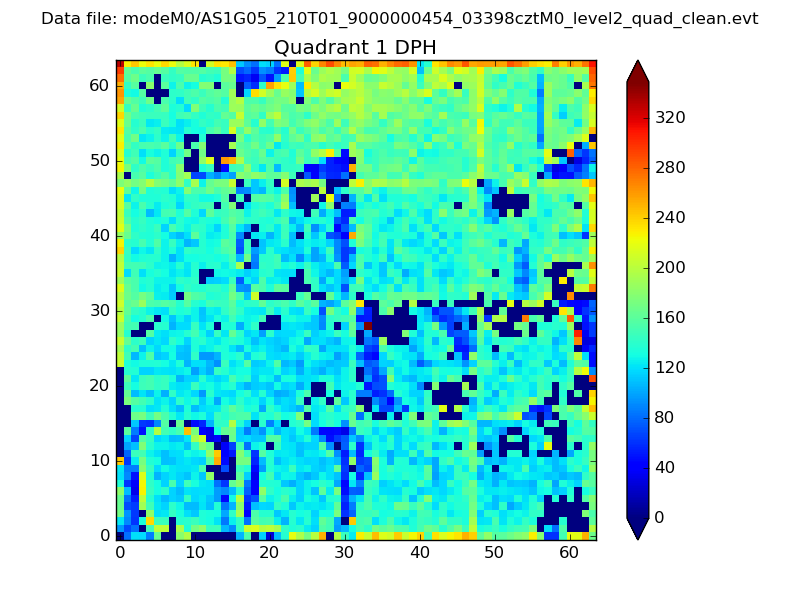 |
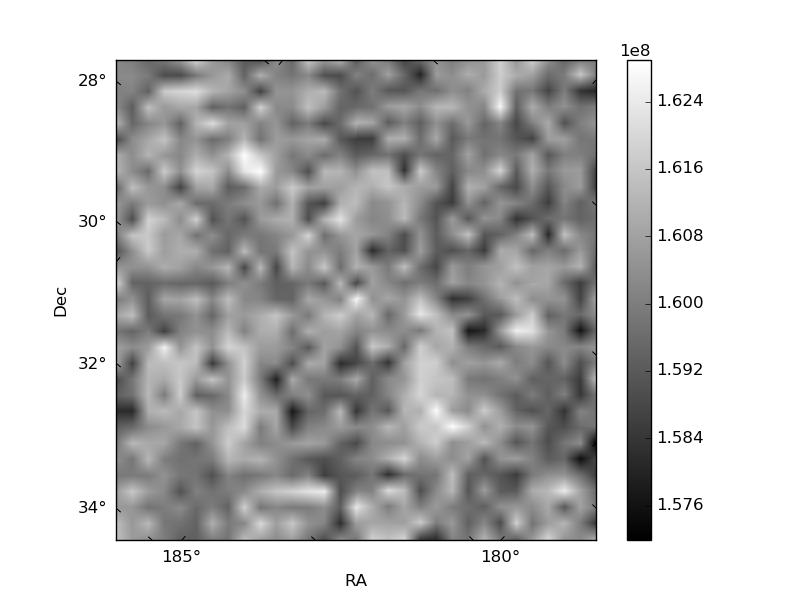
Quadrant B |
|---|---|---|---|
| Quadrant D | 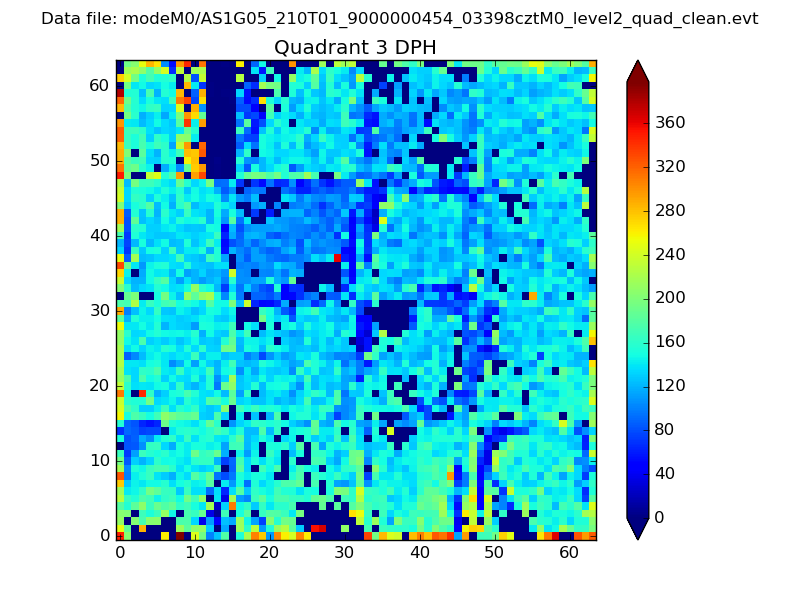 |
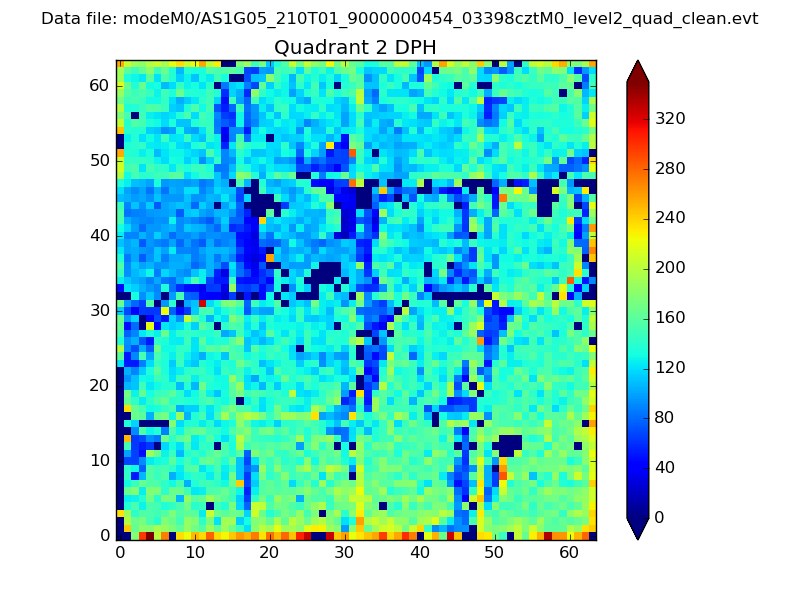 |
Quadrant C |
| Plot type | Count rate plots | Images |
|---|---|---|
| Comparison with Poisson distribution Blue bars denote a histogram of data divided into 1 sec bins. Red curve is a Poisson curve with rate = median count rate of data. |
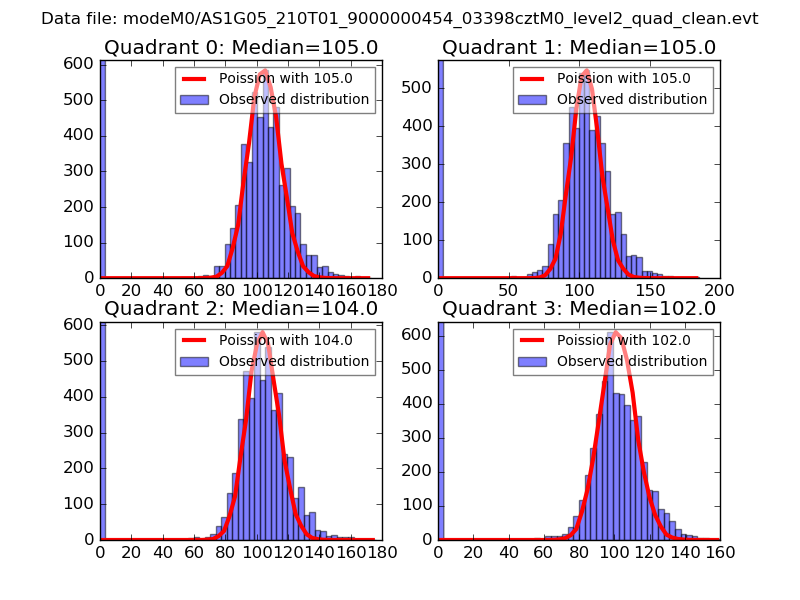 |
 |
| Quadrant-wise count rates Data is divided into 100 sec bins |
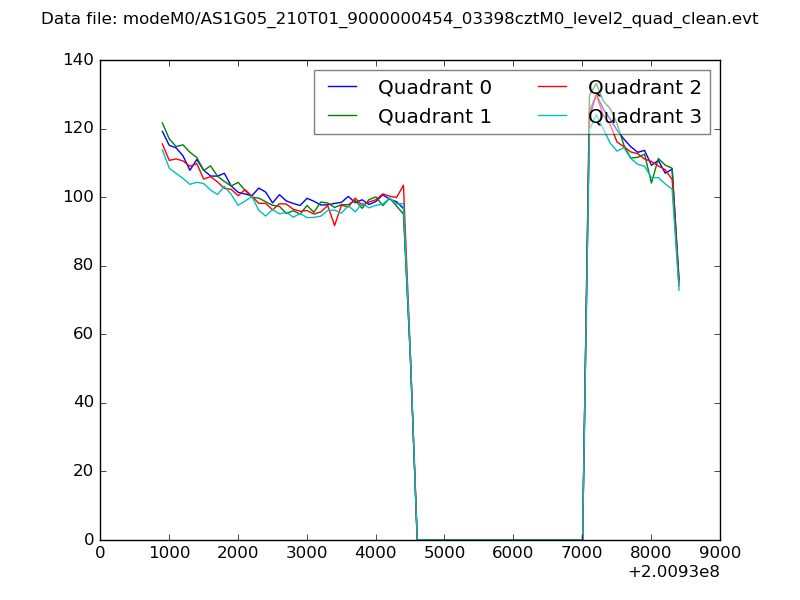 |
|
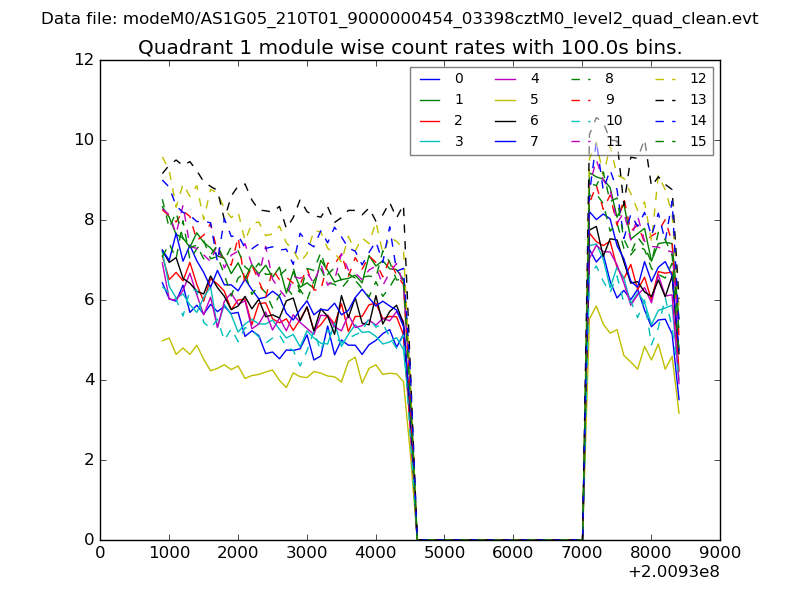
| Module-wise count rates for Quadrant A Data is divided into 100 sec bins |
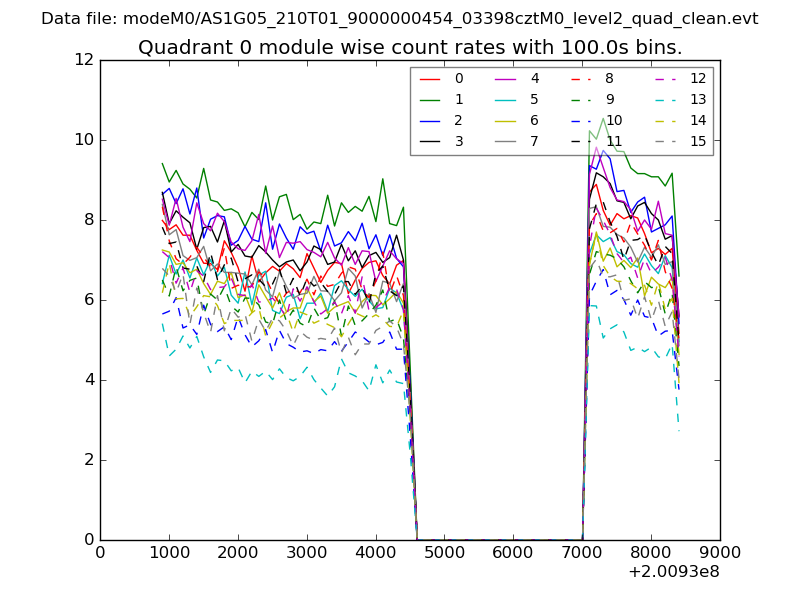 |
 |
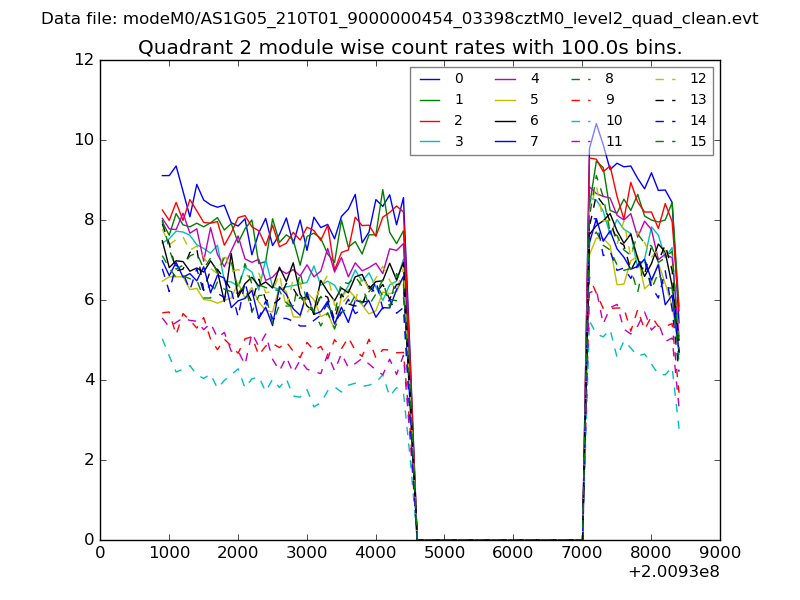
| Module-wise count rates for Quadrant B Data is divided into 100 sec bins |
 |
 |
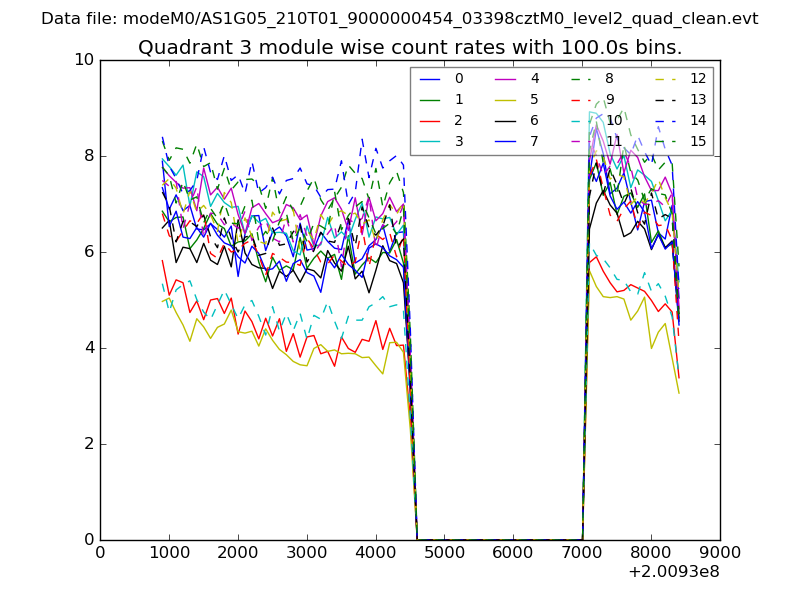
| Module-wise count rates for Quadrant C Data is divided into 100 sec bins |
 |
 |
| Module-wise count rates for Quadrant D Data is divided into 100 sec bins |
 |
 |
| Parameter | Plot |
|---|---|
| CZT HV Monitor | 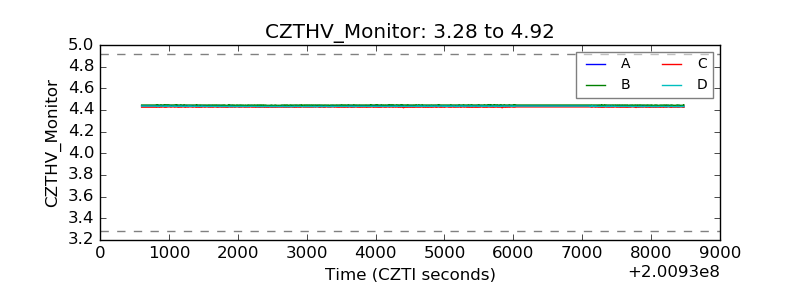 |
| D_VDD | 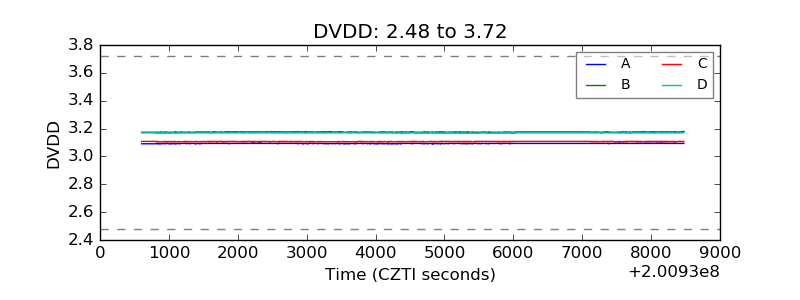 |
| Temperature 1 | 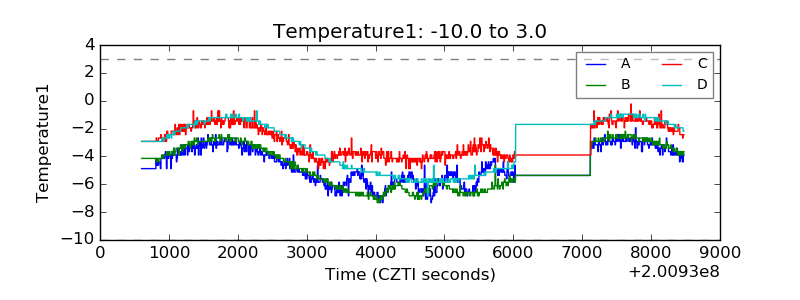 |
| Veto HV Monitor | 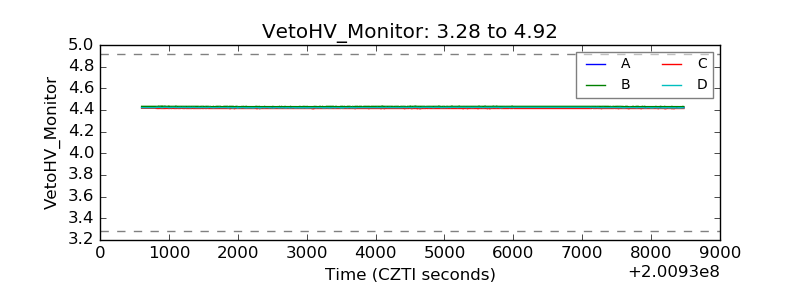 |
| Veto LLD | 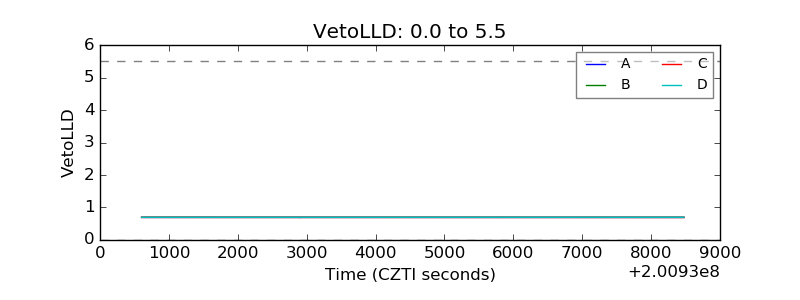 |
| Alpha Counter | 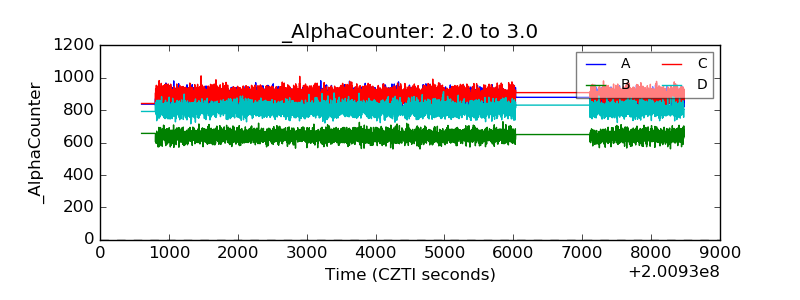 |
| _CPM_Rate | 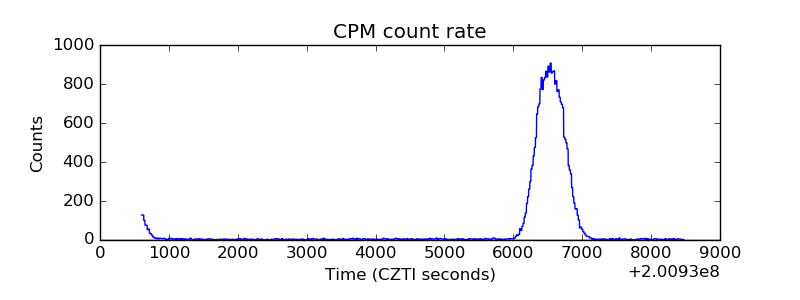 |
| CZT Counter | 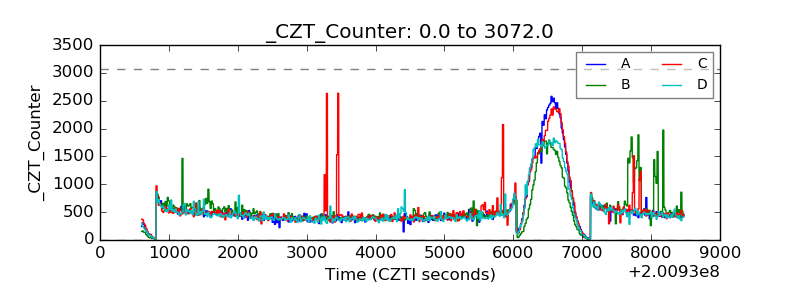 |
| +2.5 Volts monitor | 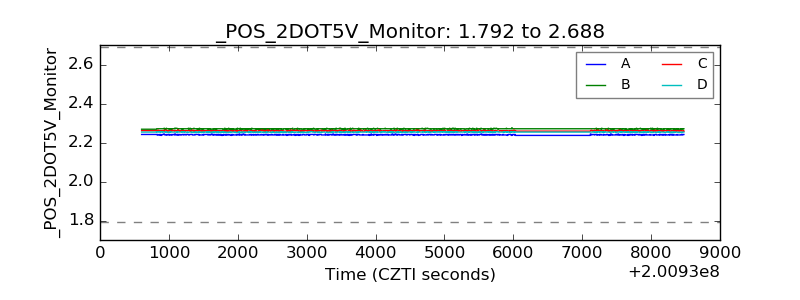 |
| +5 Volts monitor |  |
| Veto Counter | 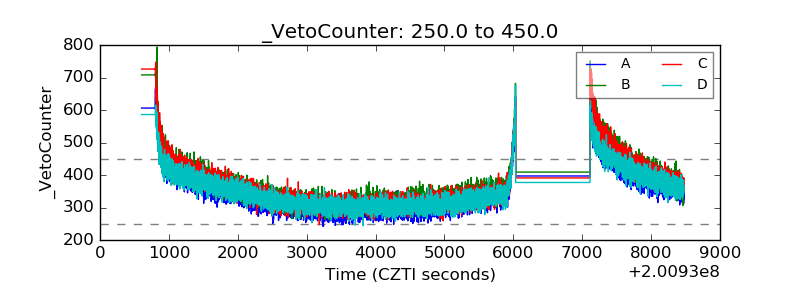 |