| Param | Original file | Final file |
|---|---|---|
| Filename | modeM0/AS1G05_210T01_9000000454_03399cztM0_level2.evt | modeM0/AS1G05_210T01_9000000454_03399cztM0_level2_quad_clean.evt |
| Size (bytes) | 420,166,080 | 77,172,480 |
| Size | 400.7 MB | 73.6 MB |
| Events in quadrant A | 2,760,539 | 483,057 |
| Events in quadrant B | 3,437,062 | 481,272 |
| Events in quadrant C | 3,398,521 | 478,830 |
| Events in quadrant D | 2,711,751 | 465,801 |
| Mode M9 | |||
|---|---|---|---|
| Quadrant | BADHDUFLAG | Total packets | Discarded packets |
| A | 0 | 12 | 0 |
| B | 0 | 12 | 0 |
| C | 0 | 12 | 0 |
| D | 0 | 12 | 0 |
| Mode SS | |||
|---|---|---|---|
| Quadrant | BADHDUFLAG | Total packets | Discarded packets |
| A | 0 | 124 | 0 |
| B | 0 | 124 | 0 |
| C | 0 | 124 | 0 |
| D | 0 | 124 | 0 |
| Mode M0 | |||
|---|---|---|---|
| Quadrant | BADHDUFLAG | Total packets | Discarded packets |
| A | 0 | 12536 | 2 |
| B | 0 | 14554 | 1 |
| C | 0 | 14354 | 1 |
| D | 0 | 12650 | 1 |
| Quadrant | Total seconds | Saturated seconds | Saturation percentage |
|---|---|---|---|
| A | 6129 | 39 | 0.636319% |
| B | 6129 | 81 | 1.321586% |
| C | 6129 | 158 | 2.577908% |
| D | 6129 | 35 | 0.571056% |
Noise dominated data is calculated using 1-second bins in cleaned event files. If a bin has >2000 counts, and if more than 50% of those come from <1% of pixels, then it is considered to be noise-dominated and hence unusable.
| Quadrant | # 1 sec bins | Bins with >0 counts | Bins with >2000 counts | High rate bins dominated by noise | Noise dominated (total time) | Noise dominated (detector-on time) | Marked lightcurve |
|---|---|---|---|---|---|---|---|
| A | 7324 | 6130 | 0 | 0 | 0.00% | 0.00% | 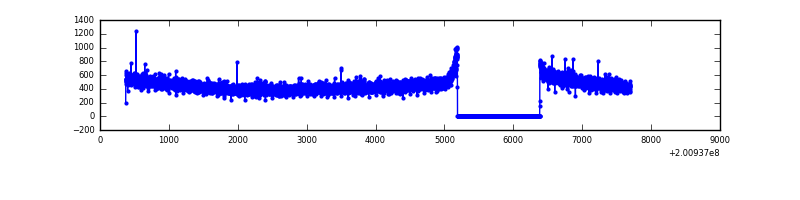 |
| B | 7324 | 6130 | 31 | 31 | 0.42% | 0.51% | 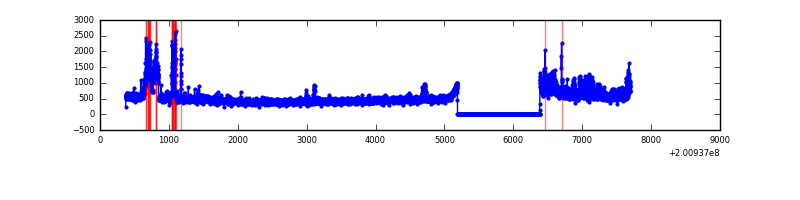 |
| C | 7324 | 6130 | 103 | 103 | 1.41% | 1.68% | 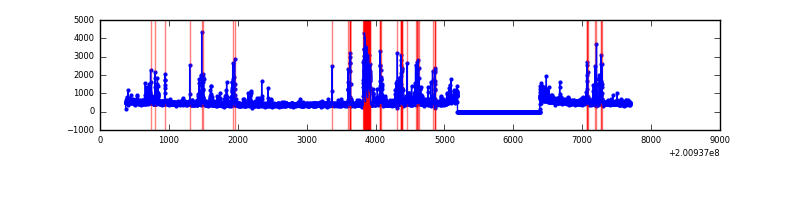 |
| D | 7324 | 6130 | 5 | 5 | 0.07% | 0.08% | 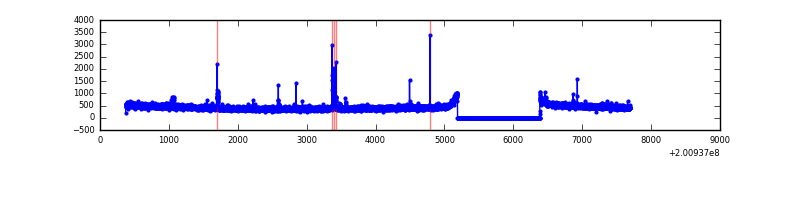 |
Top three noisy pixels from each quadrant. If the there are fewer than three noisy pixels in the level2.evt file, extra rows are filled as -1
| Pixel properties | Quadrant properties | ||||||
|---|---|---|---|---|---|---|---|
| Quadrant | DetID | PixID | Counts | Sigma | Mean | Median | Sigma |
| A | 12 | 194 | 7593 | 47.43 | 715 | 699 | 145.3 |
| A | 0 | 226 | 7515 | 46.9 | 715 | 699 | 145.3 |
| A | 10 | 17 | 3898 | 22.01 | 715 | 699 | 145.3 |
| B | 15 | 204 | 304861 | 2192.77 | 723 | 707 | 138.7 |
| B | 3 | 0 | 153392 | 1100.77 | 723 | 707 | 138.7 |
| B | 14 | 167 | 139619 | 1001.47 | 723 | 707 | 138.7 |
| C | 7 | 220 | 331467 | 2033.69 | 697 | 700 | 162.6 |
| C | 14 | 223 | 257760 | 1580.51 | 697 | 700 | 162.6 |
| C | 1 | 192 | 36883 | 222.47 | 697 | 700 | 162.6 |
| D | 13 | 239 | 27422 | 157.82 | 699 | 681 | 169.4 |
| D | 13 | 112 | 15053 | 84.82 | 699 | 681 | 169.4 |
| D | 12 | 79 | 12967 | 72.51 | 699 | 681 | 169.4 |
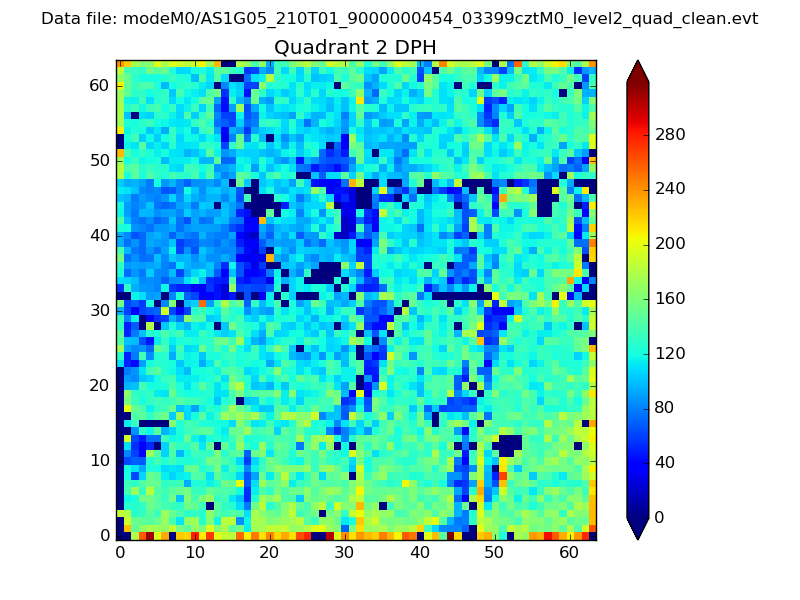
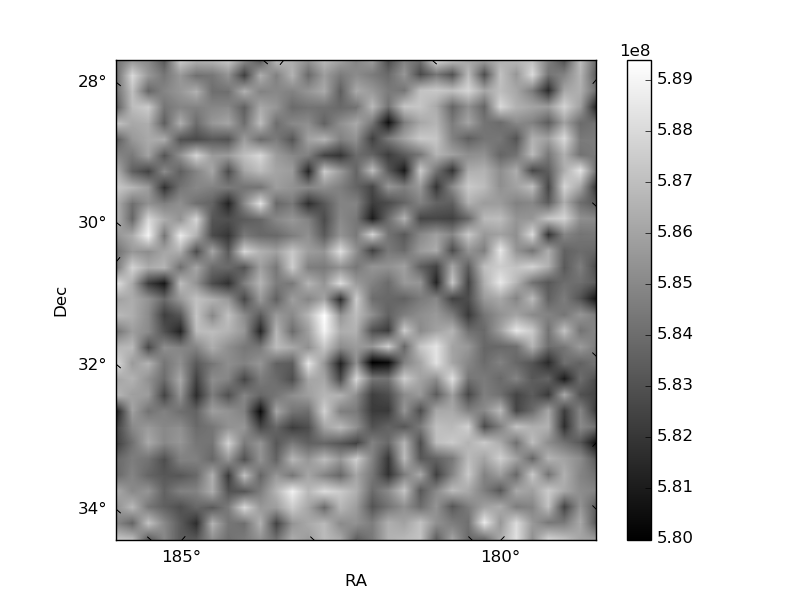
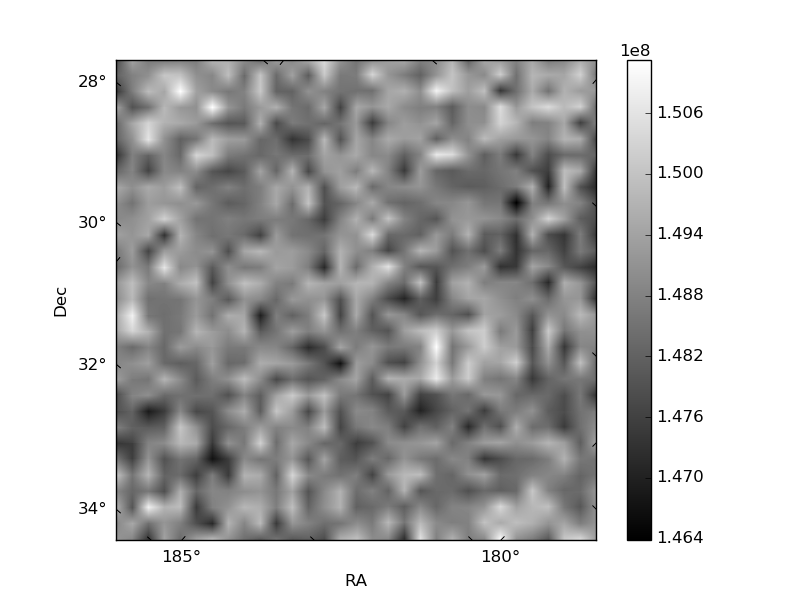
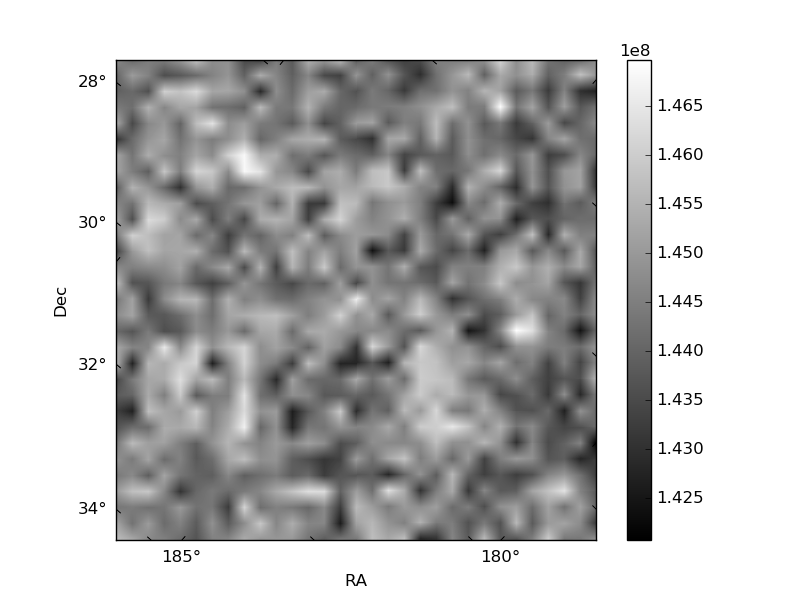
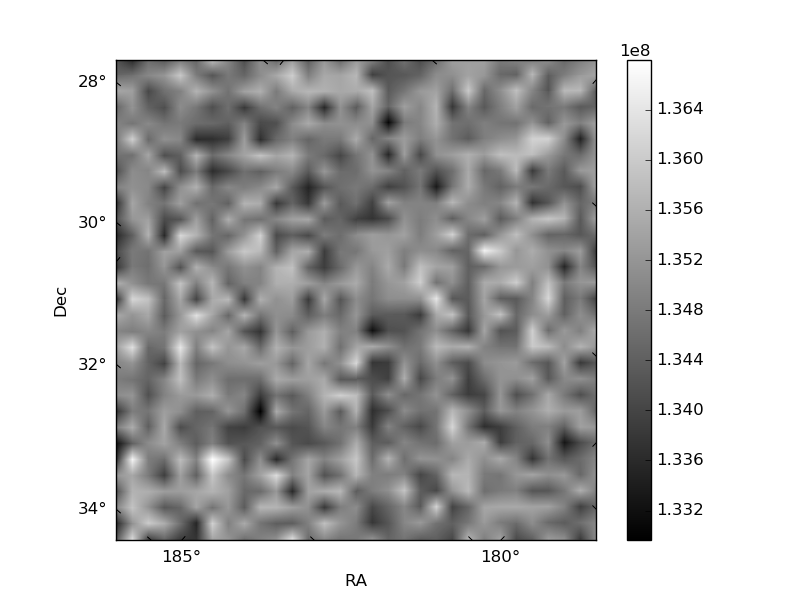
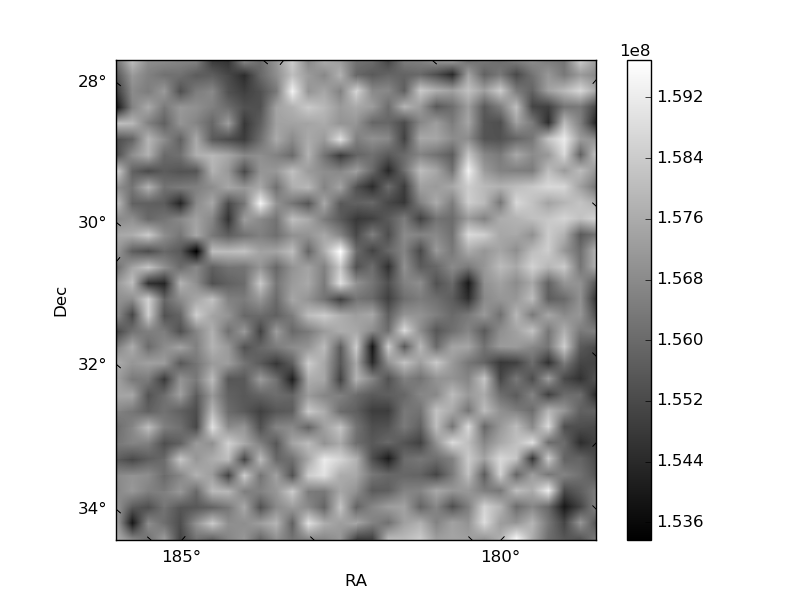
Histogram calculated using DETX and DETY for each event in the final _common_clean file
| Quadrant A | 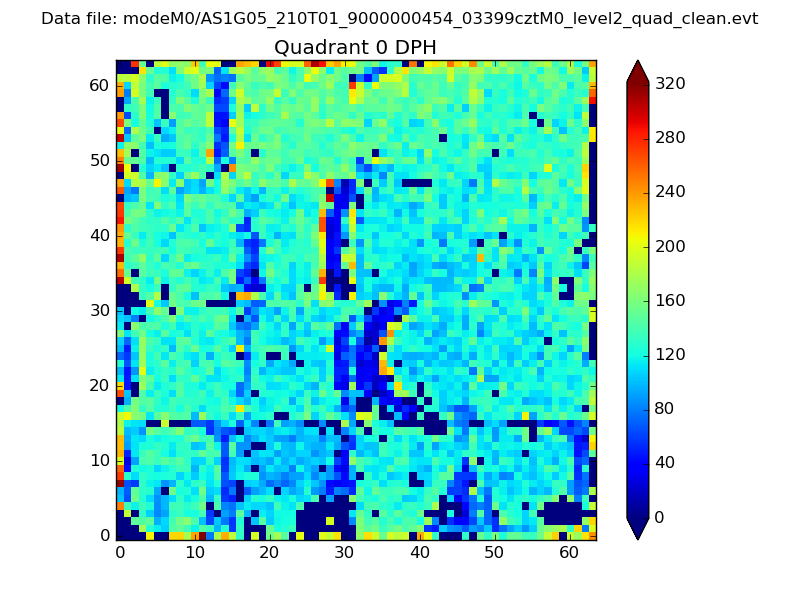 |
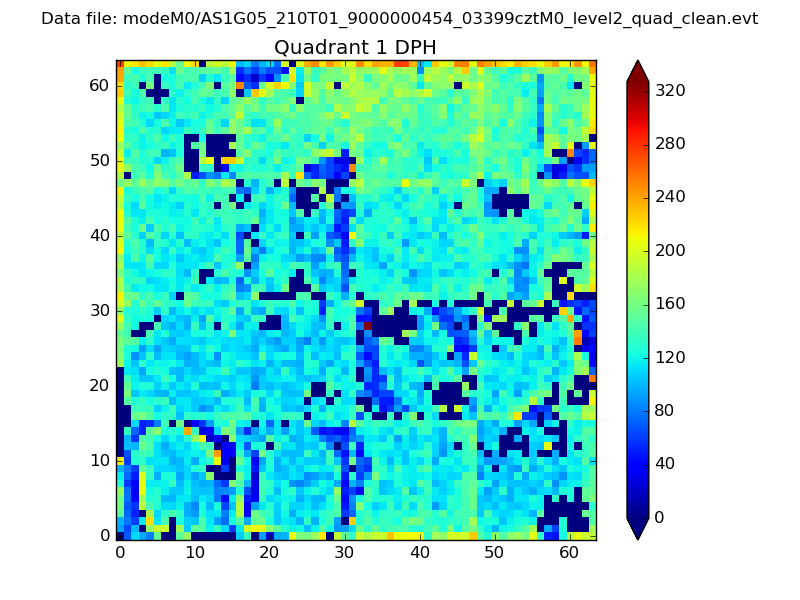 |
Quadrant B |
|---|---|---|---|
| Quadrant D | 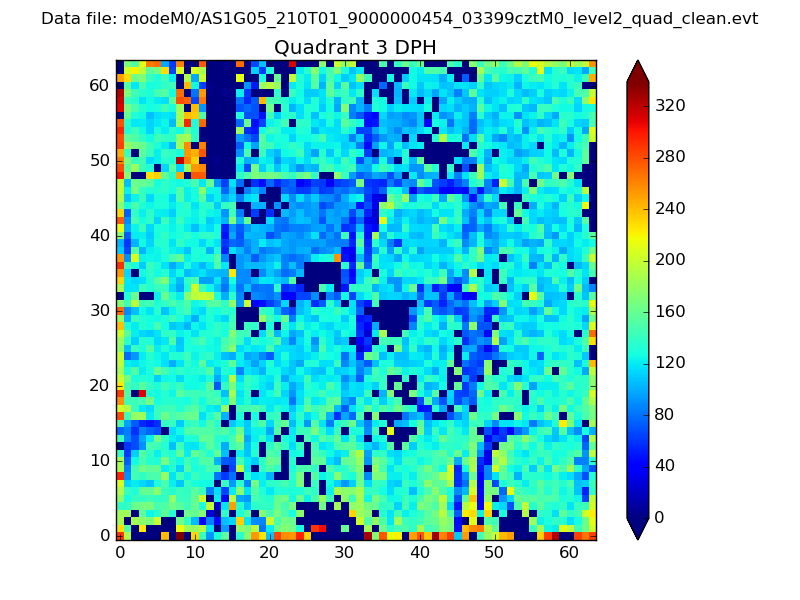 |
 |
Quadrant C |
| Plot type | Count rate plots | Images |
|---|---|---|
| Comparison with Poisson distribution Blue bars denote a histogram of data divided into 1 sec bins. Red curve is a Poisson curve with rate = median count rate of data. |
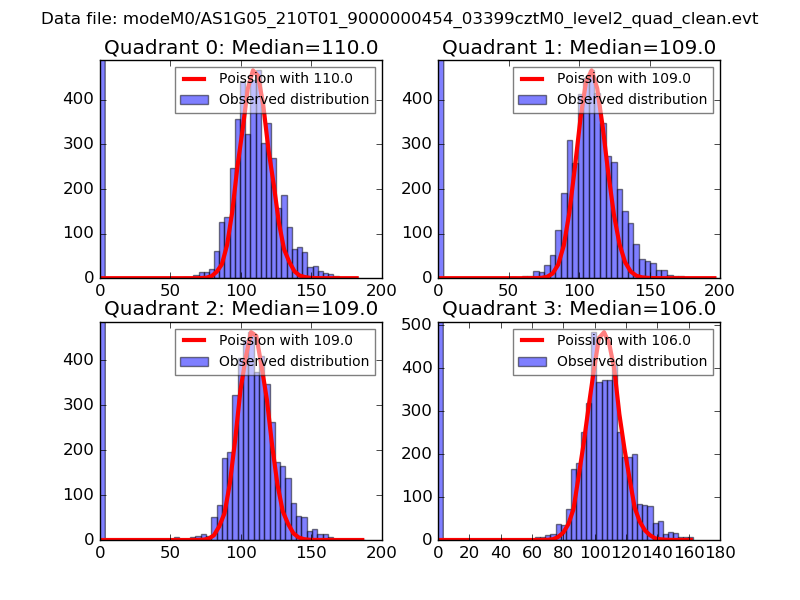 |
 |
| Quadrant-wise count rates Data is divided into 100 sec bins |
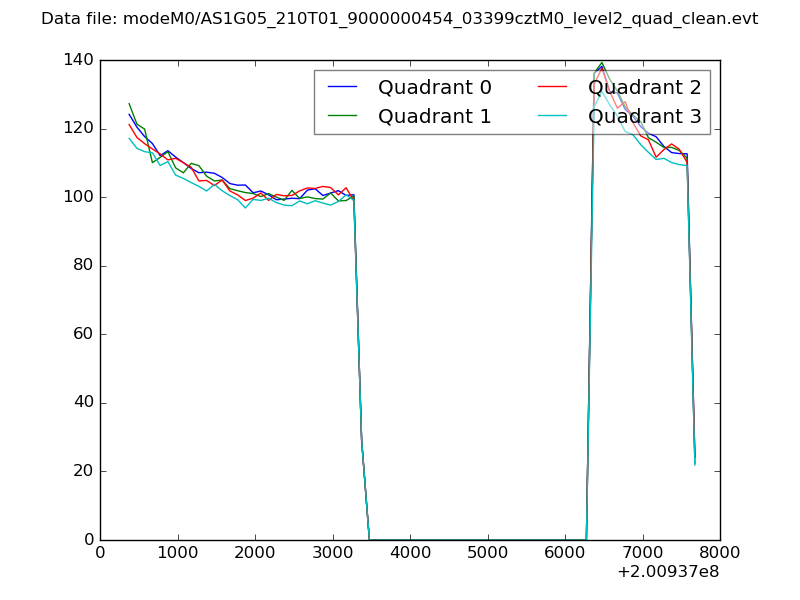 |
|
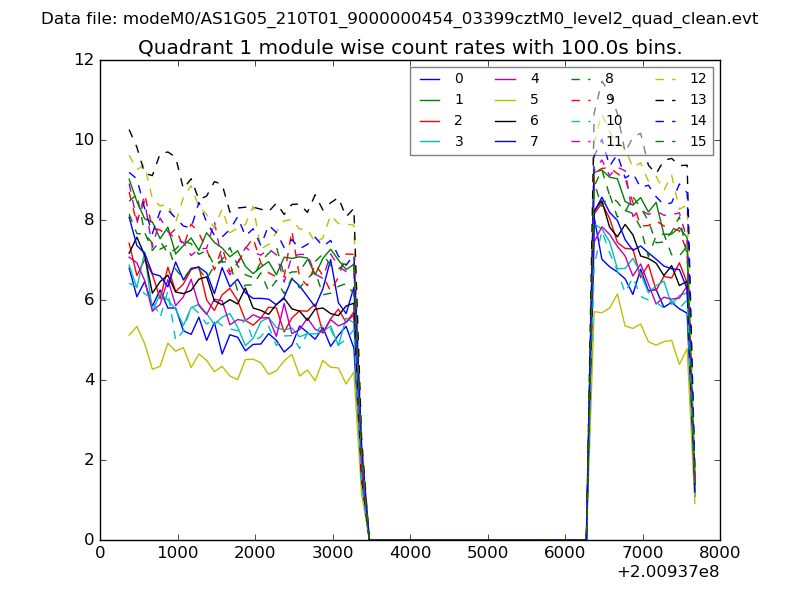
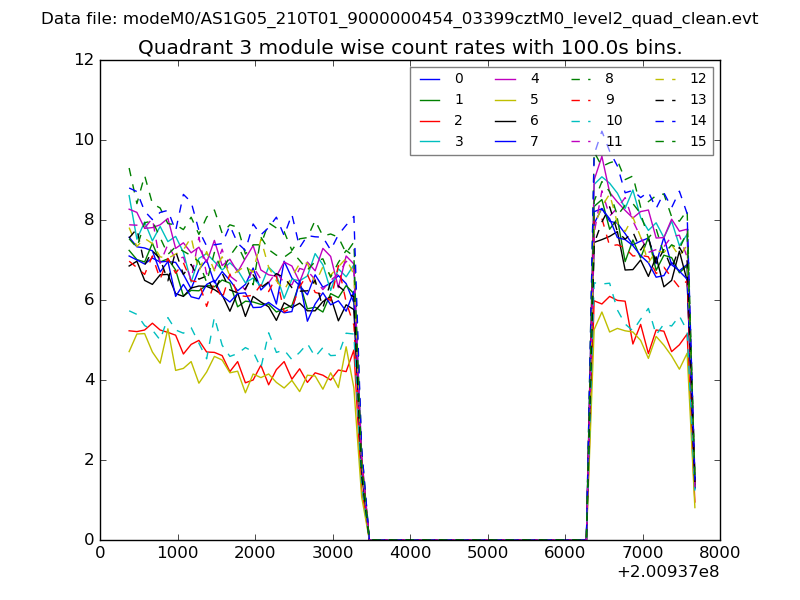
| Module-wise count rates for Quadrant A Data is divided into 100 sec bins |
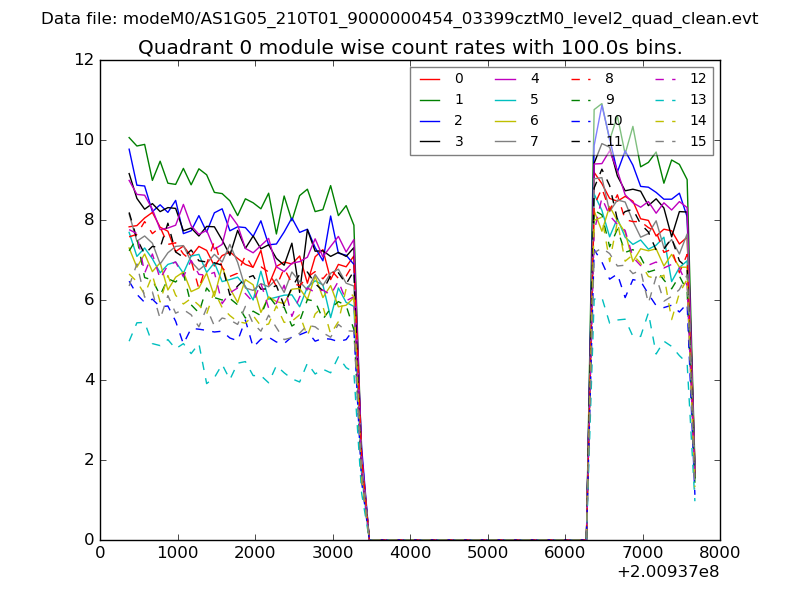 |
 |
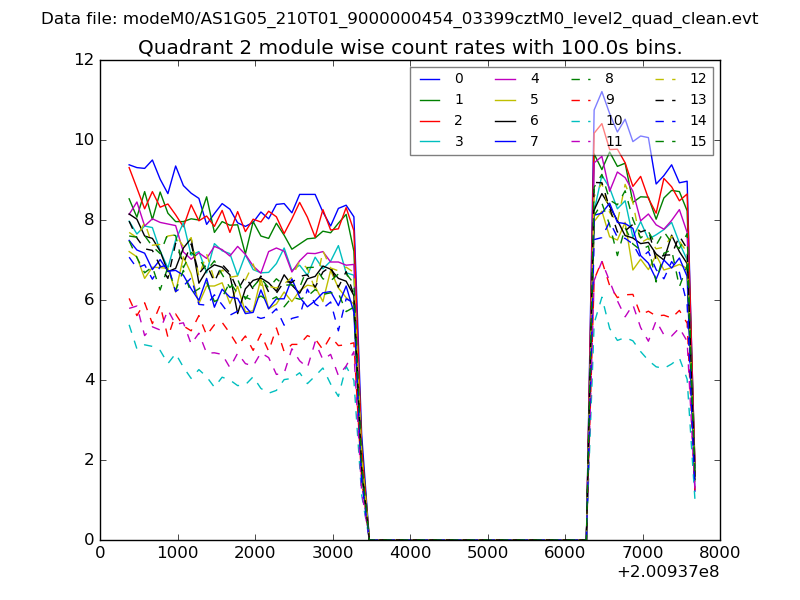
| Module-wise count rates for Quadrant B Data is divided into 100 sec bins |
 |
 |
| Module-wise count rates for Quadrant C Data is divided into 100 sec bins |
 |
 |
| Module-wise count rates for Quadrant D Data is divided into 100 sec bins |
 |
 |
| Parameter | Plot |
|---|---|
| CZT HV Monitor | 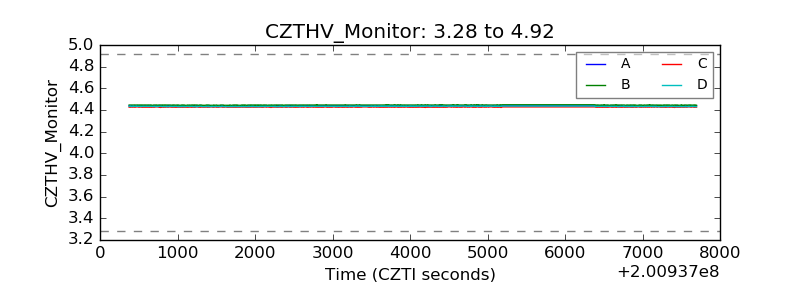 |
| D_VDD | 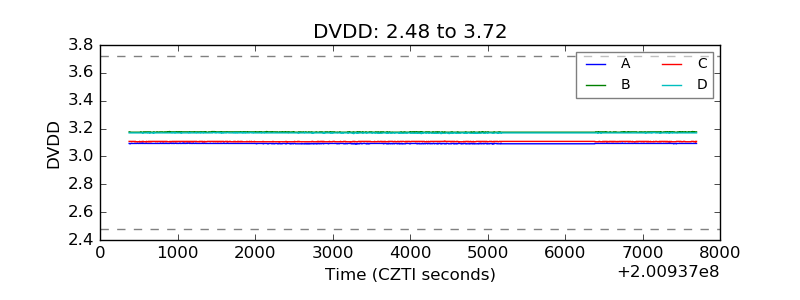 |
| Temperature 1 |  |
| Veto HV Monitor | 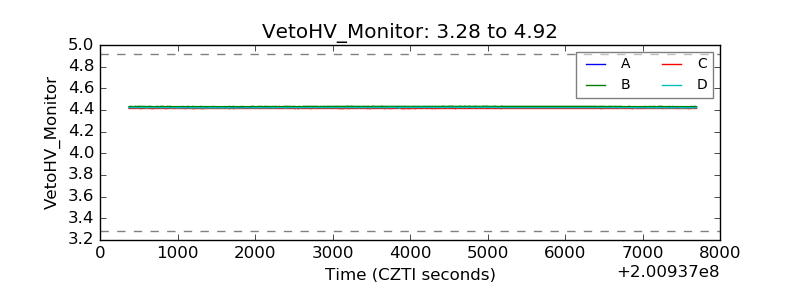 |
| Veto LLD | 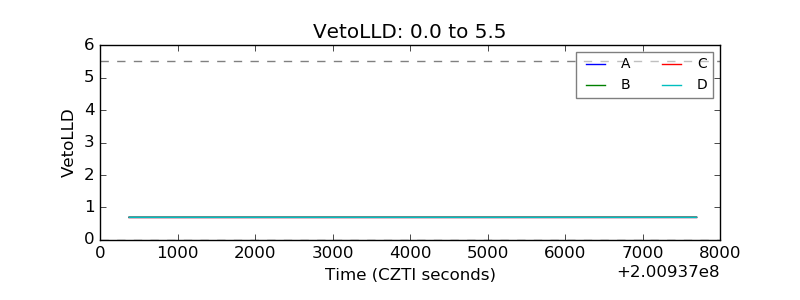 |
| Alpha Counter | 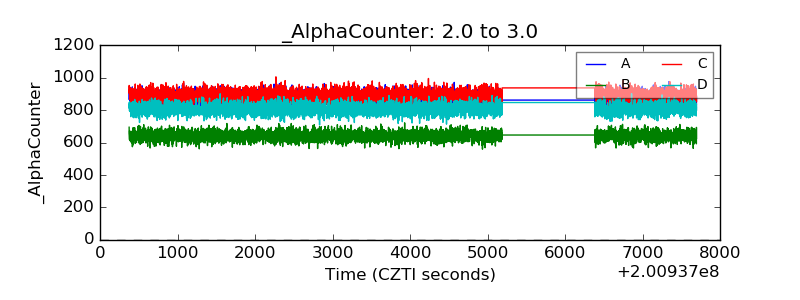 |
| _CPM_Rate | 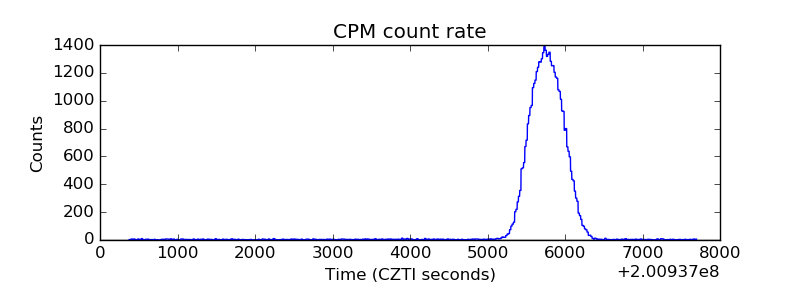 |
| CZT Counter | 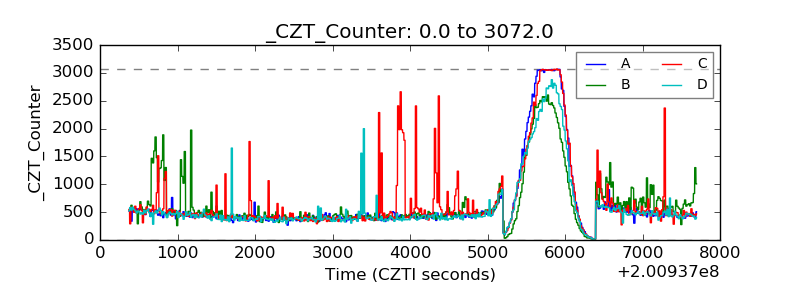 |
| +2.5 Volts monitor |  |
| +5 Volts monitor |  |
| Veto Counter | 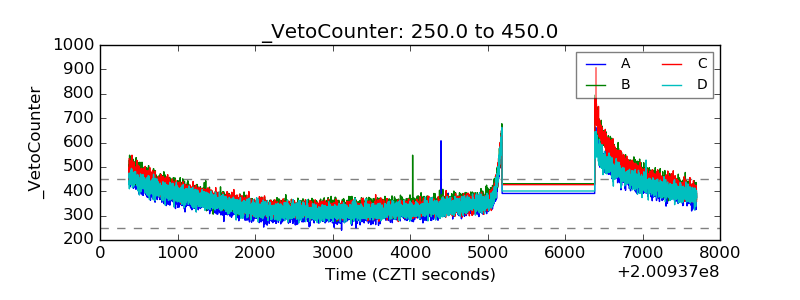 |