| Param | Original file | Final file |
|---|---|---|
| Filename | modeM0/AS1G05_210T01_9000000454_03402cztM0_level2.evt | modeM0/AS1G05_210T01_9000000454_03402cztM0_level2_quad_clean.evt |
| Size (bytes) | 479,903,040 | 76,469,760 |
| Size | 457.7 MB | 72.9 MB |
| Events in quadrant A | 2,978,600 | 473,702 |
| Events in quadrant B | 3,494,243 | 482,057 |
| Events in quadrant C | 4,800,436 | 459,787 |
| Events in quadrant D | 2,825,817 | 453,331 |
| Mode M9 | |||
|---|---|---|---|
| Quadrant | BADHDUFLAG | Total packets | Discarded packets |
| A | 0 | 26 | 0 |
| B | 0 | 26 | 0 |
| C | 0 | 26 | 0 |
| D | 0 | 26 | 0 |
| Mode SS | |||
|---|---|---|---|
| Quadrant | BADHDUFLAG | Total packets | Discarded packets |
| A | 0 | 130 | 0 |
| B | 0 | 130 | 0 |
| C | 0 | 130 | 0 |
| D | 0 | 130 | 0 |
| Mode M0 | |||
|---|---|---|---|
| Quadrant | BADHDUFLAG | Total packets | Discarded packets |
| A | 0 | 13372 | 3 |
| B | 0 | 14549 | 2 |
| C | 0 | 18674 | 2 |
| D | 0 | 13278 | 2 |
| Quadrant | Total seconds | Saturated seconds | Saturation percentage |
|---|---|---|---|
| A | 6407 | 57 | 0.889652% |
| B | 6407 | 94 | 1.467145% |
| C | 6407 | 549 | 8.568753% |
| D | 6407 | 34 | 0.530670% |
Noise dominated data is calculated using 1-second bins in cleaned event files. If a bin has >2000 counts, and if more than 50% of those come from <1% of pixels, then it is considered to be noise-dominated and hence unusable.
| Quadrant | # 1 sec bins | Bins with >0 counts | Bins with >2000 counts | High rate bins dominated by noise | Noise dominated (total time) | Noise dominated (detector-on time) | Marked lightcurve |
|---|---|---|---|---|---|---|---|
| A | 8972 | 6409 | 3 | 3 | 0.03% | 0.05% | 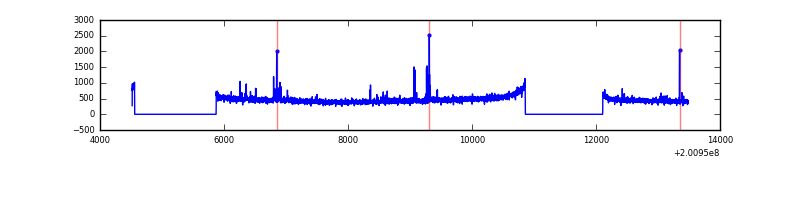 |
| B | 8972 | 6409 | 0 | 0 | 0.00% | 0.00% | 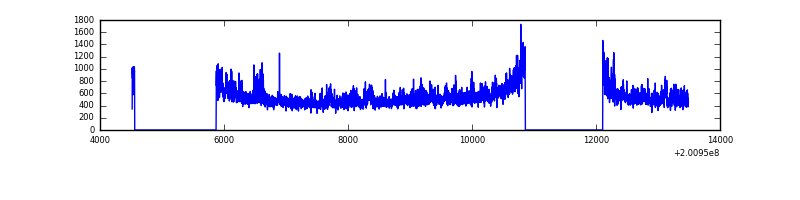 |
| C | 8972 | 6409 | 378 | 378 | 4.21% | 5.90% | 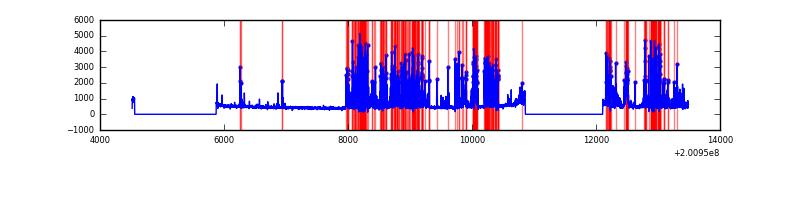 |
| D | 8972 | 6409 | 2 | 2 | 0.02% | 0.03% | 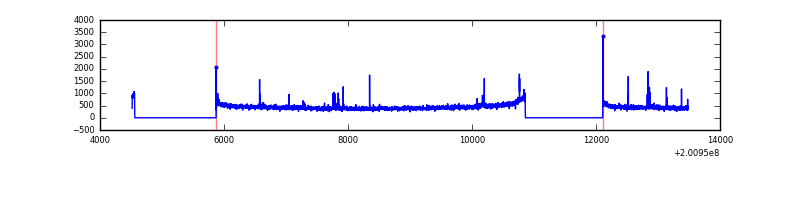 |
Top three noisy pixels from each quadrant. If the there are fewer than three noisy pixels in the level2.evt file, extra rows are filled as -1
| Pixel properties | Quadrant properties | ||||||
|---|---|---|---|---|---|---|---|
| Quadrant | DetID | PixID | Counts | Sigma | Mean | Median | Sigma |
| A | 0 | 31 | 36672 | 232.99 | 752 | 736 | 154.2 |
| A | 0 | 118 | 35646 | 226.34 | 752 | 736 | 154.2 |
| A | 0 | 226 | 11055 | 66.9 | 752 | 736 | 154.2 |
| B | 15 | 204 | 473373 | 3196.43 | 768 | 749 | 147.9 |
| B | 14 | 167 | 24474 | 160.46 | 768 | 749 | 147.9 |
| B | 0 | 229 | 16752 | 108.23 | 768 | 749 | 147.9 |
| C | 7 | 220 | 1966527 | 11843.57 | 712 | 717 | 166.0 |
| C | 14 | 223 | 11895 | 67.34 | 712 | 717 | 166.0 |
| C | 1 | 16 | 10515 | 59.03 | 712 | 717 | 166.0 |
| D | 13 | 223 | 34741 | 193.2 | 728 | 707 | 176.2 |
| D | 13 | 239 | 13611 | 73.25 | 728 | 707 | 176.2 |
| D | 5 | 233 | 11448 | 60.97 | 728 | 707 | 176.2 |
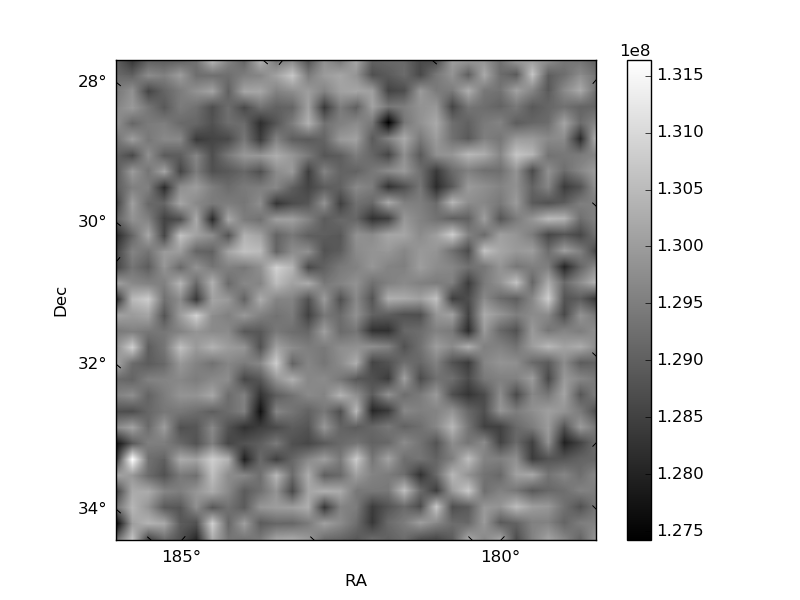
Histogram calculated using DETX and DETY for each event in the final _common_clean file
| Quadrant A | 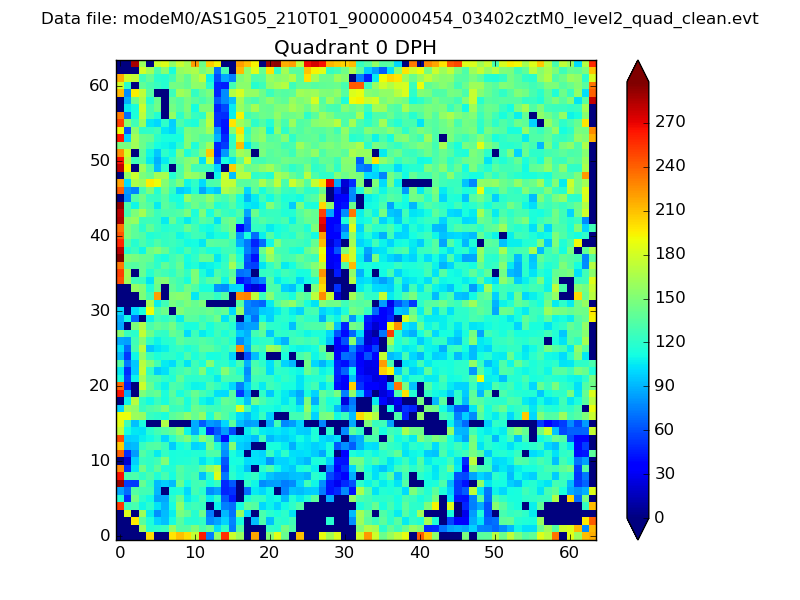 |
 |
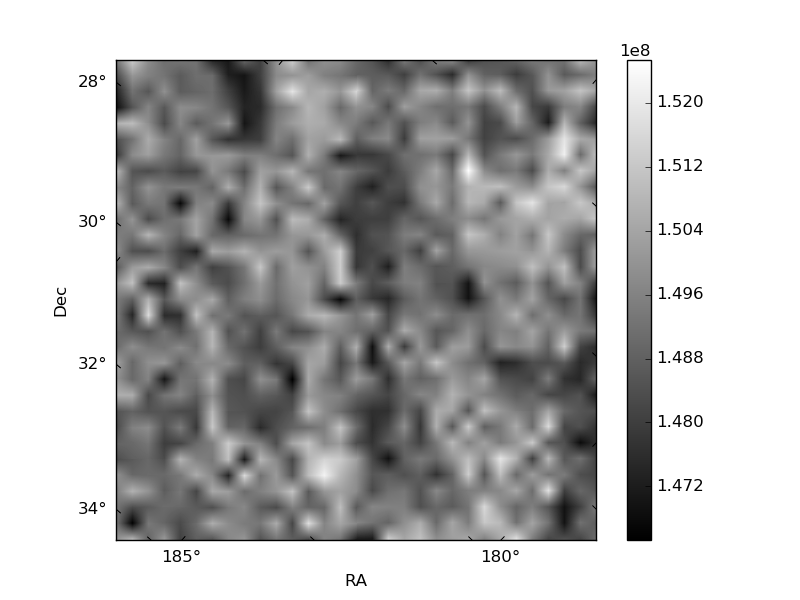
Quadrant B |
|---|---|---|---|
| Quadrant D |  |
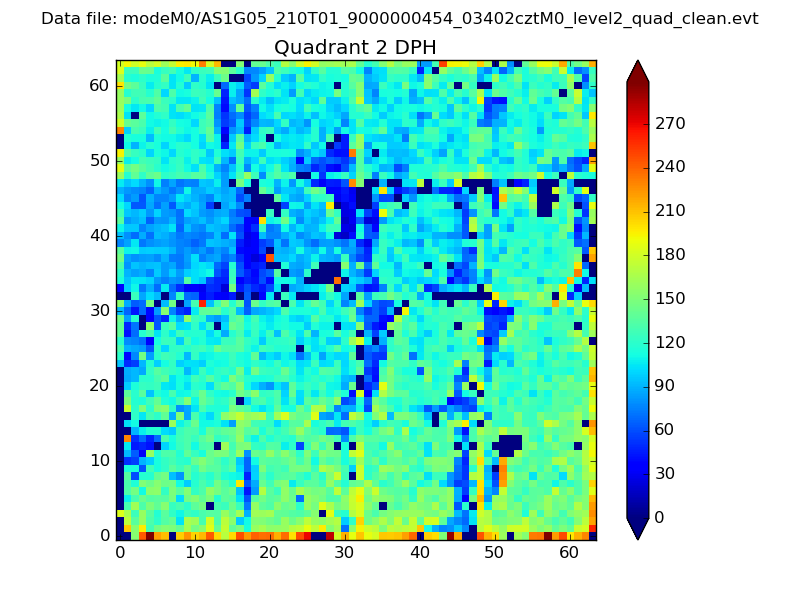 |
Quadrant C |
| Plot type | Count rate plots | Images |
|---|---|---|
| Comparison with Poisson distribution Blue bars denote a histogram of data divided into 1 sec bins. Red curve is a Poisson curve with rate = median count rate of data. |
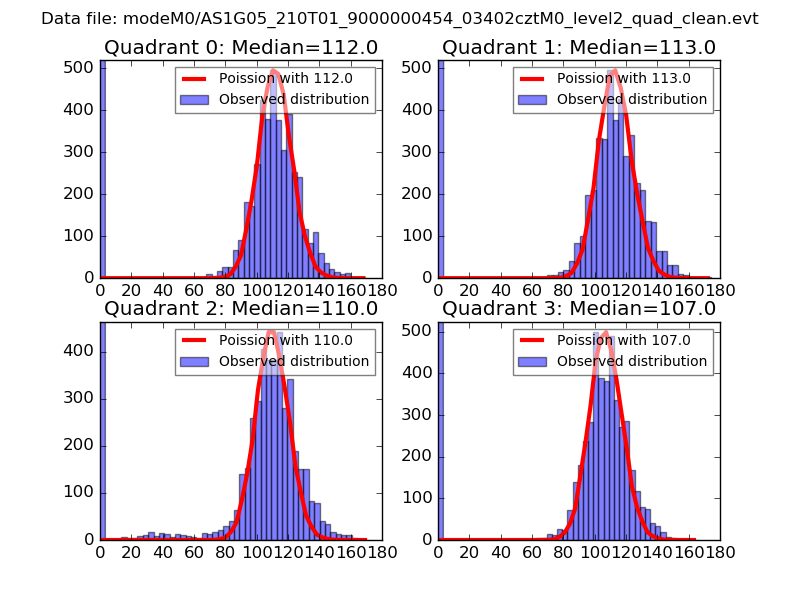 |
 |
| Quadrant-wise count rates Data is divided into 100 sec bins |
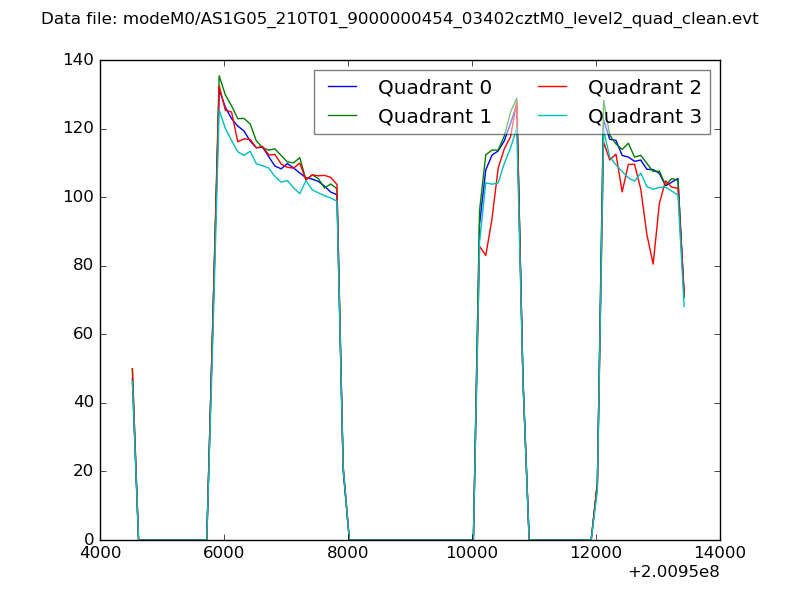 |
|
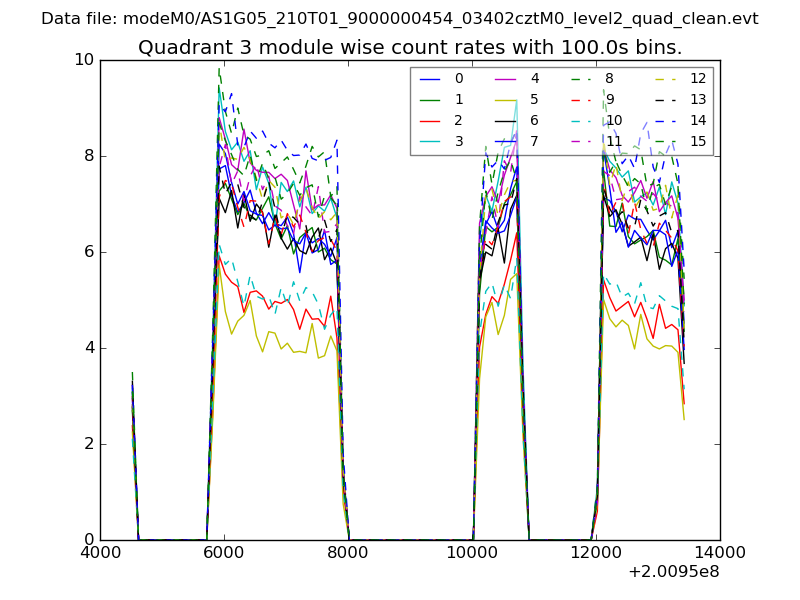
| Module-wise count rates for Quadrant A Data is divided into 100 sec bins |
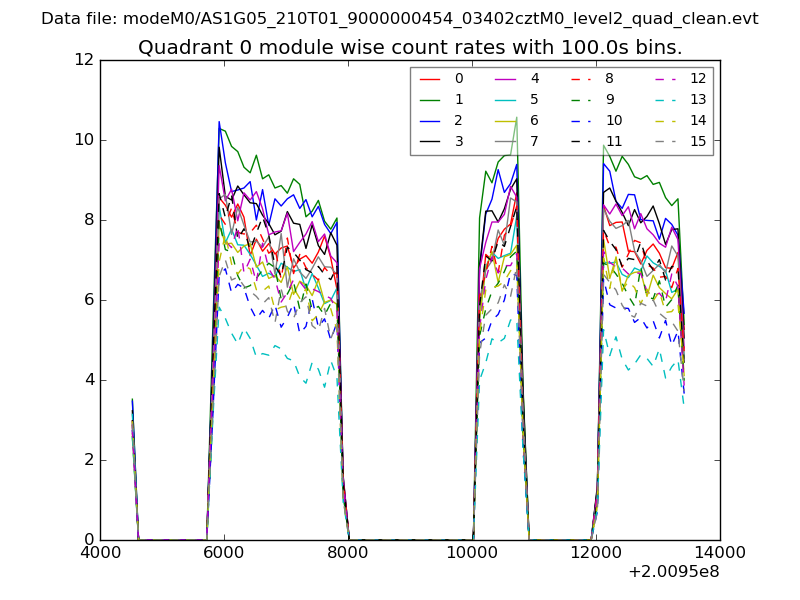 |
 |
| Module-wise count rates for Quadrant B Data is divided into 100 sec bins |
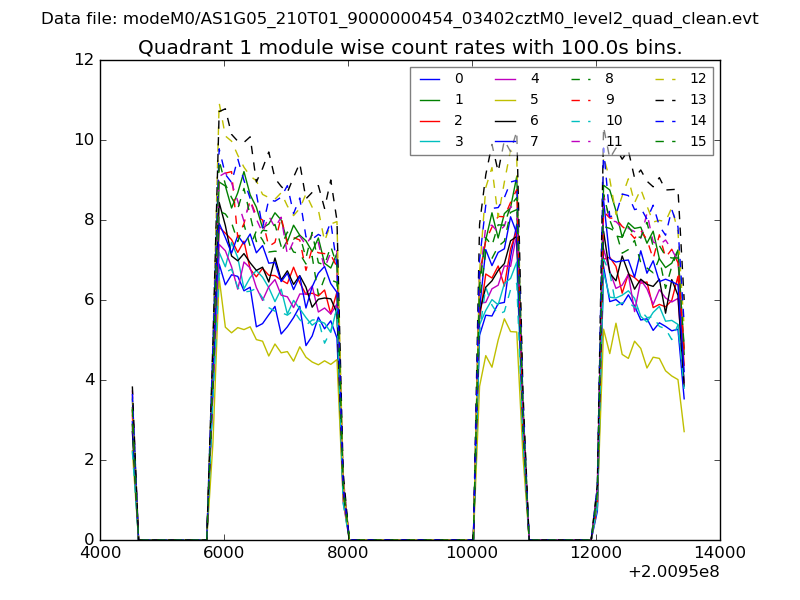 |
 |
| Module-wise count rates for Quadrant C Data is divided into 100 sec bins |
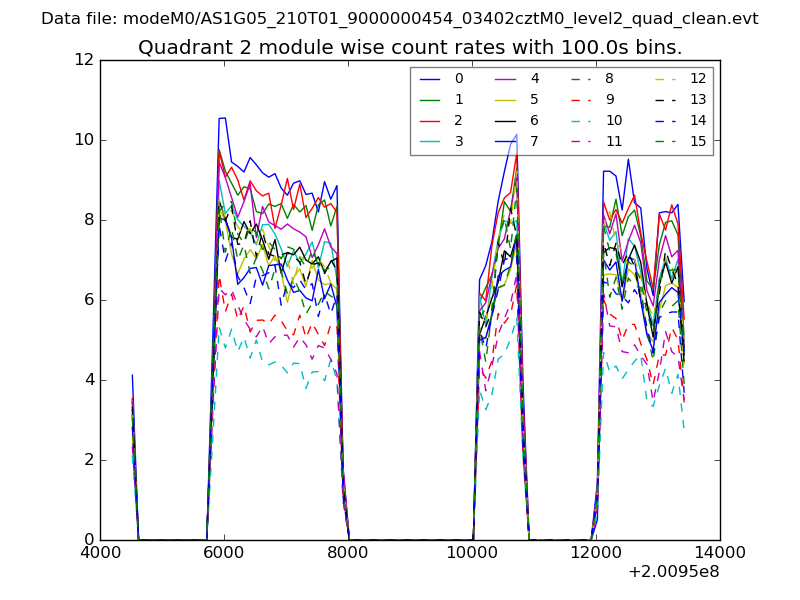 |
 |
| Module-wise count rates for Quadrant D Data is divided into 100 sec bins |
 |
 |
| Parameter | Plot |
|---|---|
| CZT HV Monitor | 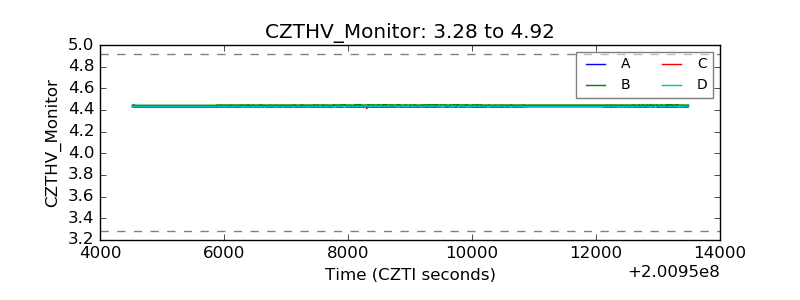 |
| D_VDD | 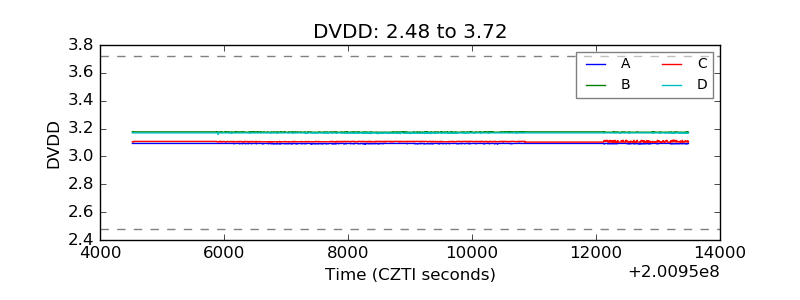 |
| Temperature 1 | 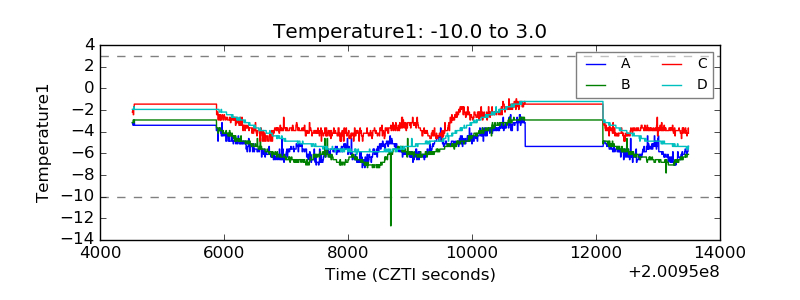 |
| Veto HV Monitor |  |
| Veto LLD | 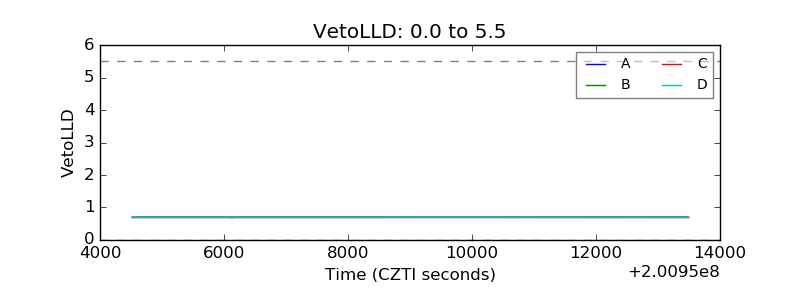 |
| Alpha Counter | 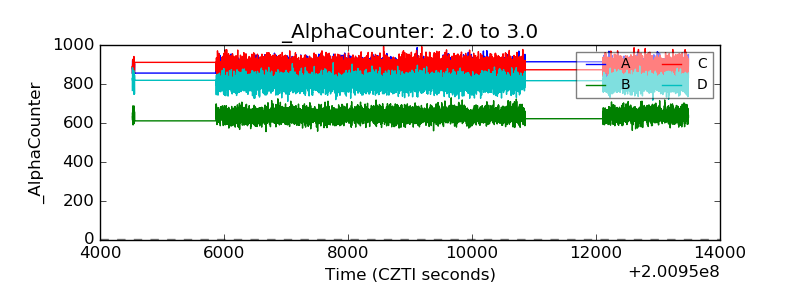 |
| _CPM_Rate | 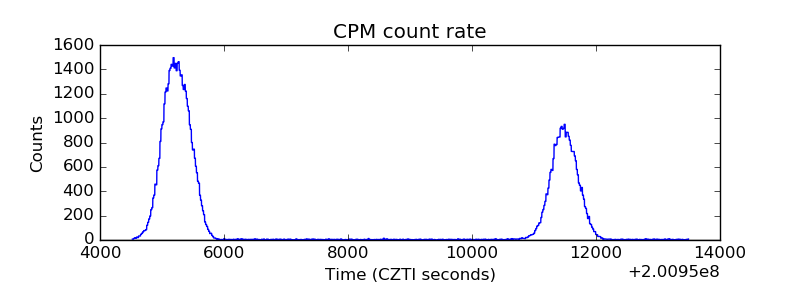 |
| CZT Counter |  |
| +2.5 Volts monitor |  |
| +5 Volts monitor |  |
| _ROLL_ROT | 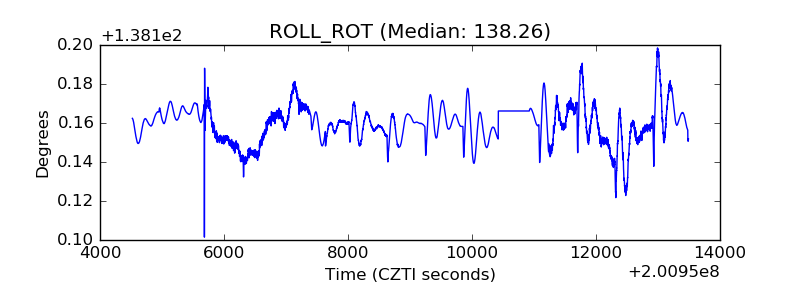 |
| _Roll_DEC | 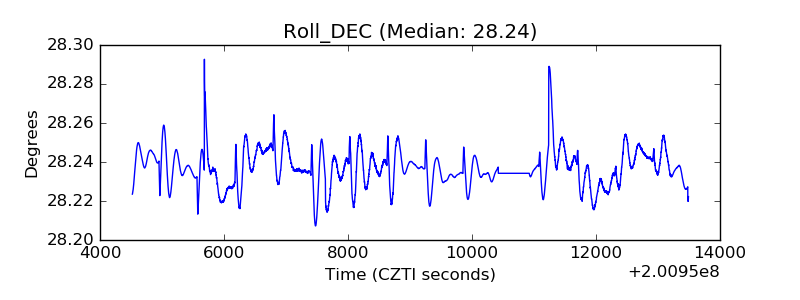 |
| _Roll_RA | 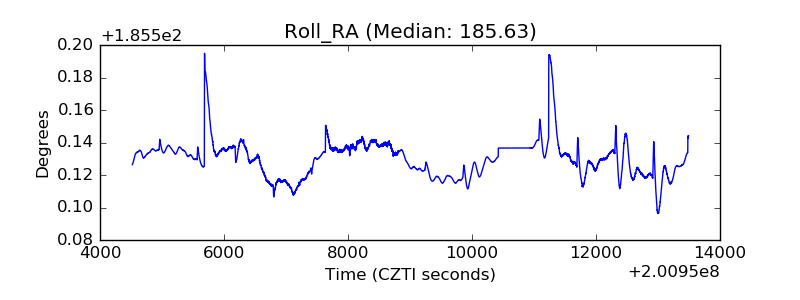 |
| Veto Counter | 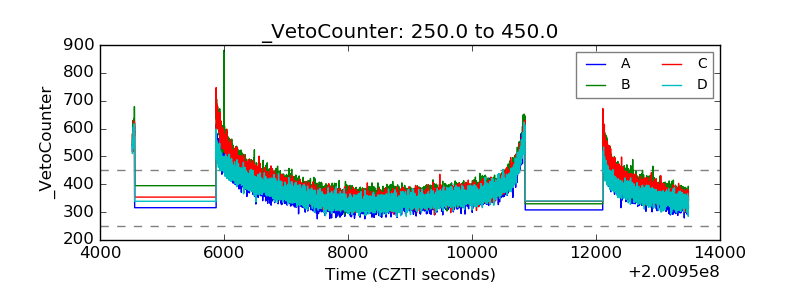 |