| Param | Original file | Final file |
|---|---|---|
| Filename | modeM0/AS1G05_210T01_9000000454_03403cztM0_level2.evt | modeM0/AS1G05_210T01_9000000454_03403cztM0_level2_quad_clean.evt |
| Size (bytes) | 469,249,920 | 74,030,400 |
| Size | 447.5 MB | 70.6 MB |
| Events in quadrant A | 2,878,052 | 455,365 |
| Events in quadrant B | 3,568,191 | 459,737 |
| Events in quadrant C | 4,552,947 | 440,528 |
| Events in quadrant D | 2,775,853 | 437,960 |
| Mode M9 | |||
|---|---|---|---|
| Quadrant | BADHDUFLAG | Total packets | Discarded packets |
| A | 0 | 22 | 0 |
| B | 0 | 22 | 0 |
| C | 0 | 22 | 0 |
| D | 0 | 23 | 0 |
| Mode SS | |||
|---|---|---|---|
| Quadrant | BADHDUFLAG | Total packets | Discarded packets |
| A | 0 | 130 | 0 |
| B | 0 | 130 | 0 |
| C | 0 | 130 | 0 |
| D | 0 | 130 | 0 |
| Mode M0 | |||
|---|---|---|---|
| Quadrant | BADHDUFLAG | Total packets | Discarded packets |
| A | 0 | 13205 | 3 |
| B | 0 | 14895 | 2 |
| C | 0 | 17942 | 2 |
| D | 0 | 13251 | 2 |
| Quadrant | Total seconds | Saturated seconds | Saturation percentage |
|---|---|---|---|
| A | 6422 | 15 | 0.233572% |
| B | 6422 | 35 | 0.545002% |
| C | 6422 | 385 | 5.995017% |
| D | 6422 | 16 | 0.249144% |
Noise dominated data is calculated using 1-second bins in cleaned event files. If a bin has >2000 counts, and if more than 50% of those come from <1% of pixels, then it is considered to be noise-dominated and hence unusable.
| Quadrant | # 1 sec bins | Bins with >0 counts | Bins with >2000 counts | High rate bins dominated by noise | Noise dominated (total time) | Noise dominated (detector-on time) | Marked lightcurve |
|---|---|---|---|---|---|---|---|
| A | 7517 | 6423 | 2 | 2 | 0.03% | 0.03% | 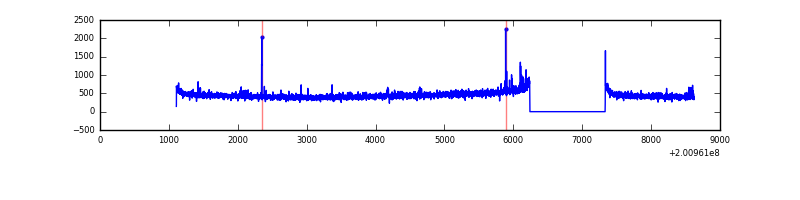 |
| B | 7517 | 6423 | 3 | 3 | 0.04% | 0.05% | 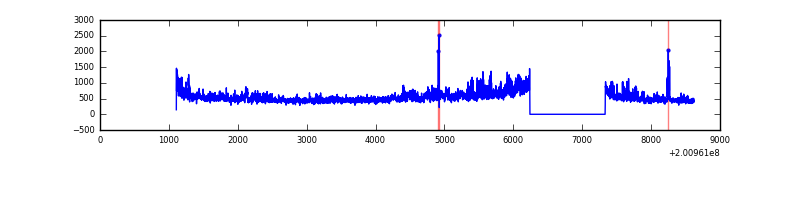 |
| C | 7517 | 6423 | 250 | 250 | 3.33% | 3.89% | 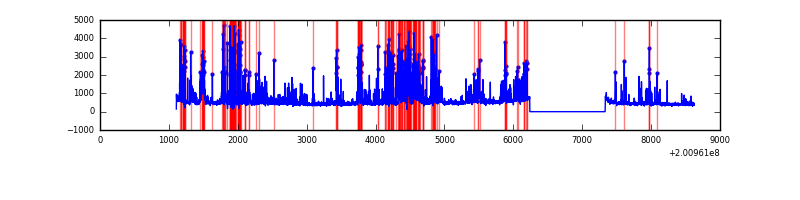 |
| D | 7517 | 6423 | 8 | 8 | 0.11% | 0.12% | 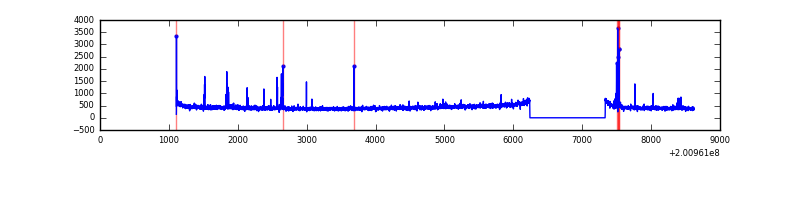 |
Top three noisy pixels from each quadrant. If the there are fewer than three noisy pixels in the level2.evt file, extra rows are filled as -1
| Pixel properties | Quadrant properties | ||||||
|---|---|---|---|---|---|---|---|
| Quadrant | DetID | PixID | Counts | Sigma | Mean | Median | Sigma |
| A | 0 | 31 | 24394 | 156.42 | 733 | 718 | 151.4 |
| A | 0 | 118 | 20246 | 129.02 | 733 | 718 | 151.4 |
| A | 0 | 226 | 9436 | 57.6 | 733 | 718 | 151.4 |
| B | 15 | 204 | 588568 | 4035.28 | 748 | 728 | 145.7 |
| B | 0 | 229 | 29282 | 196.01 | 748 | 728 | 145.7 |
| B | 0 | 182 | 28972 | 193.88 | 748 | 728 | 145.7 |
| C | 7 | 220 | 1530244 | 9369.93 | 701 | 705 | 163.2 |
| C | 14 | 234 | 222336 | 1357.71 | 701 | 705 | 163.2 |
| C | 8 | 128 | 20996 | 124.3 | 701 | 705 | 163.2 |
| D | 13 | 223 | 48938 | 279.17 | 707 | 684 | 172.8 |
| D | 13 | 239 | 21666 | 121.39 | 707 | 684 | 172.8 |
| D | 5 | 233 | 13092 | 71.78 | 707 | 684 | 172.8 |
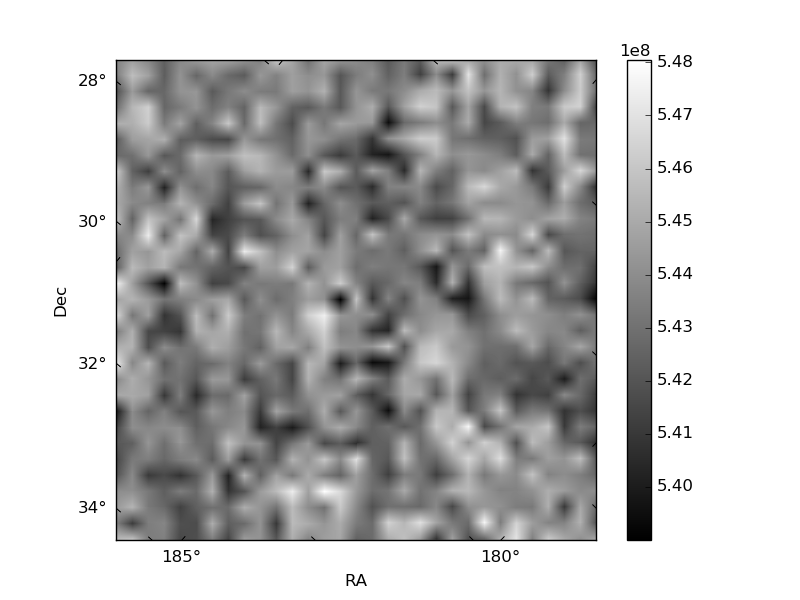
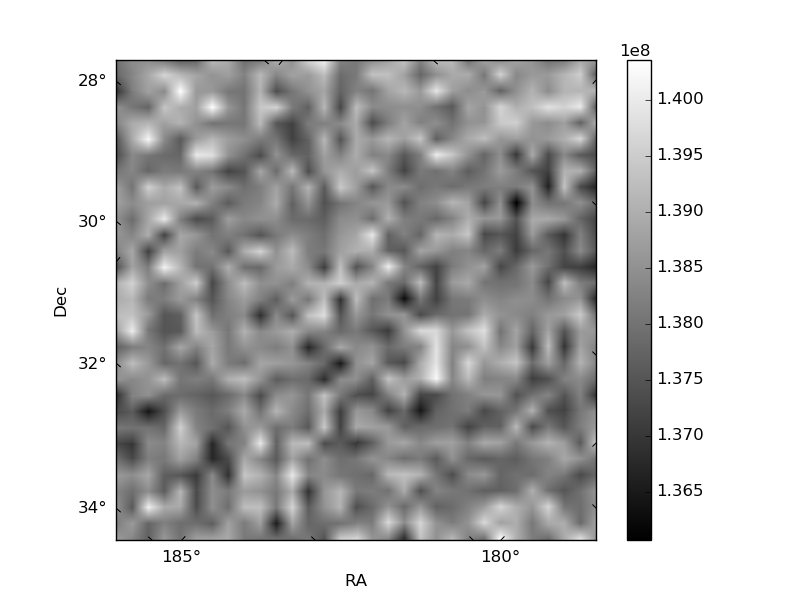
Histogram calculated using DETX and DETY for each event in the final _common_clean file
| Quadrant A | 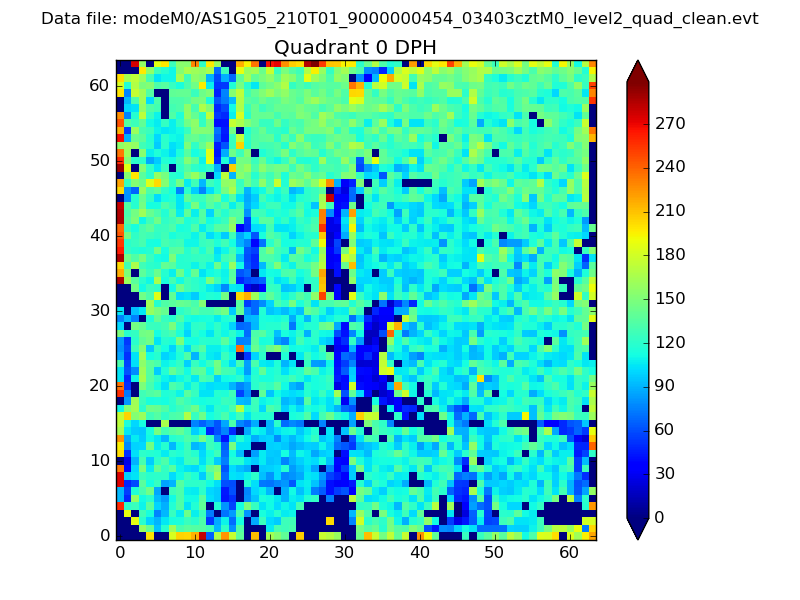 |
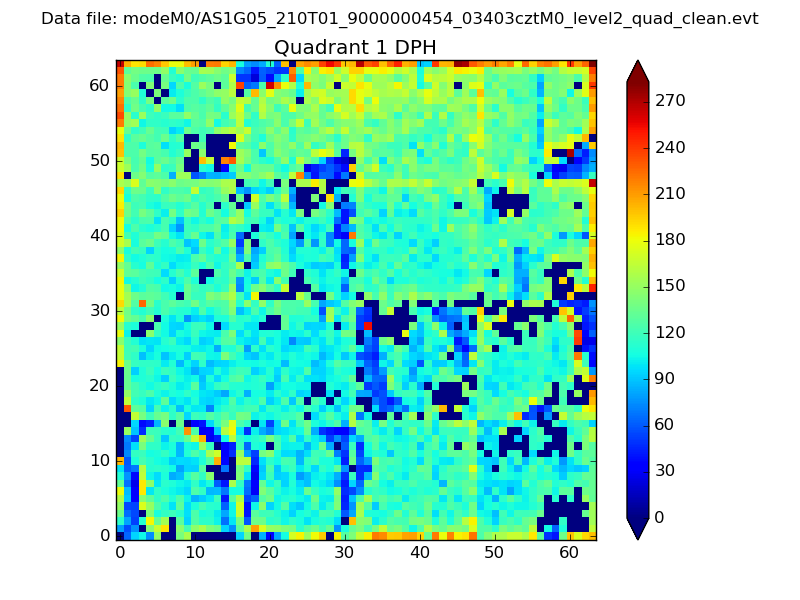 |
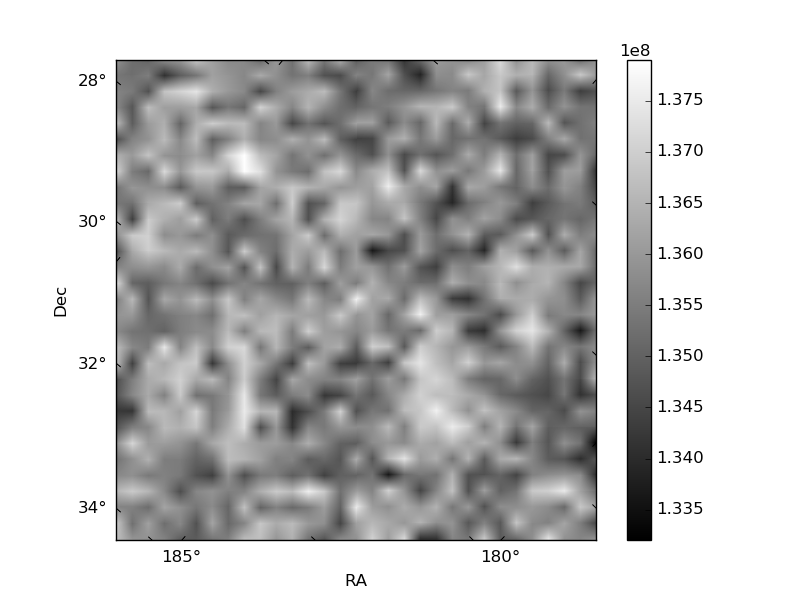
Quadrant B |
|---|---|---|---|
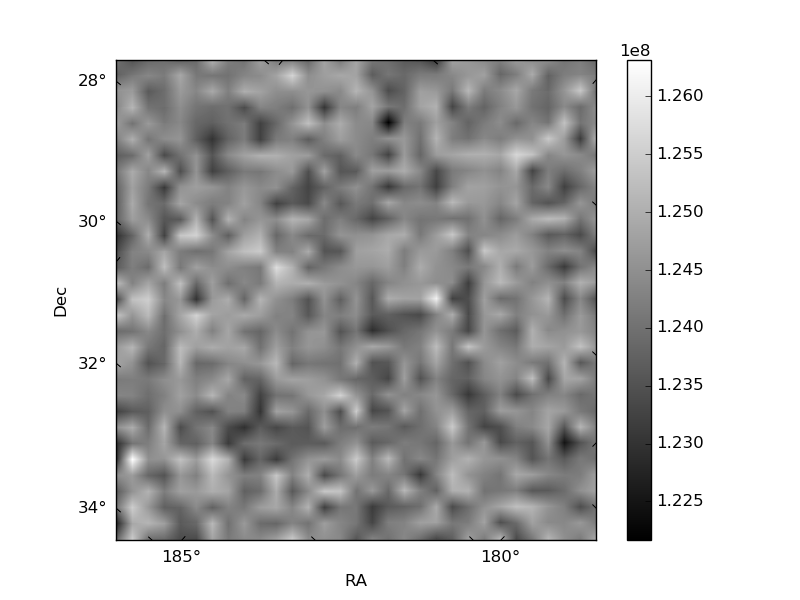
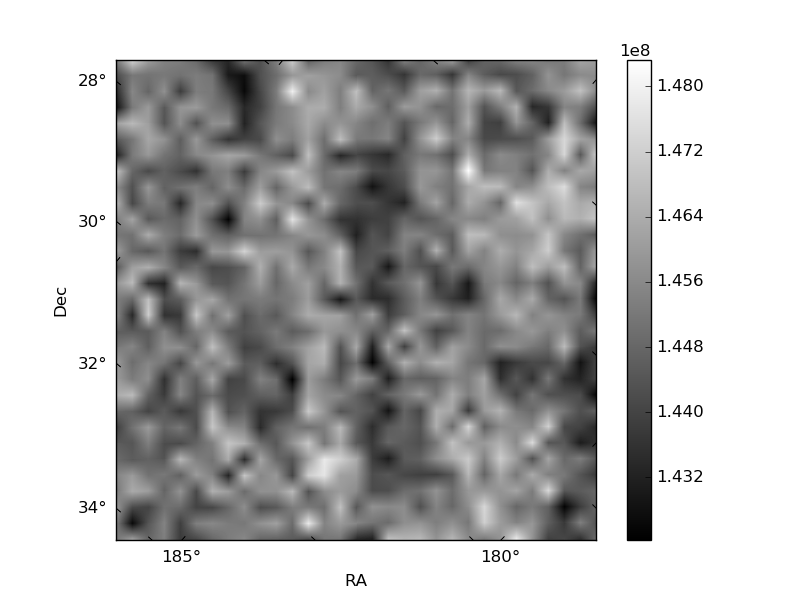
| Quadrant D | 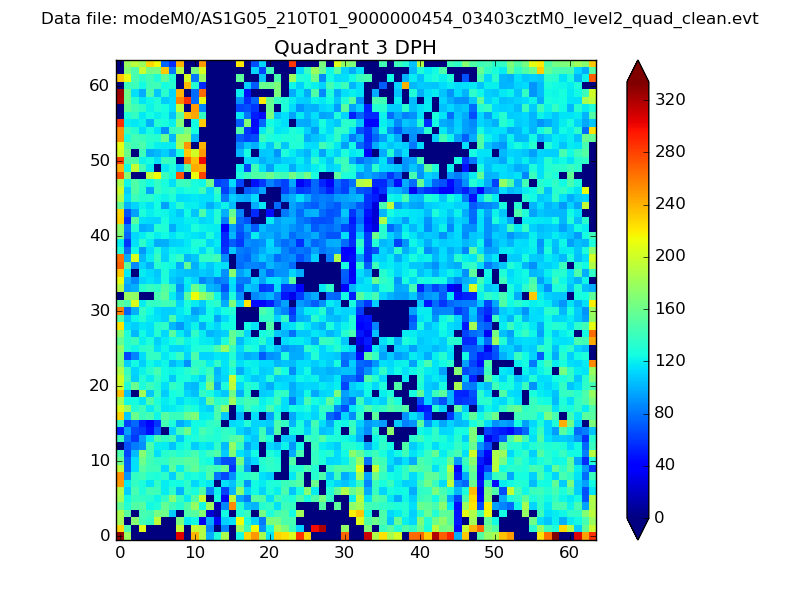 |
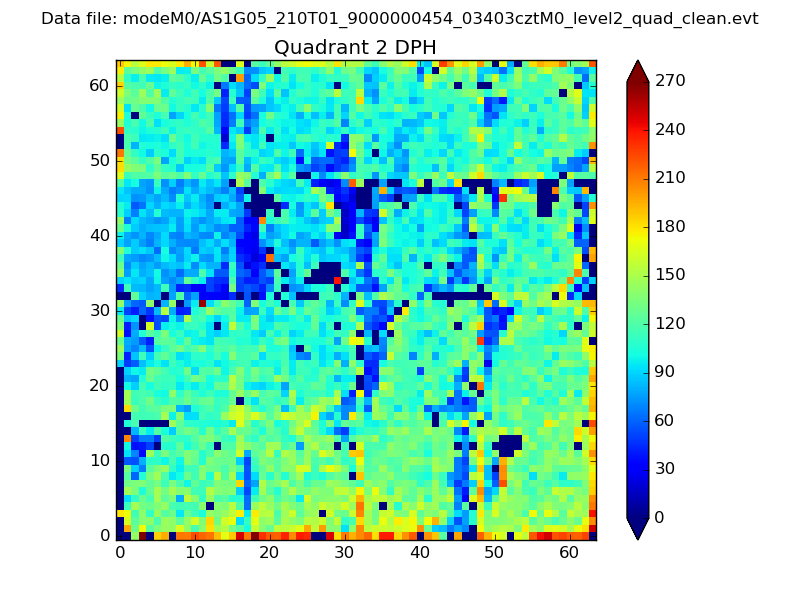 |
Quadrant C |
| Plot type | Count rate plots | Images |
|---|---|---|
| Comparison with Poisson distribution Blue bars denote a histogram of data divided into 1 sec bins. Red curve is a Poisson curve with rate = median count rate of data. |
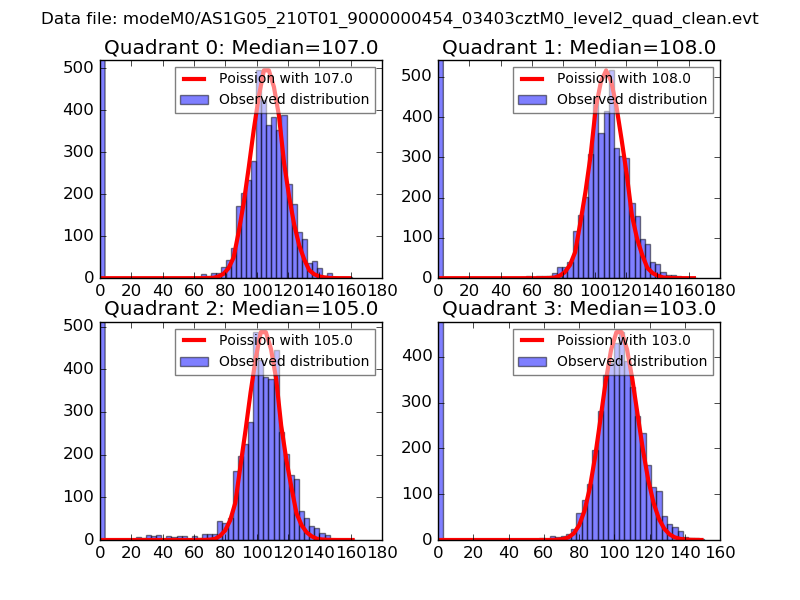 |
 |
| Quadrant-wise count rates Data is divided into 100 sec bins |
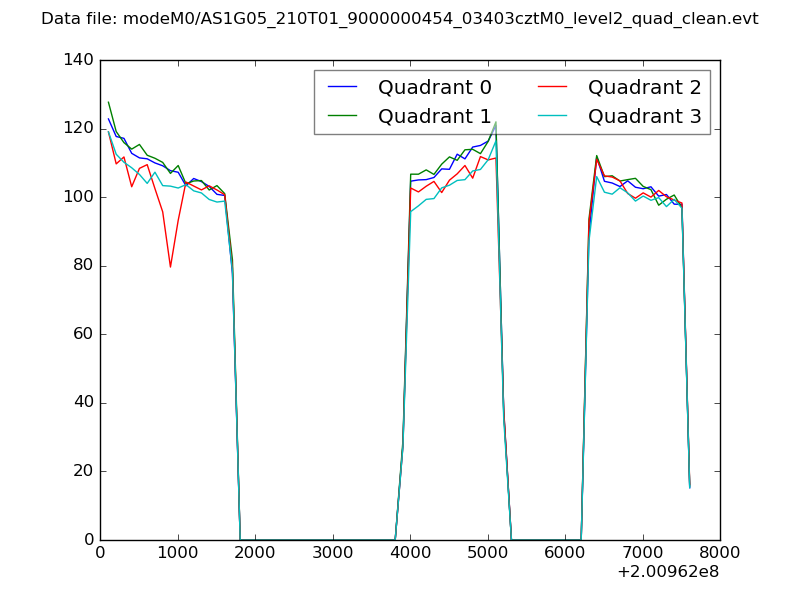 |
|
| Module-wise count rates for Quadrant A Data is divided into 100 sec bins |
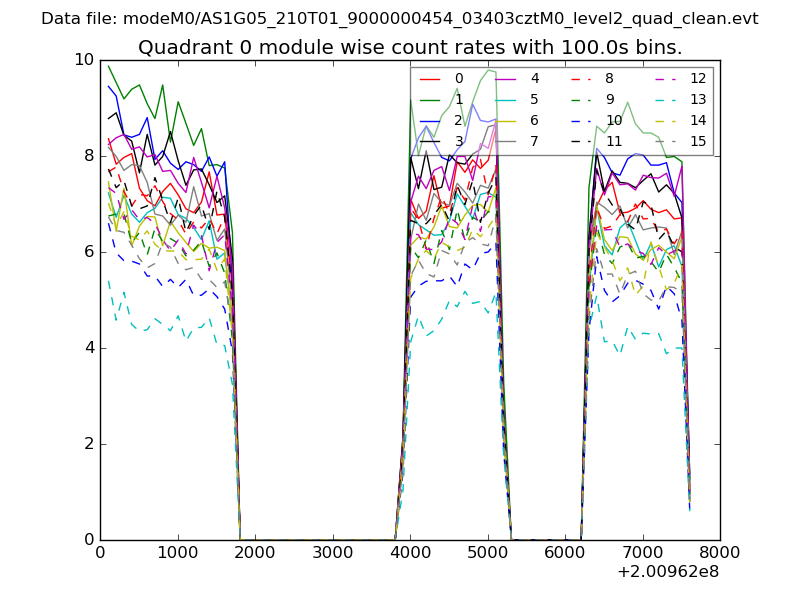 |
 |
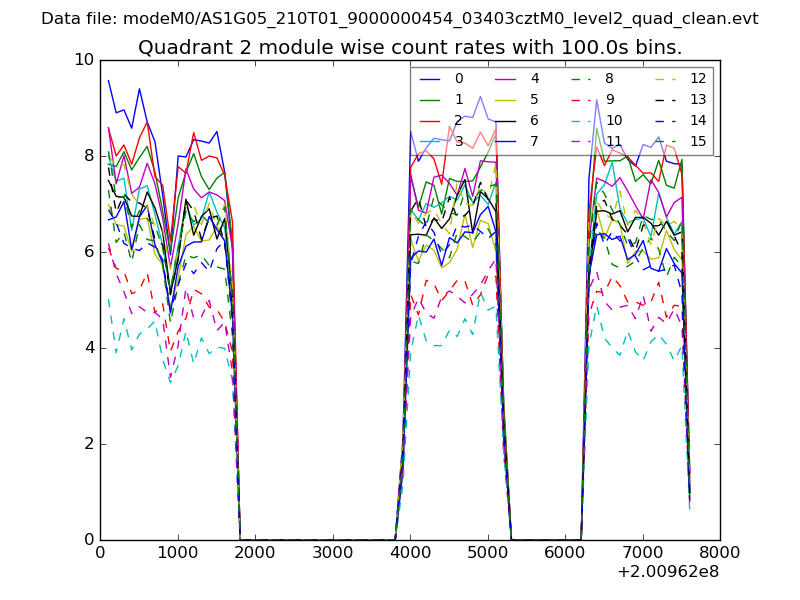
| Module-wise count rates for Quadrant B Data is divided into 100 sec bins |
 |
 |
| Module-wise count rates for Quadrant C Data is divided into 100 sec bins |
 |
 |
| Module-wise count rates for Quadrant D Data is divided into 100 sec bins |
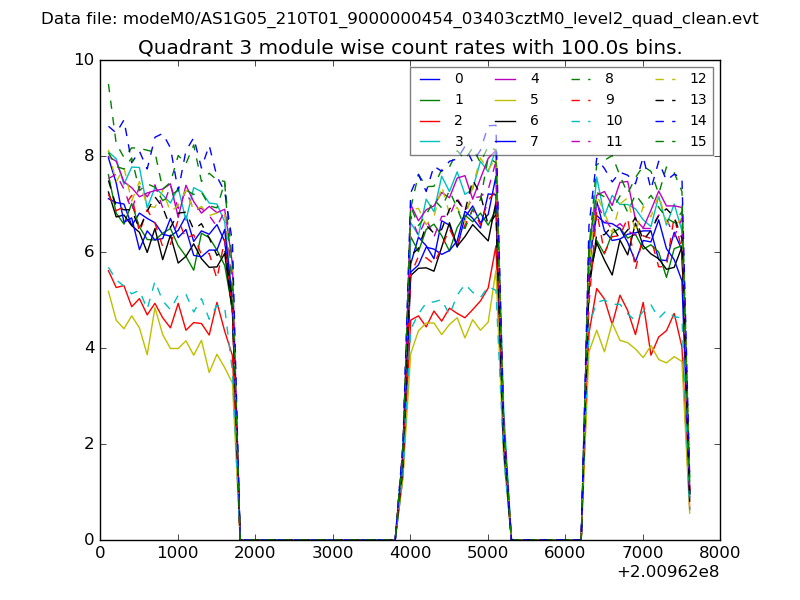 |
 |
| Parameter | Plot |
|---|---|
| CZT HV Monitor | 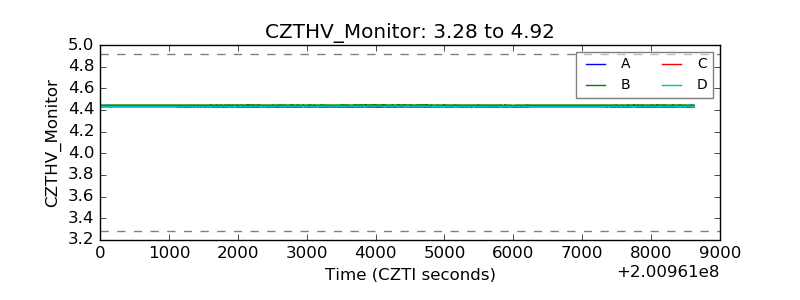 |
| D_VDD | 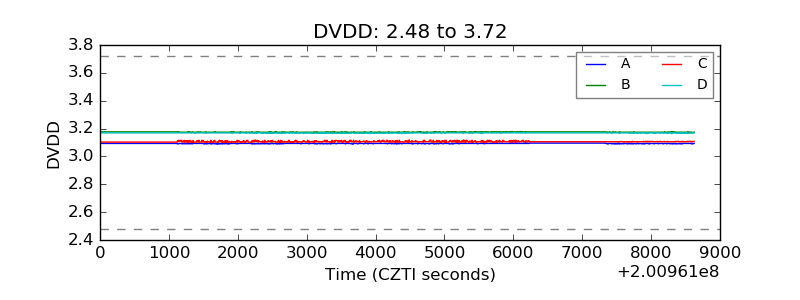 |
| Temperature 1 | 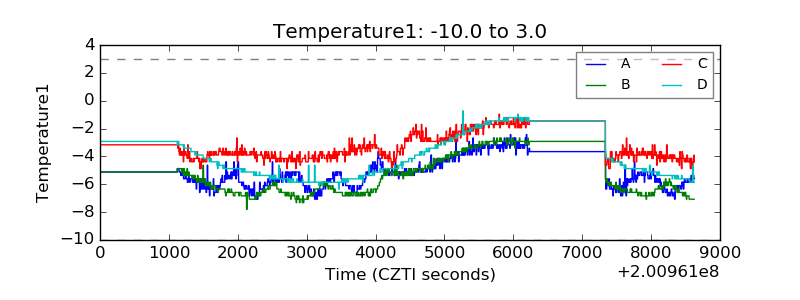 |
| Veto HV Monitor | 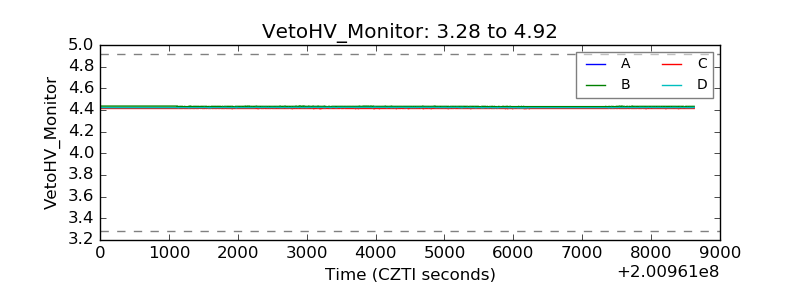 |
| Veto LLD | 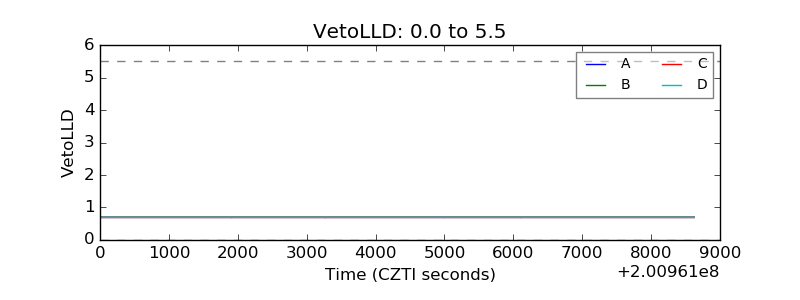 |
| Alpha Counter | 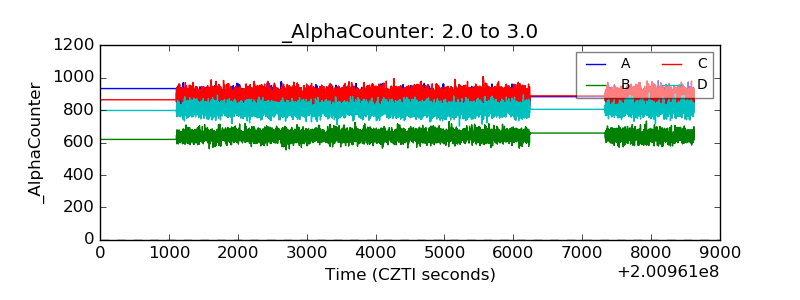 |
| _CPM_Rate | 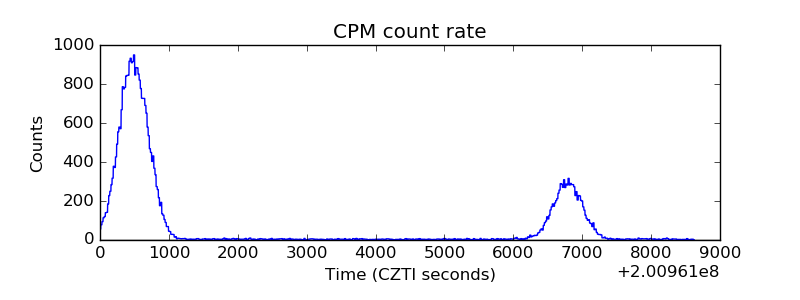 |
| CZT Counter | 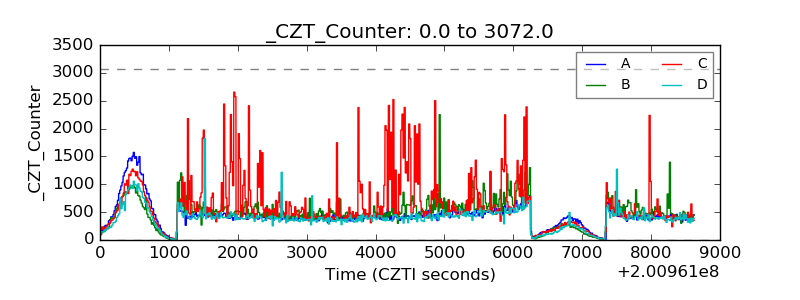 |
| +2.5 Volts monitor | 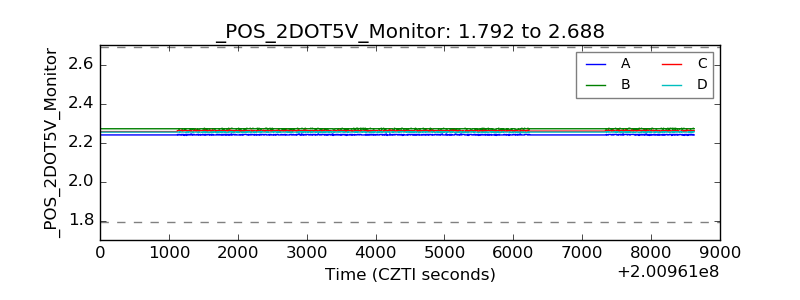 |
| +5 Volts monitor | 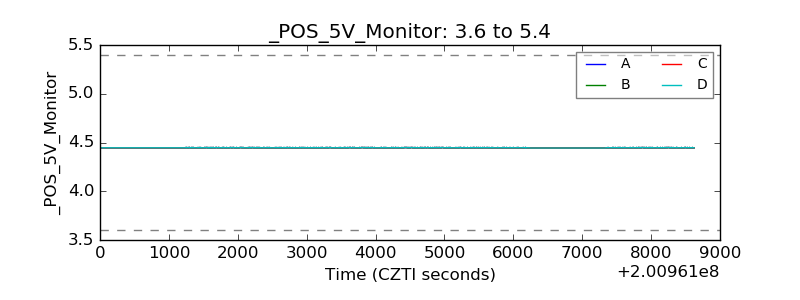 |
| _ROLL_ROT | 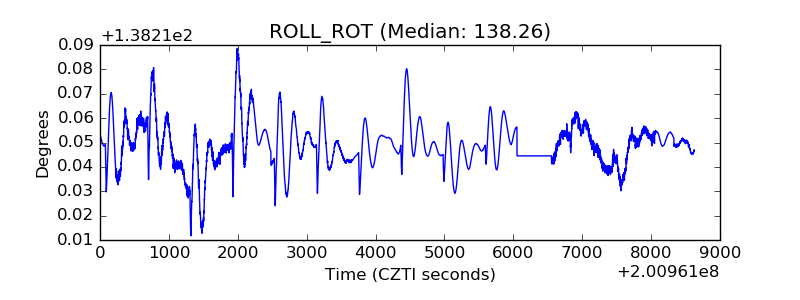 |
| _Roll_DEC | 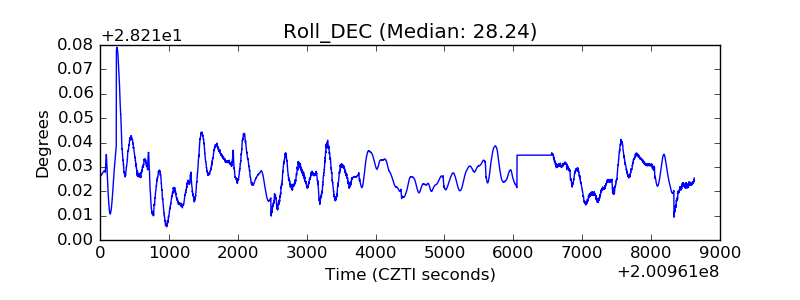 |
| _Roll_RA | 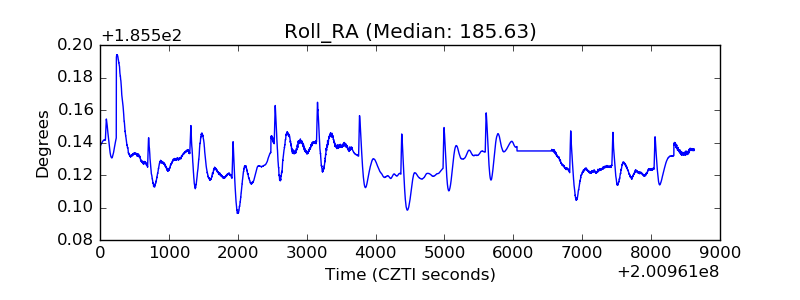 |
| Veto Counter | 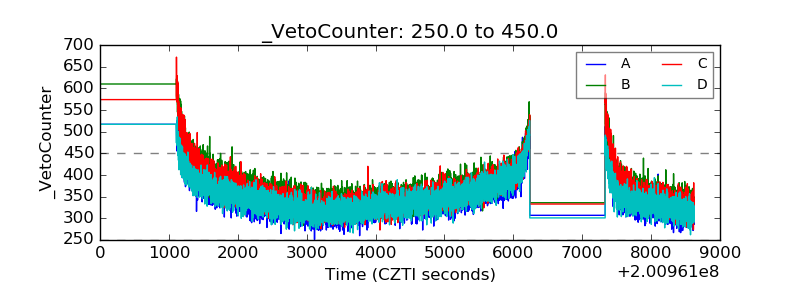 |