| Param | Original file | Final file |
|---|---|---|
| Filename | modeM0/AS1G05_210T01_9000000454_03404cztM0_level2.evt | modeM0/AS1G05_210T01_9000000454_03404cztM0_level2_quad_clean.evt |
| Size (bytes) | 467,432,640 | 75,513,600 |
| Size | 445.8 MB | 72.0 MB |
| Events in quadrant A | 3,111,177 | 454,378 |
| Events in quadrant B | 3,994,211 | 453,637 |
| Events in quadrant C | 3,535,506 | 450,415 |
| Events in quadrant D | 3,039,521 | 440,423 |
| Mode M9 | |||
|---|---|---|---|
| Quadrant | BADHDUFLAG | Total packets | Discarded packets |
| A | 0 | 15 | 0 |
| B | 0 | 15 | 0 |
| C | 0 | 15 | 0 |
| D | 0 | 16 | 0 |
| Mode SS | |||
|---|---|---|---|
| Quadrant | BADHDUFLAG | Total packets | Discarded packets |
| A | 0 | 142 | 0 |
| B | 0 | 142 | 0 |
| C | 0 | 142 | 0 |
| D | 0 | 142 | 0 |
| Mode M0 | |||
|---|---|---|---|
| Quadrant | BADHDUFLAG | Total packets | Discarded packets |
| A | 0 | 14372 | 3 |
| B | 0 | 16600 | 2 |
| C | 0 | 15539 | 2 |
| D | 0 | 14450 | 2 |
| Quadrant | Total seconds | Saturated seconds | Saturation percentage |
|---|---|---|---|
| A | 7007 | 72 | 1.027544% |
| B | 7007 | 115 | 1.641216% |
| C | 7007 | 108 | 1.541316% |
| D | 7007 | 24 | 0.342515% |
Noise dominated data is calculated using 1-second bins in cleaned event files. If a bin has >2000 counts, and if more than 50% of those come from <1% of pixels, then it is considered to be noise-dominated and hence unusable.
| Quadrant | # 1 sec bins | Bins with >0 counts | Bins with >2000 counts | High rate bins dominated by noise | Noise dominated (total time) | Noise dominated (detector-on time) | Marked lightcurve |
|---|---|---|---|---|---|---|---|
| A | 7677 | 7009 | 1 | 1 | 0.01% | 0.01% | 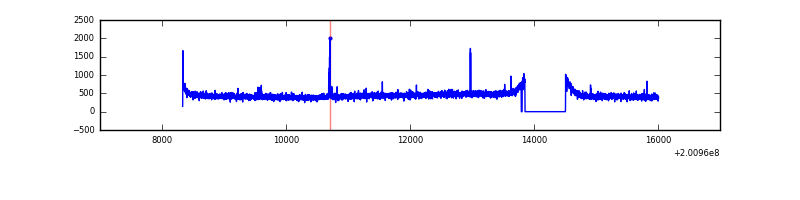 |
| B | 7677 | 7009 | 1 | 1 | 0.01% | 0.01% | 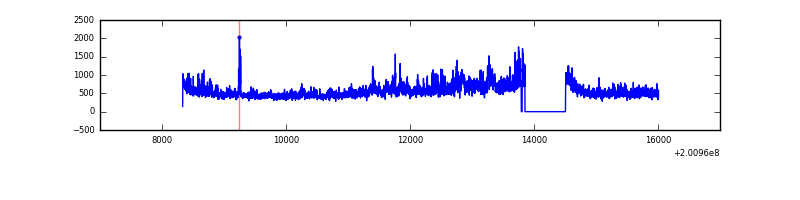 |
| C | 7677 | 7009 | 49 | 49 | 0.64% | 0.70% |  |
| D | 7677 | 7009 | 6 | 6 | 0.08% | 0.09% | 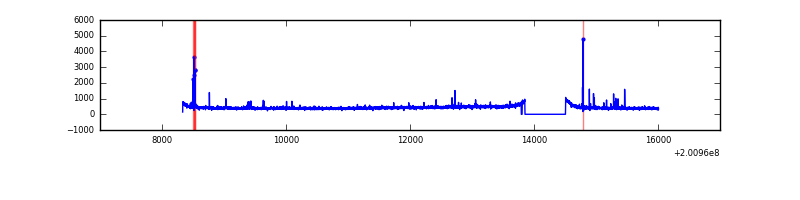 |
Top three noisy pixels from each quadrant. If the there are fewer than three noisy pixels in the level2.evt file, extra rows are filled as -1
| Pixel properties | Quadrant properties | ||||||
|---|---|---|---|---|---|---|---|
| Quadrant | DetID | PixID | Counts | Sigma | Mean | Median | Sigma |
| A | 0 | 118 | 24657 | 143.12 | 800 | 781 | 166.8 |
| A | 0 | 226 | 10439 | 57.89 | 800 | 781 | 166.8 |
| A | 12 | 194 | 8348 | 45.36 | 800 | 781 | 166.8 |
| B | 15 | 204 | 729260 | 4598.03 | 814 | 793 | 158.4 |
| B | 14 | 167 | 63176 | 393.76 | 814 | 793 | 158.4 |
| B | 0 | 182 | 23942 | 146.11 | 814 | 793 | 158.4 |
| C | 7 | 220 | 302061 | 1650.51 | 779 | 780 | 182.5 |
| C | 1 | 16 | 146580 | 798.74 | 779 | 780 | 182.5 |
| C | 6 | 80 | 14507 | 75.2 | 779 | 780 | 182.5 |
| D | 13 | 223 | 33655 | 174.15 | 775 | 753 | 188.9 |
| D | 2 | 54 | 23064 | 118.09 | 775 | 753 | 188.9 |
| D | 12 | 246 | 16861 | 85.26 | 775 | 753 | 188.9 |
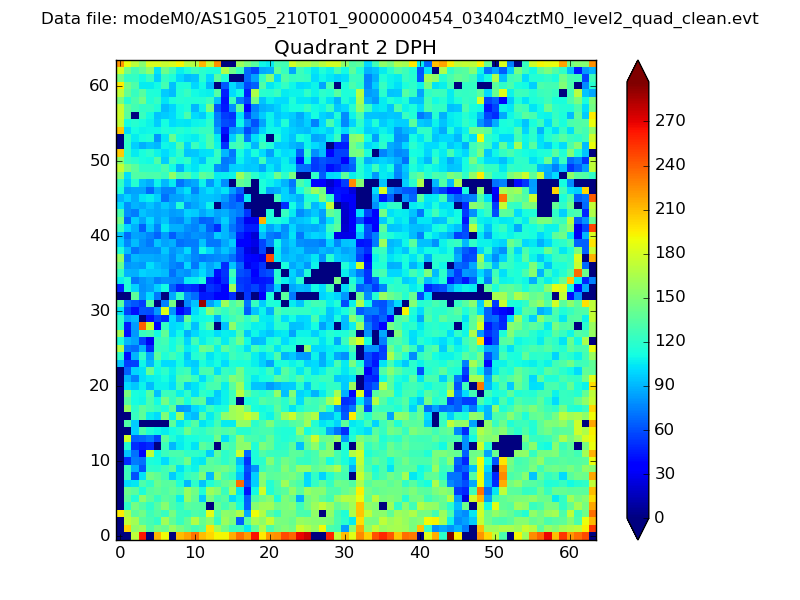
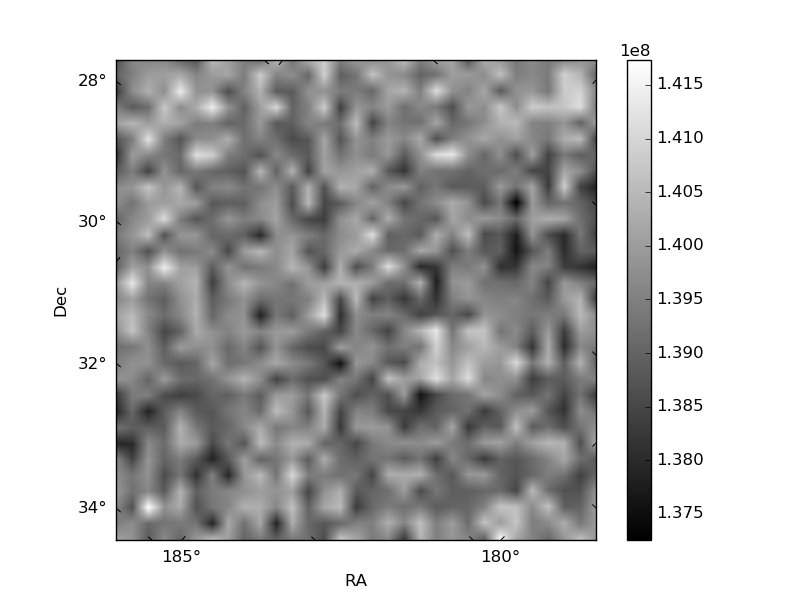
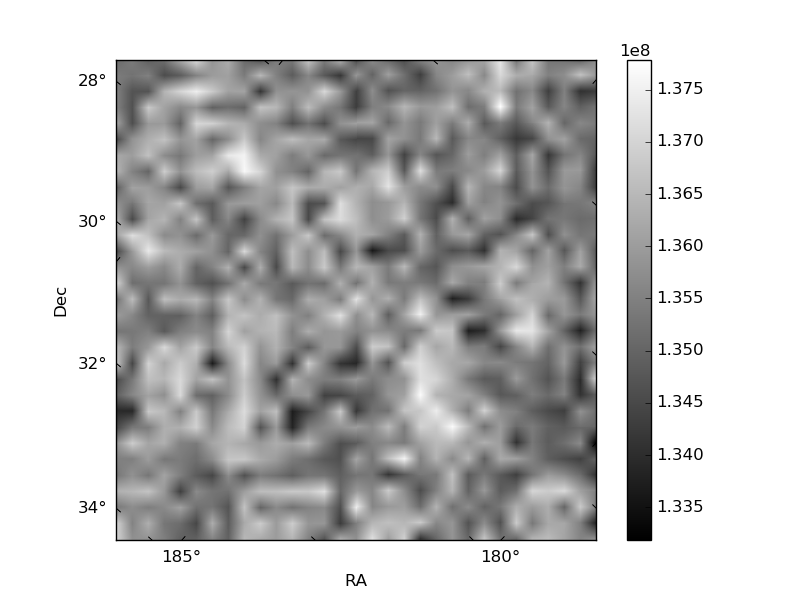
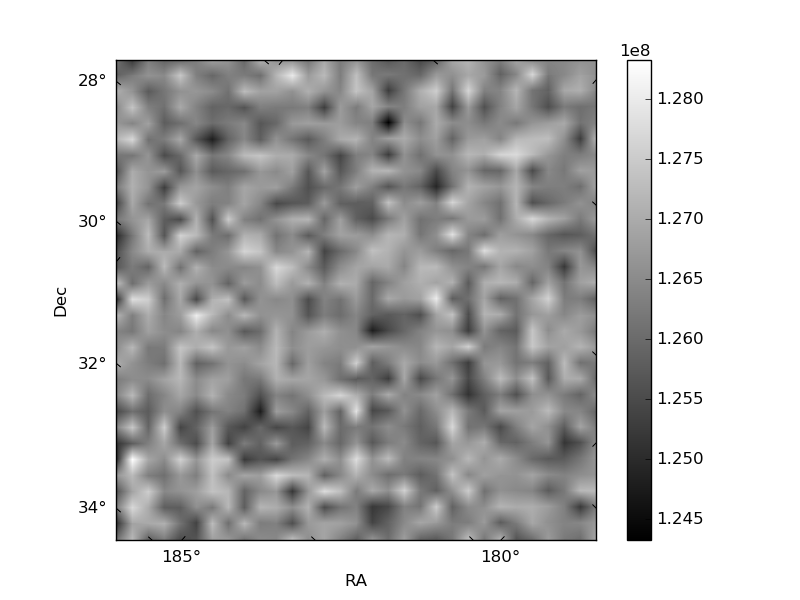
Histogram calculated using DETX and DETY for each event in the final _common_clean file
| Quadrant A | 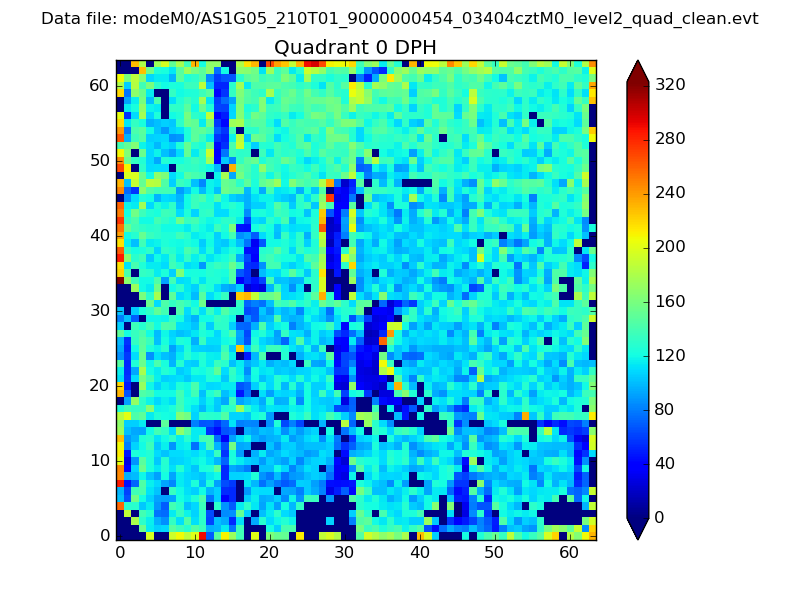 |
 |
Quadrant B |
|---|---|---|---|
| Quadrant D | 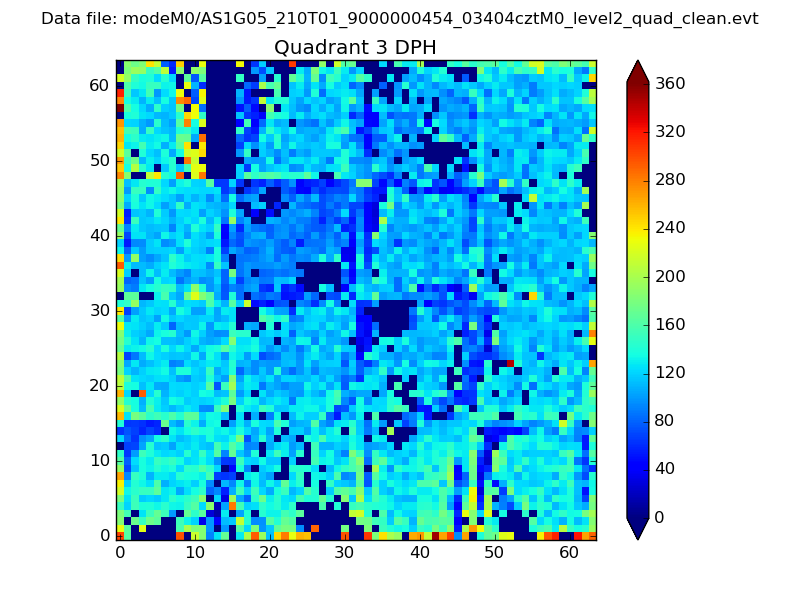 |
 |
Quadrant C |
| Plot type | Count rate plots | Images |
|---|---|---|
| Comparison with Poisson distribution Blue bars denote a histogram of data divided into 1 sec bins. Red curve is a Poisson curve with rate = median count rate of data. |
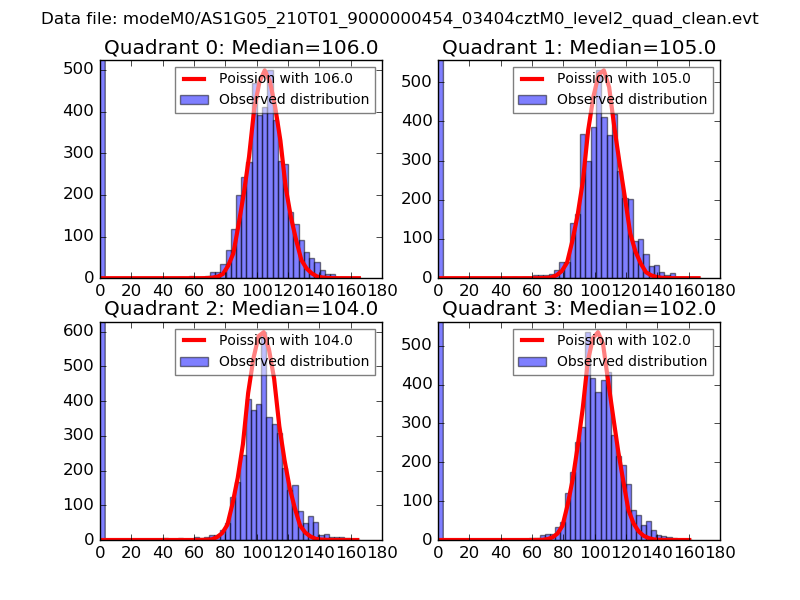 |
 |
| Quadrant-wise count rates Data is divided into 100 sec bins |
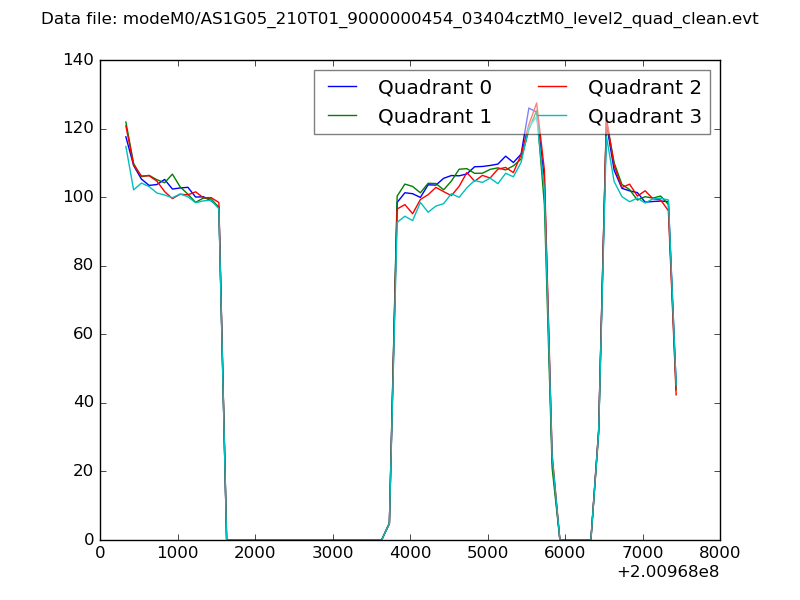 |
|
| Module-wise count rates for Quadrant A Data is divided into 100 sec bins |
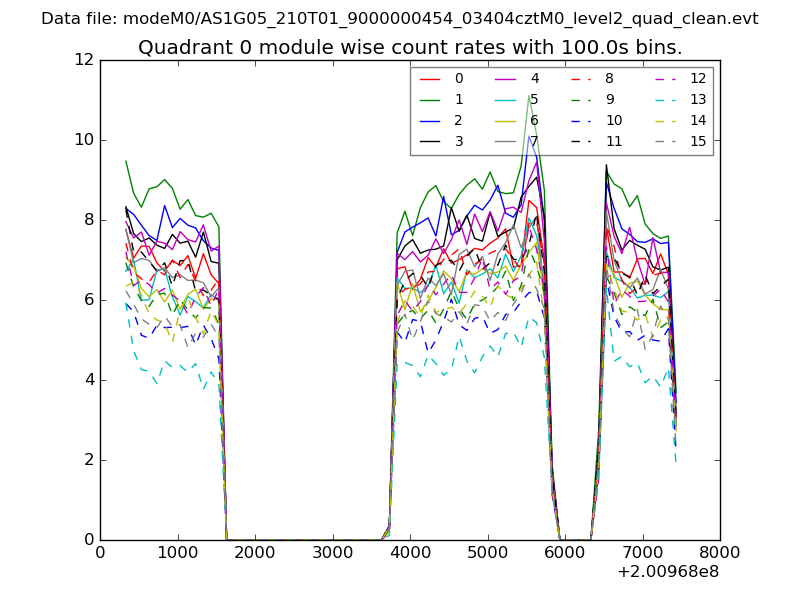 |
 |
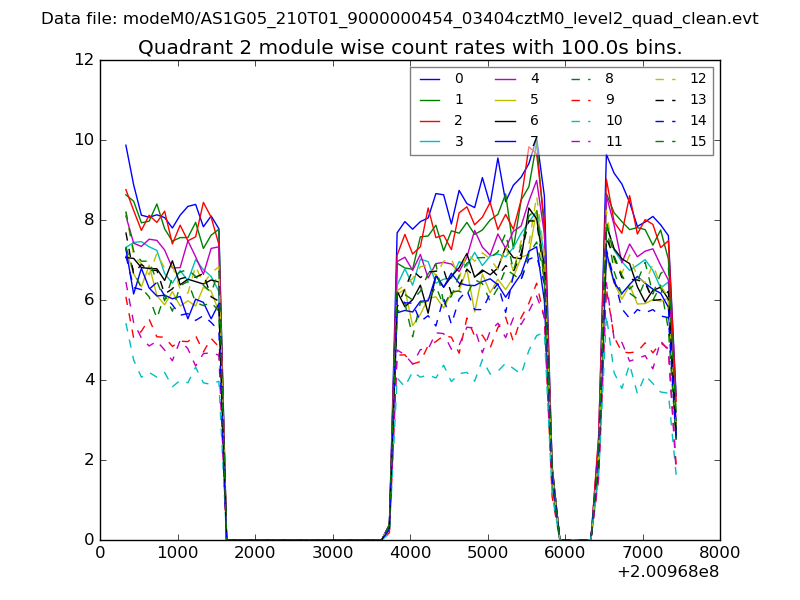
| Module-wise count rates for Quadrant B Data is divided into 100 sec bins |
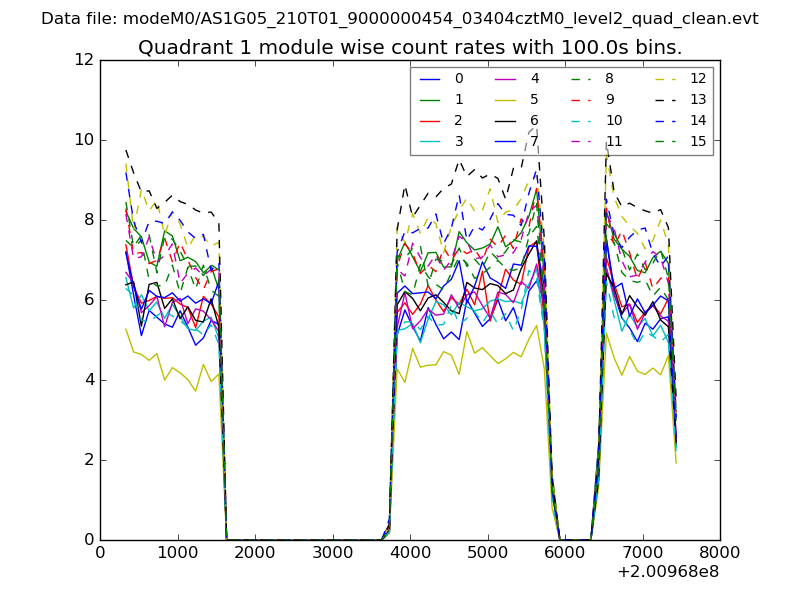 |
 |
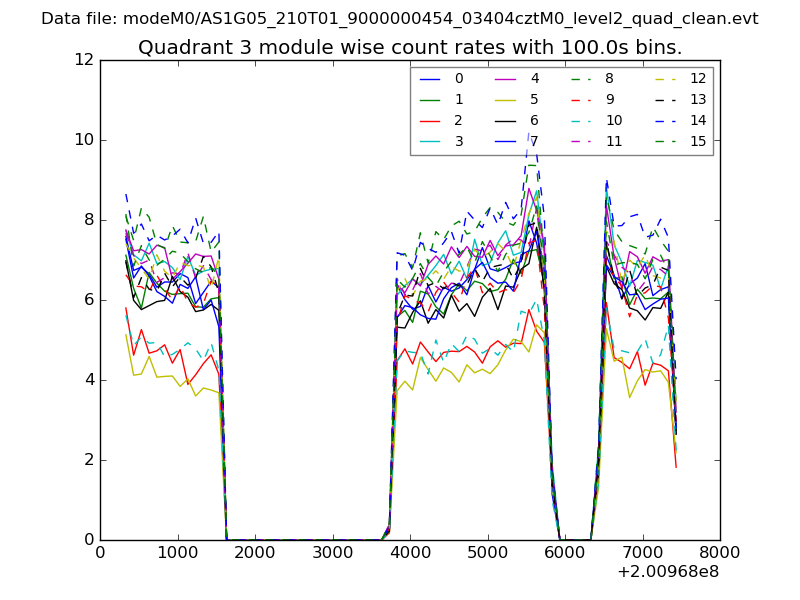
| Module-wise count rates for Quadrant C Data is divided into 100 sec bins |
 |
 |
| Module-wise count rates for Quadrant D Data is divided into 100 sec bins |
 |
 |
| Parameter | Plot |
|---|---|
| CZT HV Monitor | 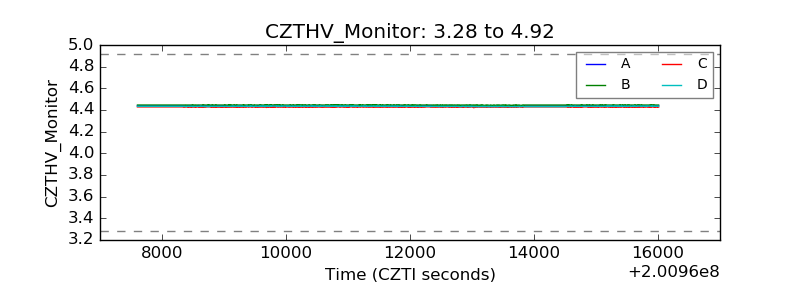 |
| D_VDD | 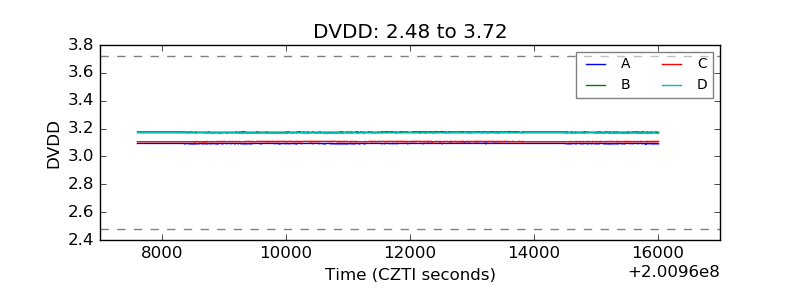 |
| Temperature 1 | 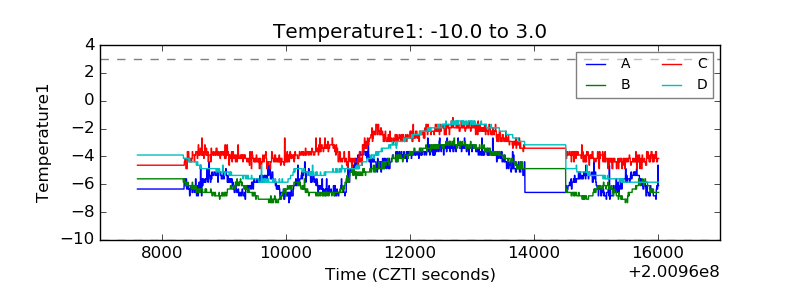 |
| Veto HV Monitor | 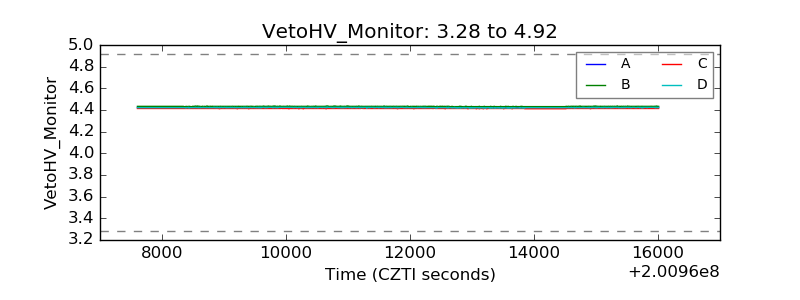 |
| Veto LLD | 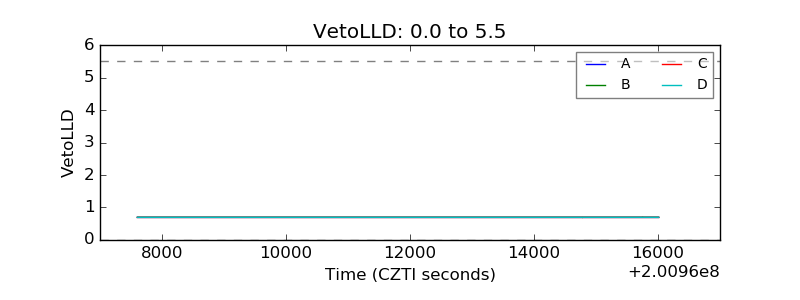 |
| Alpha Counter | 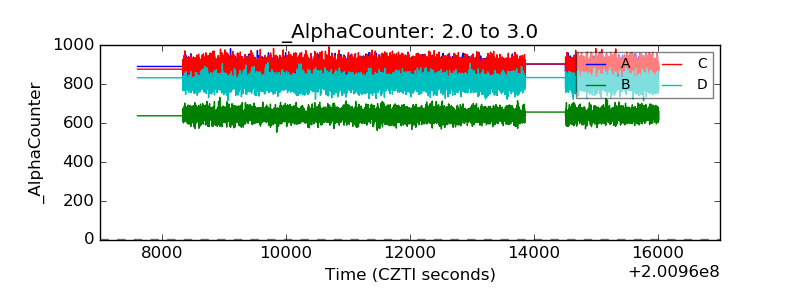 |
| _CPM_Rate | 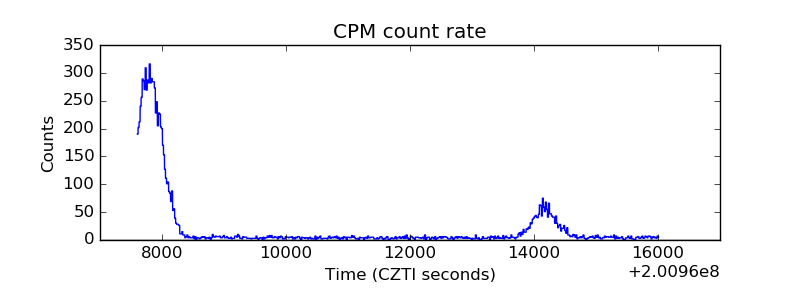 |
| CZT Counter |  |
| +2.5 Volts monitor |  |
| +5 Volts monitor |  |
| _ROLL_ROT | 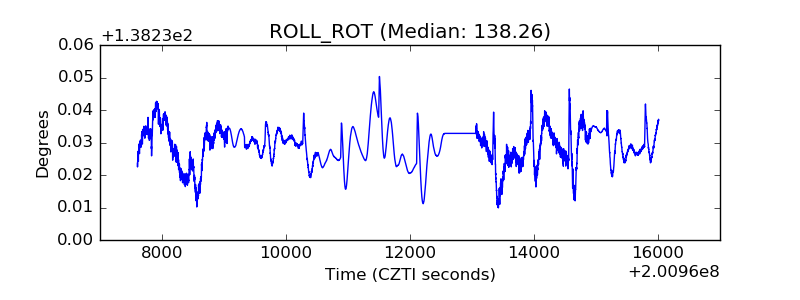 |
| _Roll_DEC | 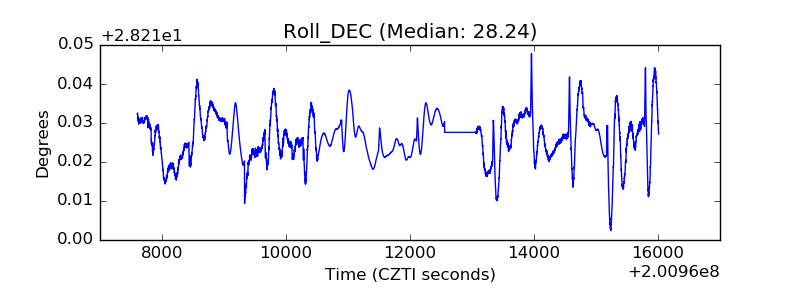 |
| _Roll_RA | 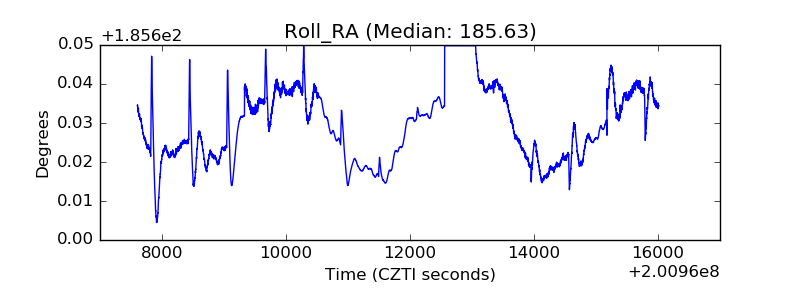 |
| Veto Counter | 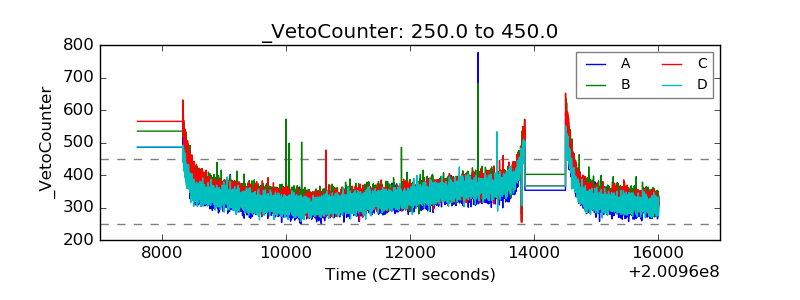 |