| Param | Original file | Final file |
|---|---|---|
| Filename | modeM0/AS1G05_210T01_9000000454_03405cztM0_level2.evt | modeM0/AS1G05_210T01_9000000454_03405cztM0_level2_quad_clean.evt |
| Size (bytes) | 596,669,760 | 91,212,480 |
| Size | 569.0 MB | 87.0 MB |
| Events in quadrant A | 3,845,679 | 552,303 |
| Events in quadrant B | 5,362,695 | 547,201 |
| Events in quadrant C | 4,481,638 | 547,345 |
| Events in quadrant D | 3,813,514 | 534,675 |
| Mode M9 | |||
|---|---|---|---|
| Quadrant | BADHDUFLAG | Total packets | Discarded packets |
| A | 0 | 10 | 0 |
| B | 0 | 10 | 0 |
| C | 0 | 10 | 0 |
| D | 0 | 10 | 0 |
| Mode SS | |||
|---|---|---|---|
| Quadrant | BADHDUFLAG | Total packets | Discarded packets |
| A | 0 | 170 | 0 |
| B | 0 | 170 | 0 |
| C | 0 | 170 | 0 |
| D | 0 | 170 | 0 |
| Mode M0 | |||
|---|---|---|---|
| Quadrant | BADHDUFLAG | Total packets | Discarded packets |
| A | 0 | 17462 | 3 |
| B | 0 | 21542 | 2 |
| C | 0 | 19199 | 2 |
| D | 0 | 17688 | 2 |
| Quadrant | Total seconds | Saturated seconds | Saturation percentage |
|---|---|---|---|
| A | 8363 | 182 | 2.176253% |
| B | 8363 | 258 | 3.085017% |
| C | 8363 | 252 | 3.013273% |
| D | 8363 | 66 | 0.789190% |
Noise dominated data is calculated using 1-second bins in cleaned event files. If a bin has >2000 counts, and if more than 50% of those come from <1% of pixels, then it is considered to be noise-dominated and hence unusable.
| Quadrant | # 1 sec bins | Bins with >0 counts | Bins with >2000 counts | High rate bins dominated by noise | Noise dominated (total time) | Noise dominated (detector-on time) | Marked lightcurve |
|---|---|---|---|---|---|---|---|
| A | 9238 | 8367 | 7 | 7 | 0.08% | 0.08% |  |
| B | 9238 | 8367 | 5 | 5 | 0.05% | 0.06% |  |
| C | 9238 | 8367 | 103 | 103 | 1.11% | 1.23% | 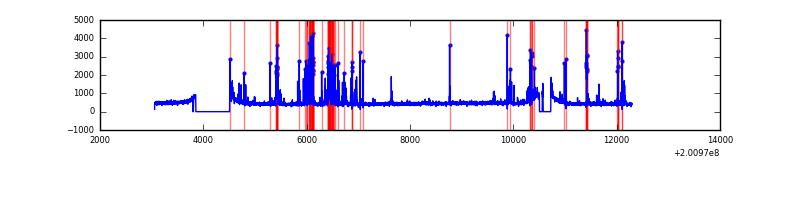 |
| D | 9238 | 8367 | 10 | 10 | 0.11% | 0.12% |  |
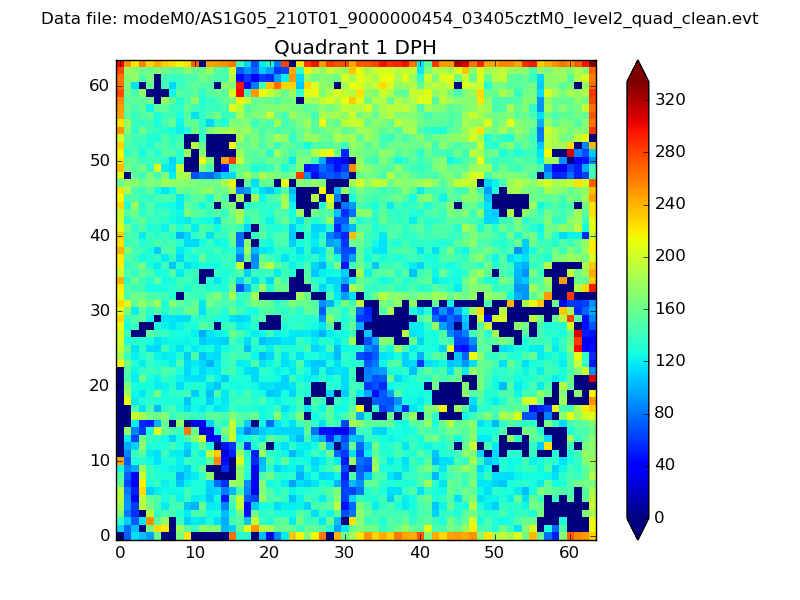
Top three noisy pixels from each quadrant. If the there are fewer than three noisy pixels in the level2.evt file, extra rows are filled as -1
| Pixel properties | Quadrant properties | ||||||
|---|---|---|---|---|---|---|---|
| Quadrant | DetID | PixID | Counts | Sigma | Mean | Median | Sigma |
| A | 0 | 118 | 43070 | 208.56 | 983 | 958 | 201.9 |
| A | 0 | 226 | 14401 | 66.58 | 983 | 958 | 201.9 |
| A | 12 | 194 | 10235 | 45.94 | 983 | 958 | 201.9 |
| B | 15 | 204 | 1393650 | 7152.11 | 997 | 970 | 194.7 |
| B | 14 | 167 | 93229 | 473.8 | 997 | 970 | 194.7 |
| B | 12 | 111 | 15136 | 72.75 | 997 | 970 | 194.7 |
| C | 7 | 220 | 389995 | 1737.39 | 955 | 959 | 223.9 |
| C | 1 | 16 | 308853 | 1375.02 | 955 | 959 | 223.9 |
| C | 14 | 67 | 13679 | 56.81 | 955 | 959 | 223.9 |
| D | 2 | 37 | 75912 | 318.03 | 958 | 927 | 235.8 |
| D | 9 | 85 | 37334 | 154.41 | 958 | 927 | 235.8 |
| D | 12 | 246 | 23799 | 97.0 | 958 | 927 | 235.8 |
Histogram calculated using DETX and DETY for each event in the final _common_clean file
| Quadrant A | 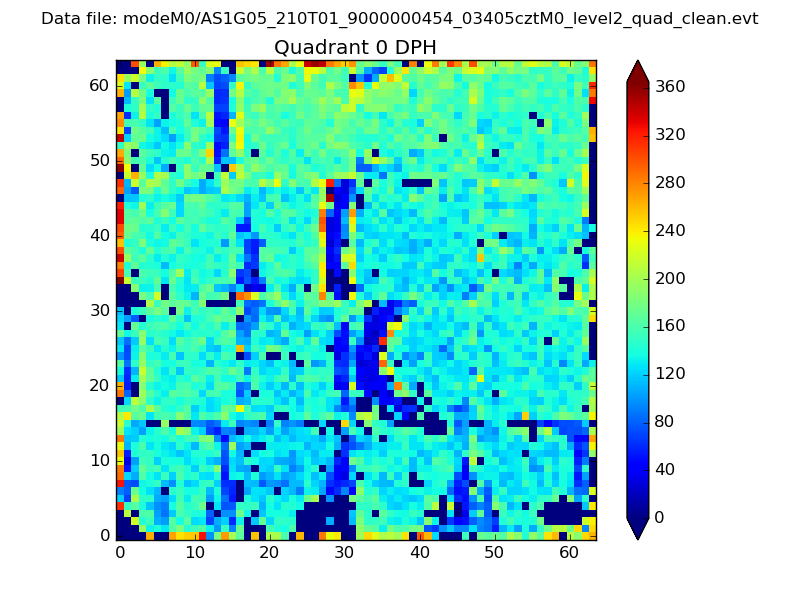 |
 |
Quadrant B |
|---|---|---|---|
| Quadrant D | 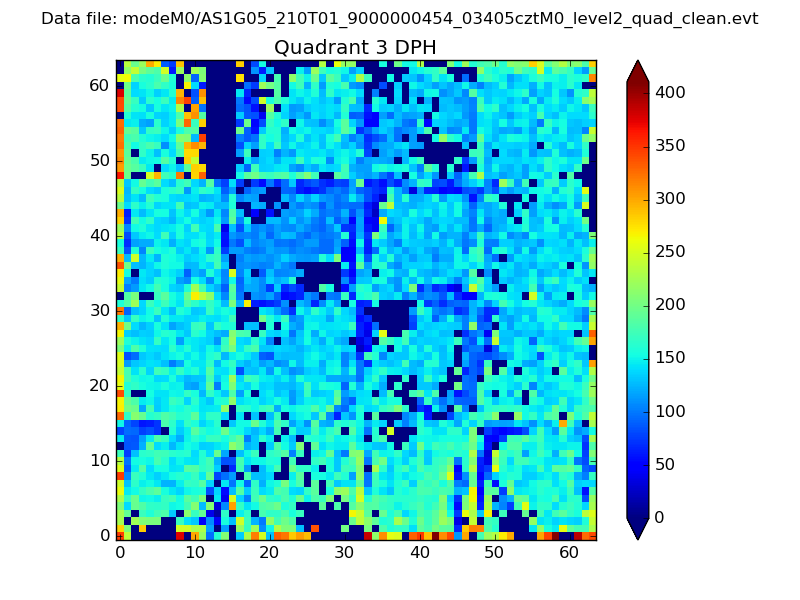 |
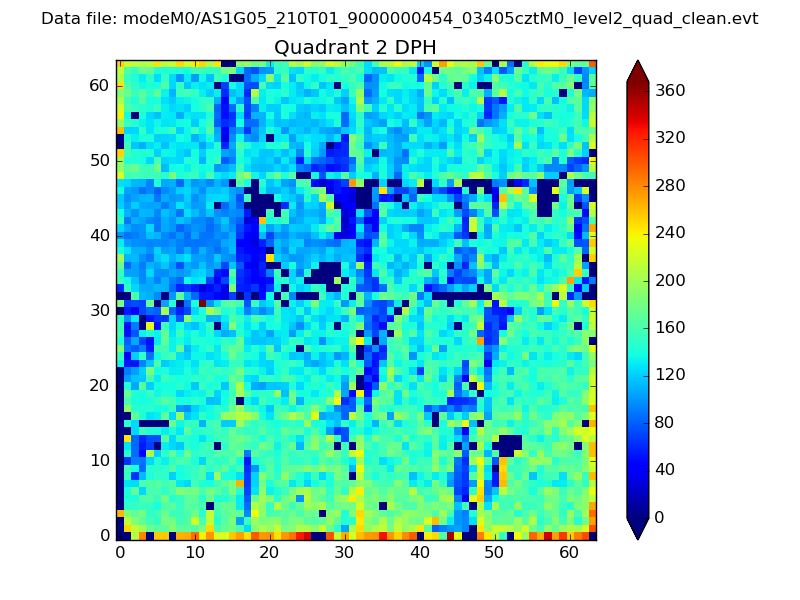 |
Quadrant C |
| Plot type | Count rate plots | Images |
|---|---|---|
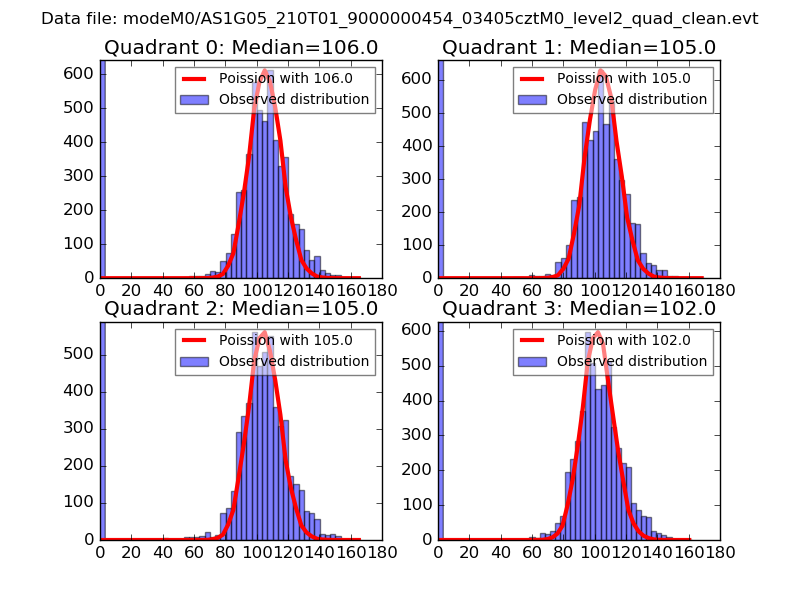
| Comparison with Poisson distribution Blue bars denote a histogram of data divided into 1 sec bins. Red curve is a Poisson curve with rate = median count rate of data. |
 |
 |
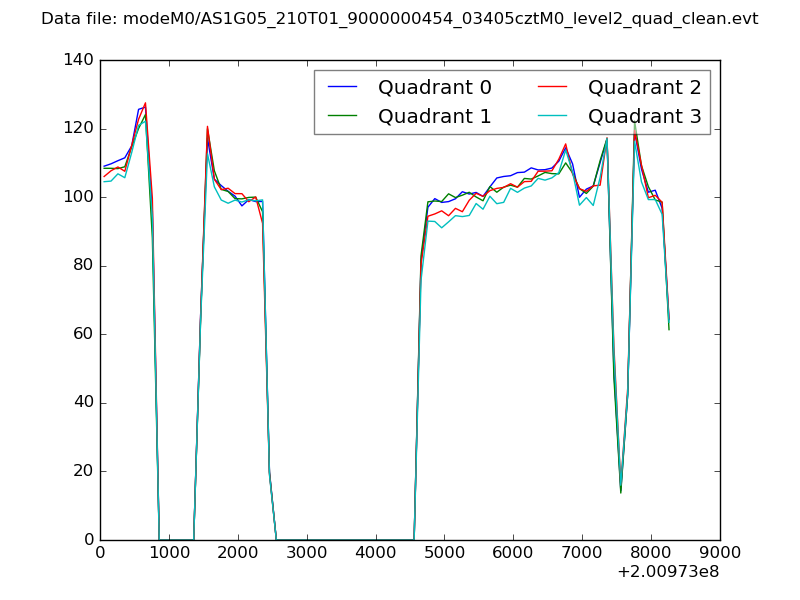
| Quadrant-wise count rates Data is divided into 100 sec bins |
 |
|
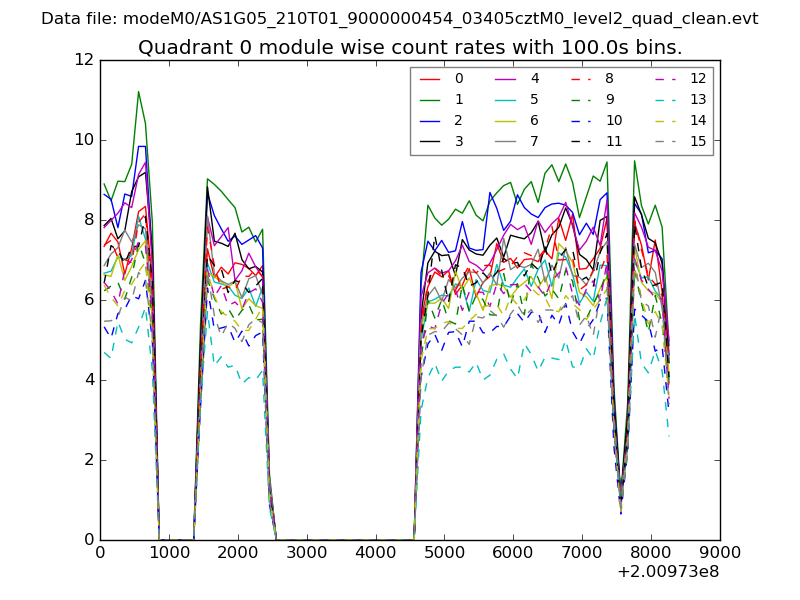
| Module-wise count rates for Quadrant A Data is divided into 100 sec bins |
 |
 |
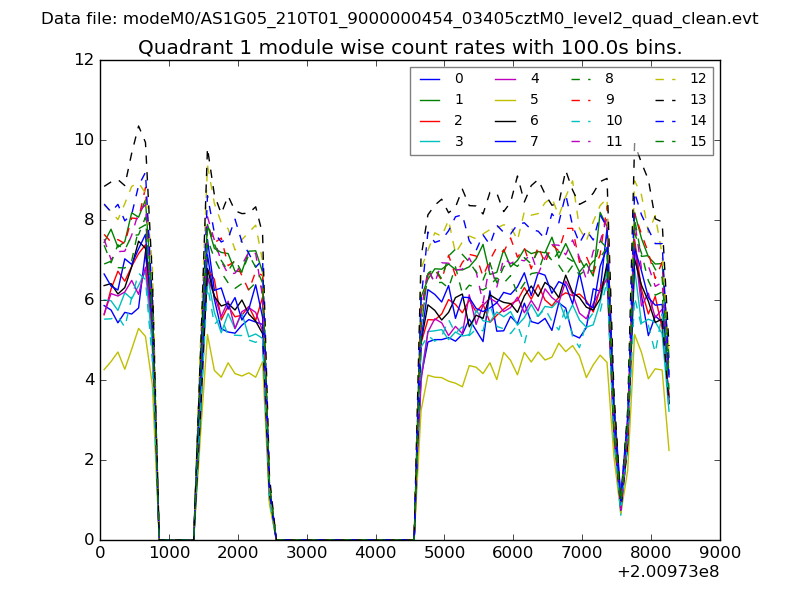
| Module-wise count rates for Quadrant B Data is divided into 100 sec bins |
 |
 |
| Module-wise count rates for Quadrant C Data is divided into 100 sec bins |
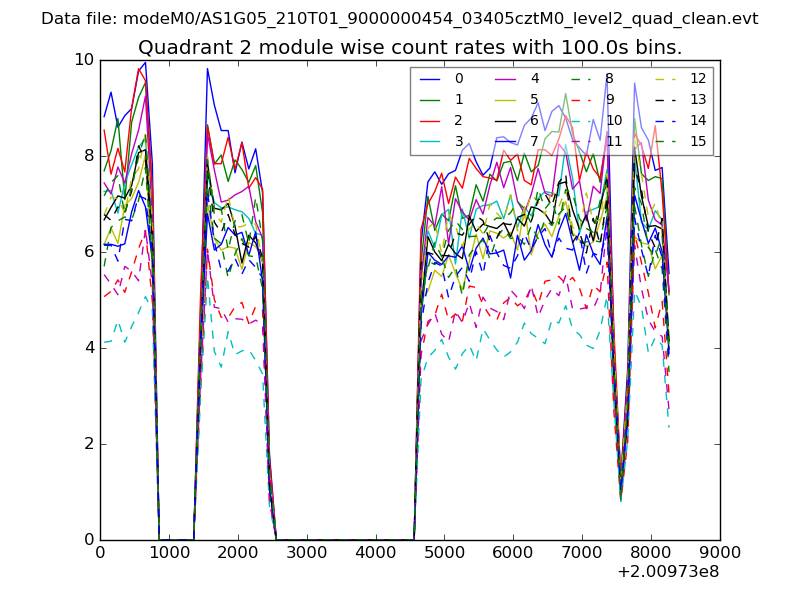 |
 |
| Module-wise count rates for Quadrant D Data is divided into 100 sec bins |
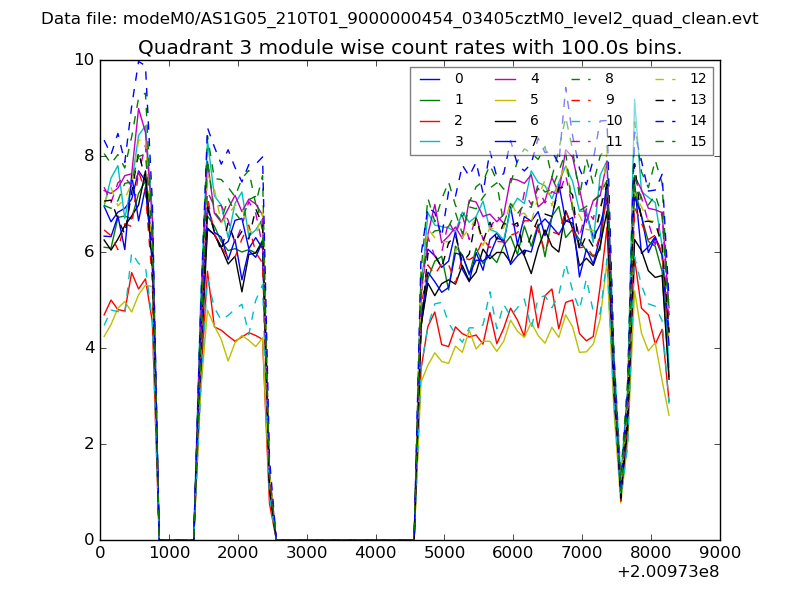 |
 |
| Parameter | Plot |
|---|---|
| CZT HV Monitor | 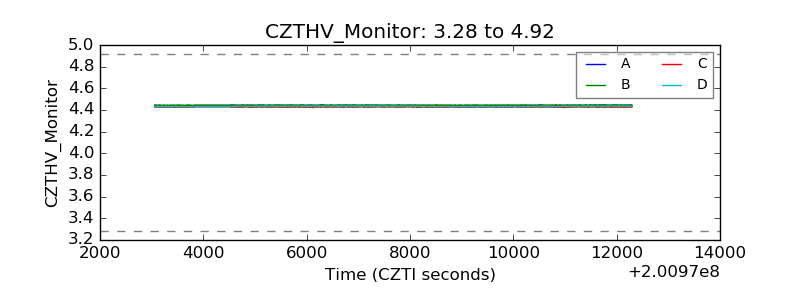 |
| D_VDD | 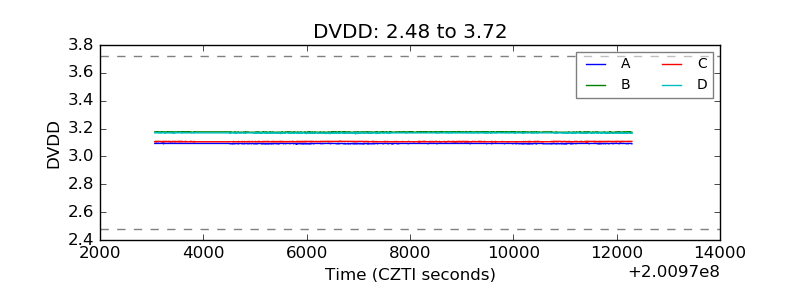 |
| Temperature 1 | 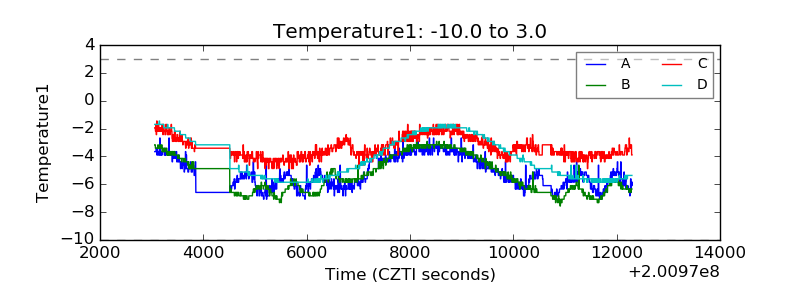 |
| Veto HV Monitor | 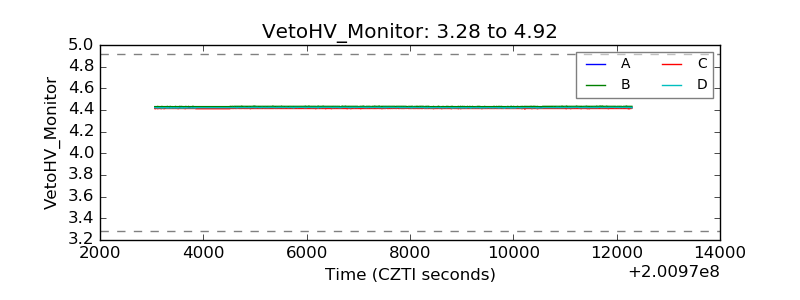 |
| Veto LLD | 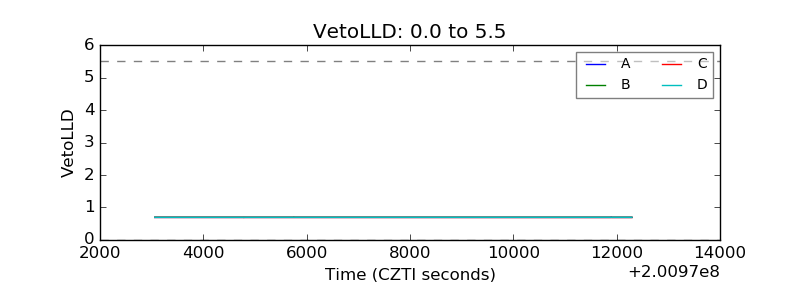 |
| Alpha Counter | 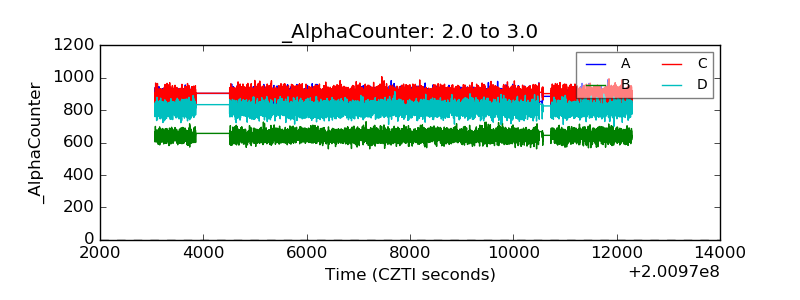 |
| _CPM_Rate | 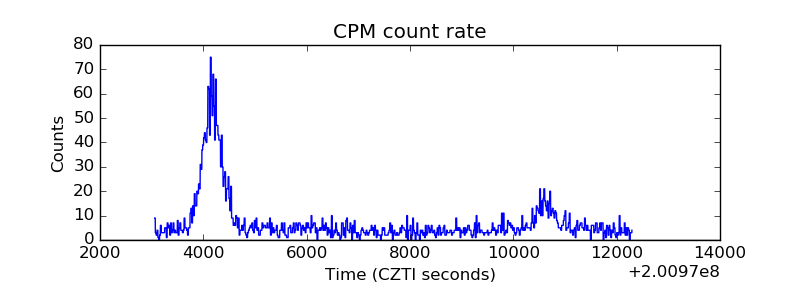 |
| CZT Counter | 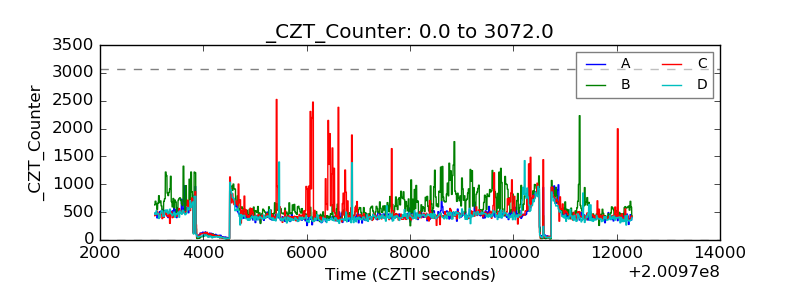 |
| +2.5 Volts monitor |  |
| +5 Volts monitor |  |
| _ROLL_ROT | 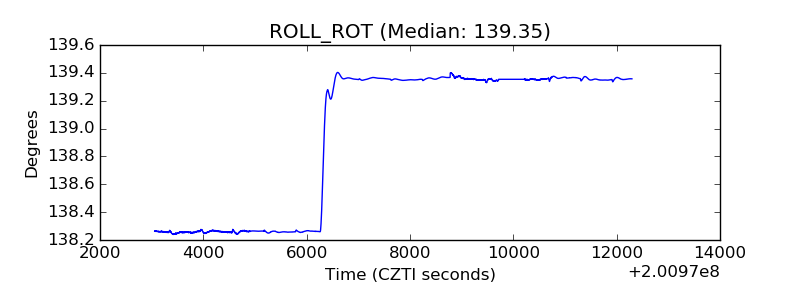 |
| _Roll_DEC | 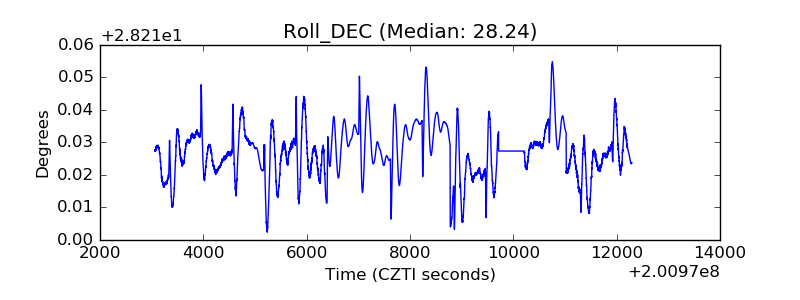 |
| _Roll_RA | 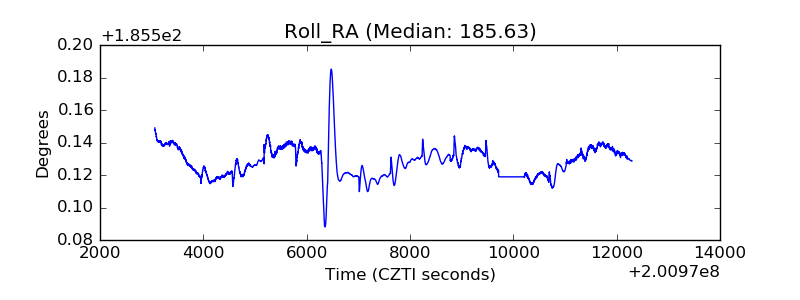 |
| Veto Counter | 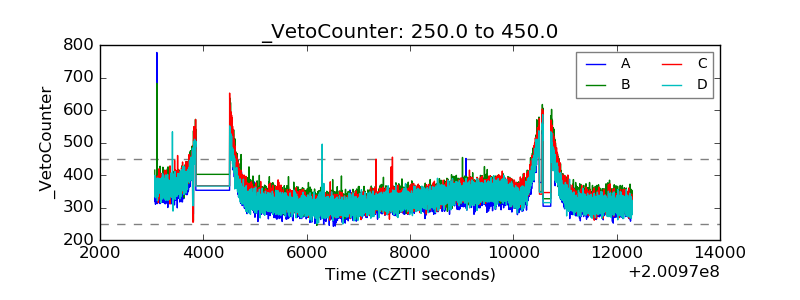 |