| Param | Original file | Final file |
|---|---|---|
| Filename | modeM0/AS1G05_210T01_9000000454_03406cztM0_level2.evt | modeM0/AS1G05_210T01_9000000454_03406cztM0_level2_quad_clean.evt |
| Size (bytes) | 579,418,560 | 80,648,640 |
| Size | 552.6 MB | 76.9 MB |
| Events in quadrant A | 3,841,520 | 473,785 |
| Events in quadrant B | 4,867,843 | 474,112 |
| Events in quadrant C | 4,285,546 | 468,534 |
| Events in quadrant D | 4,000,190 | 459,501 |
| Mode M9 | |||
|---|---|---|---|
| Quadrant | BADHDUFLAG | Total packets | Discarded packets |
| A | 0 | 2 | 0 |
| B | 0 | 2 | 0 |
| C | 0 | 2 | 0 |
| D | 0 | 2 | 0 |
| Mode SS | |||
|---|---|---|---|
| Quadrant | BADHDUFLAG | Total packets | Discarded packets |
| A | 0 | 164 | 0 |
| B | 0 | 164 | 0 |
| C | 0 | 164 | 0 |
| D | 0 | 164 | 0 |
| Mode M0 | |||
|---|---|---|---|
| Quadrant | BADHDUFLAG | Total packets | Discarded packets |
| A | 0 | 17307 | 2 |
| B | 0 | 19764 | 1 |
| C | 0 | 18571 | 1 |
| D | 0 | 18022 | 1 |
| Quadrant | Total seconds | Saturated seconds | Saturation percentage |
|---|---|---|---|
| A | 8142 | 307 | 3.770572% |
| B | 8142 | 391 | 4.802260% |
| C | 8142 | 259 | 3.181037% |
| D | 8142 | 134 | 1.645787% |
Noise dominated data is calculated using 1-second bins in cleaned event files. If a bin has >2000 counts, and if more than 50% of those come from <1% of pixels, then it is considered to be noise-dominated and hence unusable.
| Quadrant | # 1 sec bins | Bins with >0 counts | Bins with >2000 counts | High rate bins dominated by noise | Noise dominated (total time) | Noise dominated (detector-on time) | Marked lightcurve |
|---|---|---|---|---|---|---|---|
| A | 8347 | 8144 | 3 | 3 | 0.04% | 0.04% |  |
| B | 8347 | 8144 | 5 | 5 | 0.06% | 0.06% | 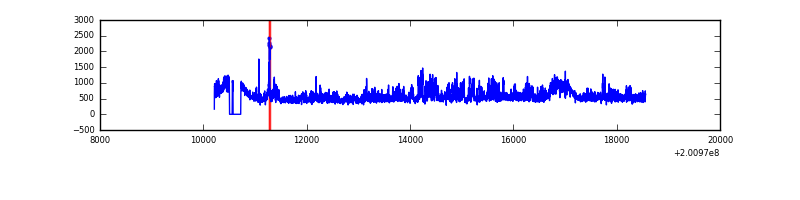 |
| C | 8347 | 8144 | 61 | 61 | 0.73% | 0.75% | 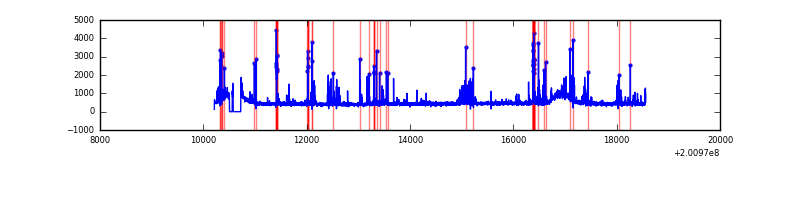 |
| D | 8347 | 8144 | 7 | 7 | 0.08% | 0.09% | 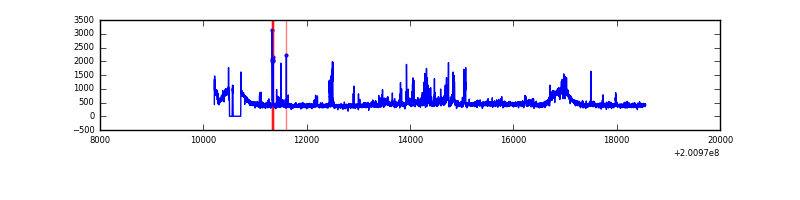 |
Top three noisy pixels from each quadrant. If the there are fewer than three noisy pixels in the level2.evt file, extra rows are filled as -1
| Pixel properties | Quadrant properties | ||||||
|---|---|---|---|---|---|---|---|
| Quadrant | DetID | PixID | Counts | Sigma | Mean | Median | Sigma |
| A | 0 | 118 | 54523 | 262.32 | 976 | 951 | 204.2 |
| A | 0 | 226 | 15474 | 71.11 | 976 | 951 | 204.2 |
| A | 0 | 31 | 14246 | 65.1 | 976 | 951 | 204.2 |
| B | 15 | 204 | 947413 | 4809.44 | 987 | 959 | 196.8 |
| B | 14 | 167 | 84723 | 425.65 | 987 | 959 | 196.8 |
| B | 0 | 229 | 19435 | 93.89 | 987 | 959 | 196.8 |
| C | 7 | 220 | 491662 | 2196.23 | 945 | 949 | 223.4 |
| C | 14 | 223 | 37969 | 165.69 | 945 | 949 | 223.4 |
| C | 8 | 128 | 11253 | 46.12 | 945 | 949 | 223.4 |
| D | 2 | 37 | 280797 | 1208.27 | 943 | 911 | 231.6 |
| D | 7 | 39 | 32465 | 136.22 | 943 | 911 | 231.6 |
| D | 9 | 85 | 28267 | 118.1 | 943 | 911 | 231.6 |
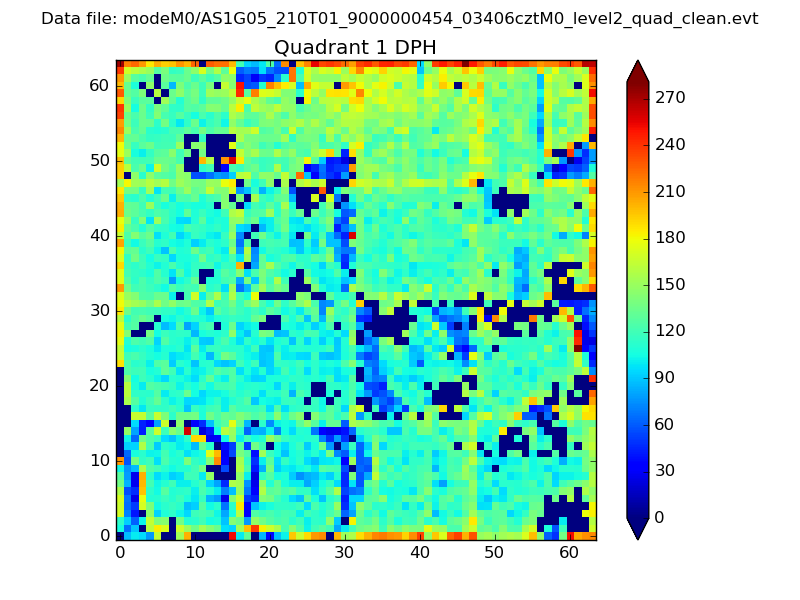
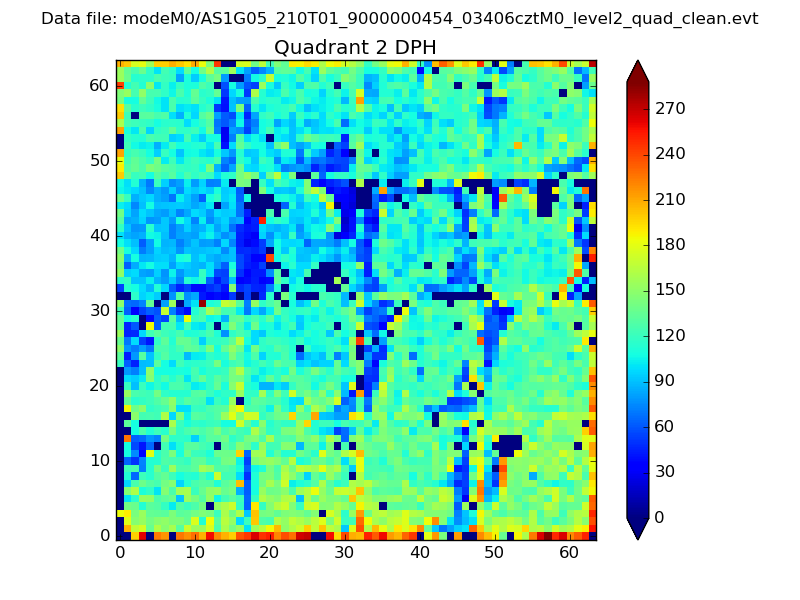
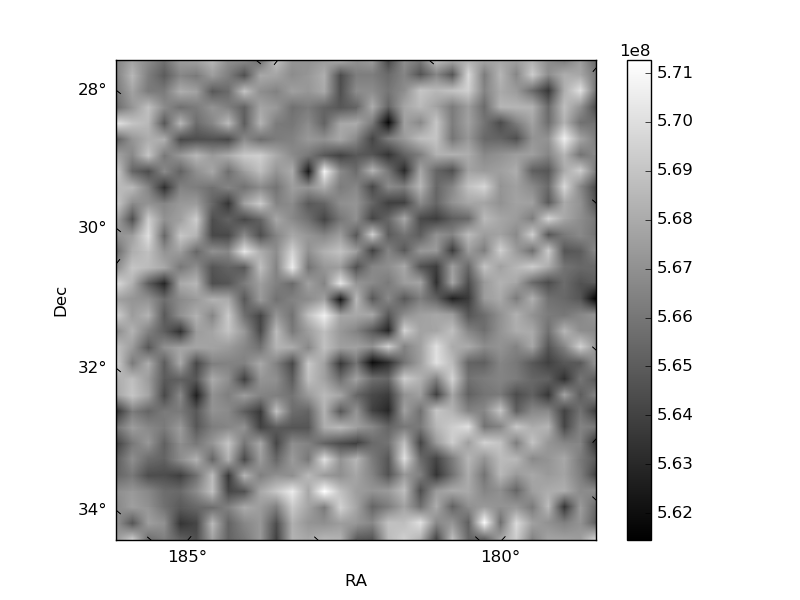
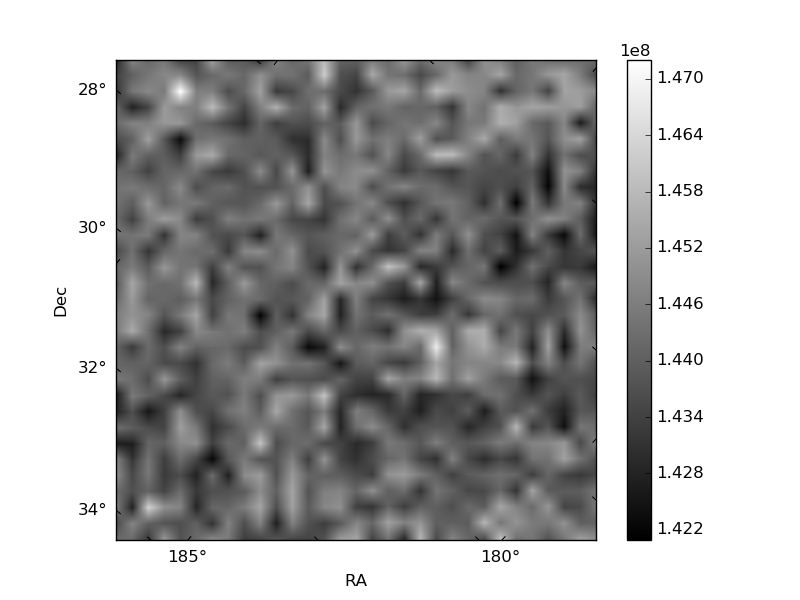
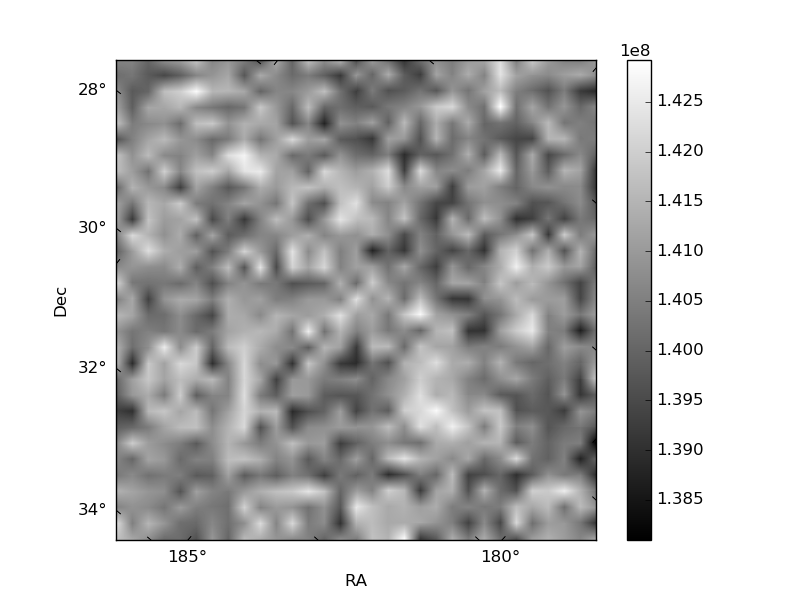
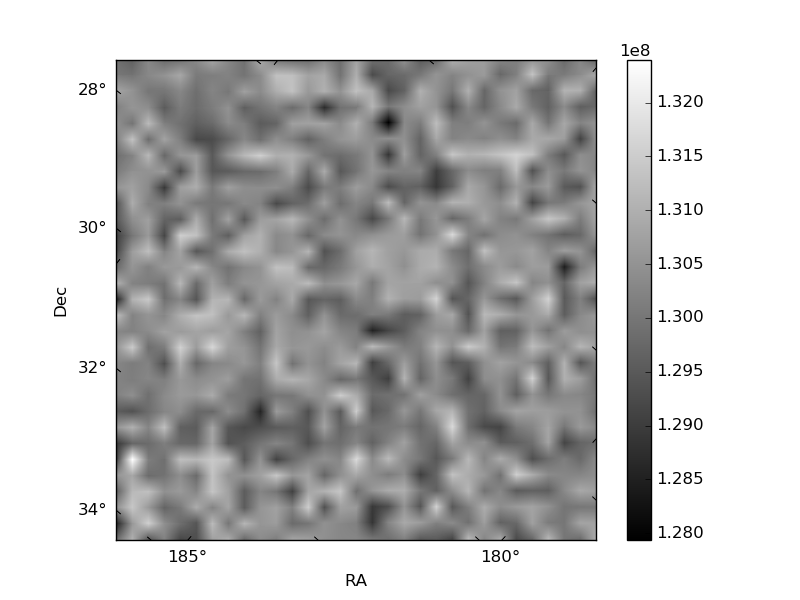
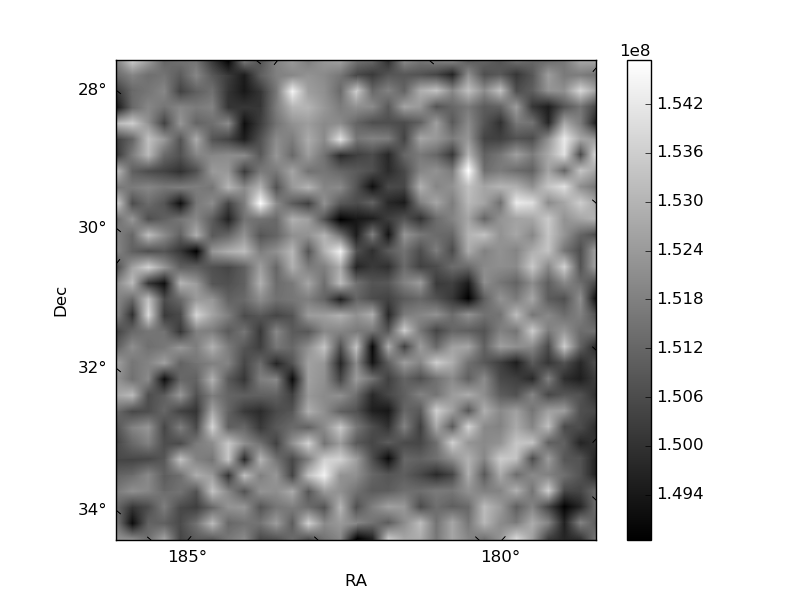
Histogram calculated using DETX and DETY for each event in the final _common_clean file
| Quadrant A | 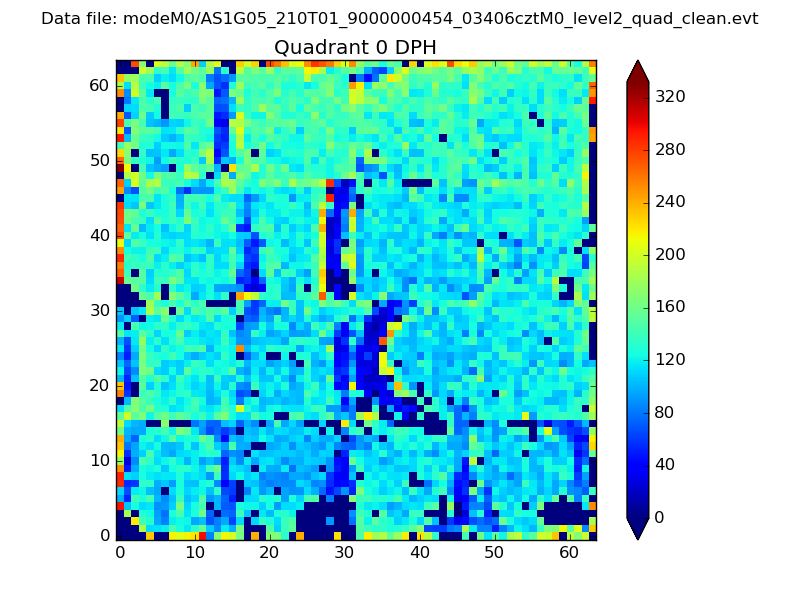 |
 |
Quadrant B |
|---|---|---|---|
| Quadrant D | 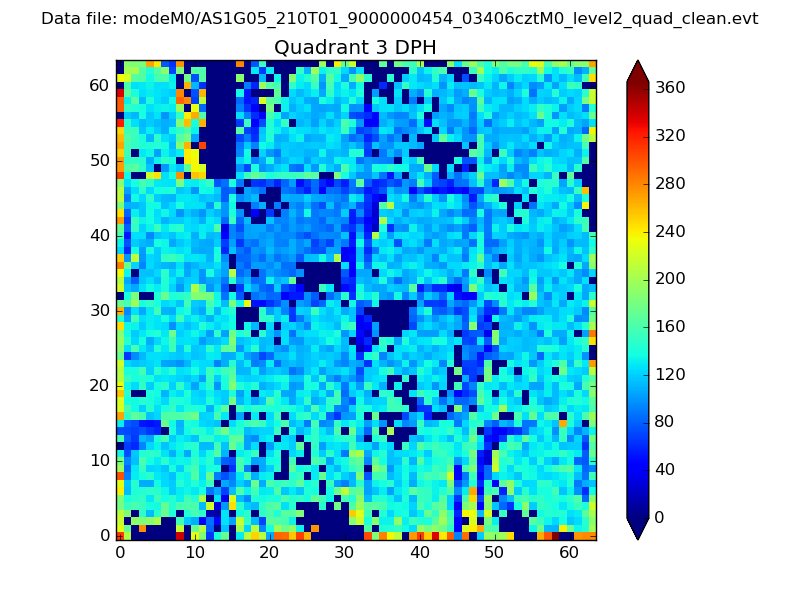 |
 |
Quadrant C |
| Plot type | Count rate plots | Images |
|---|---|---|
| Comparison with Poisson distribution Blue bars denote a histogram of data divided into 1 sec bins. Red curve is a Poisson curve with rate = median count rate of data. |
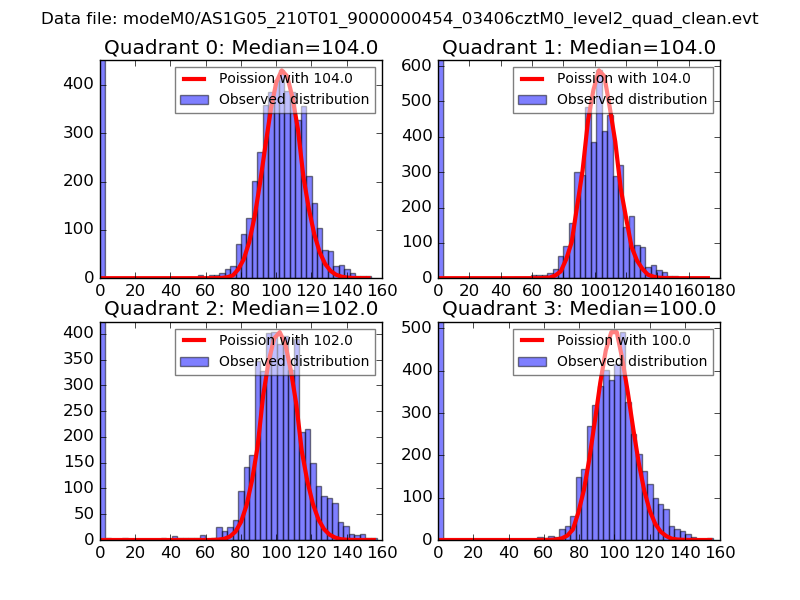 |
 |
| Quadrant-wise count rates Data is divided into 100 sec bins |
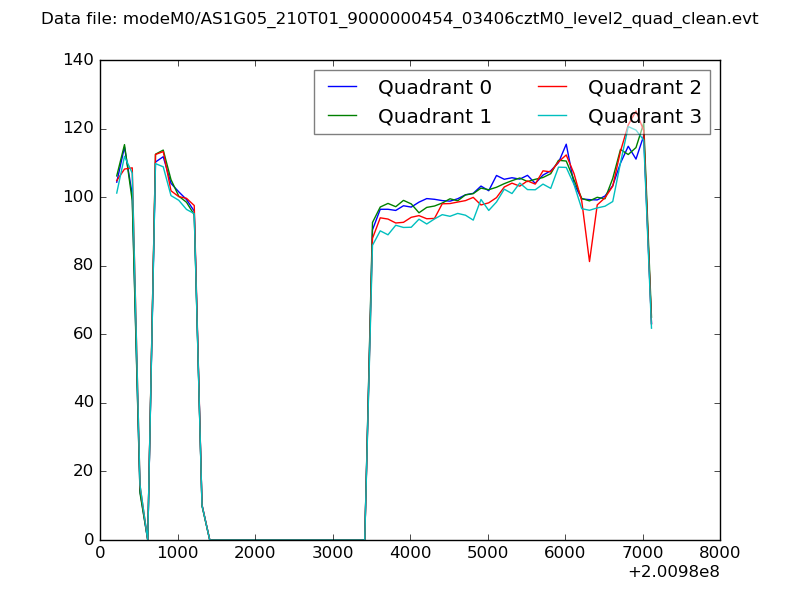 |
|
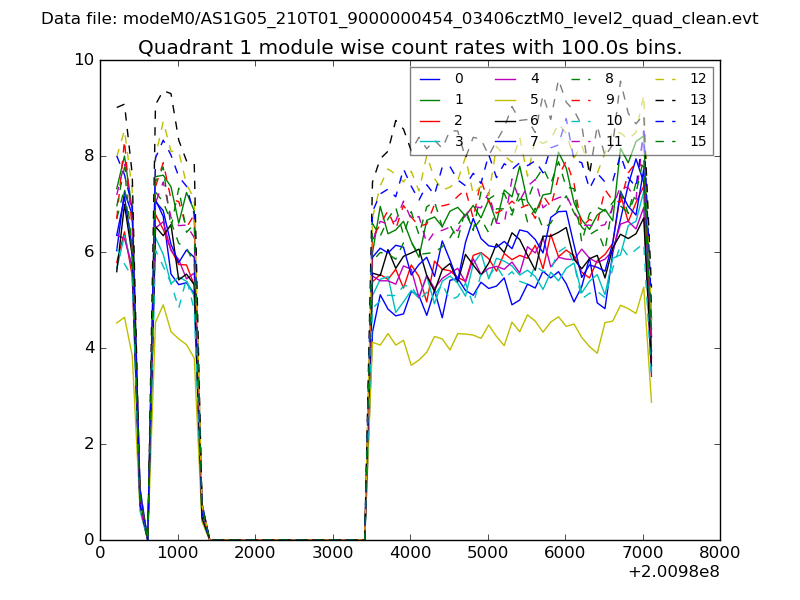
| Module-wise count rates for Quadrant A Data is divided into 100 sec bins |
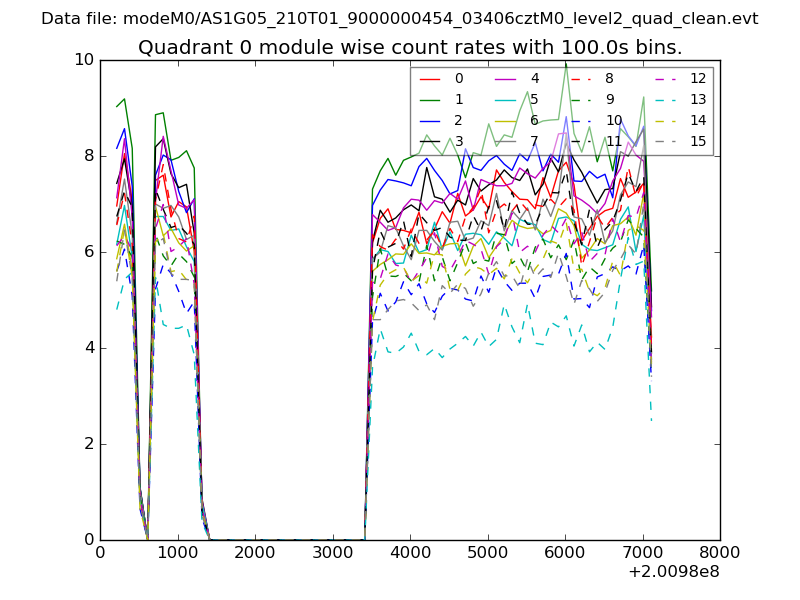 |
 |
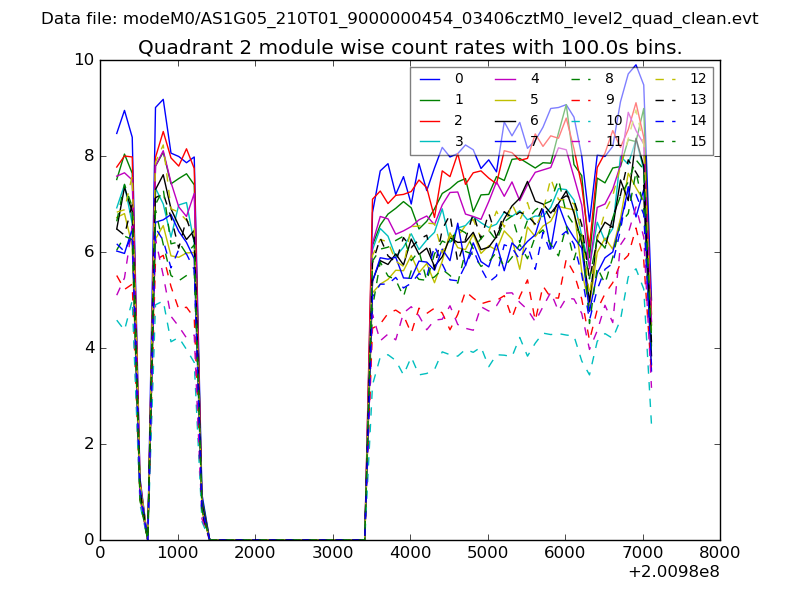
| Module-wise count rates for Quadrant B Data is divided into 100 sec bins |
 |
 |
| Module-wise count rates for Quadrant C Data is divided into 100 sec bins |
 |
 |
| Module-wise count rates for Quadrant D Data is divided into 100 sec bins |
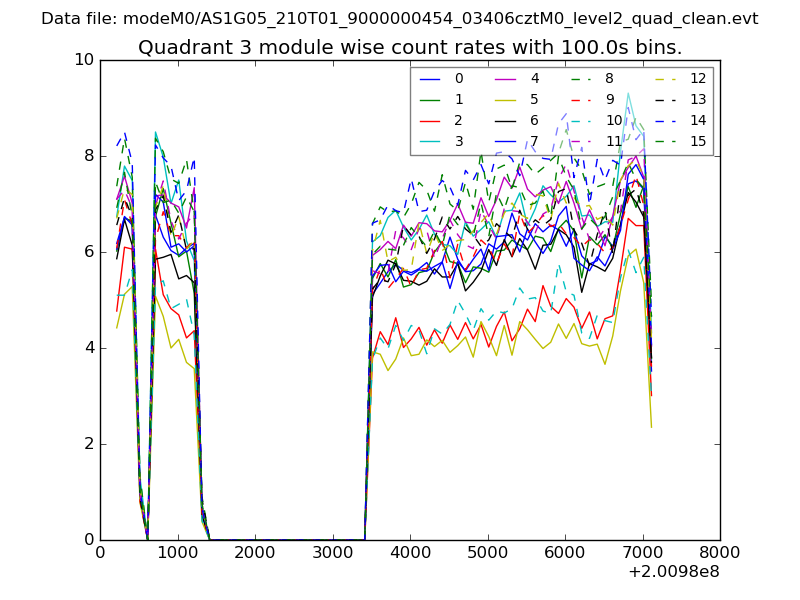 |
 |
| Parameter | Plot |
|---|---|
| CZT HV Monitor | 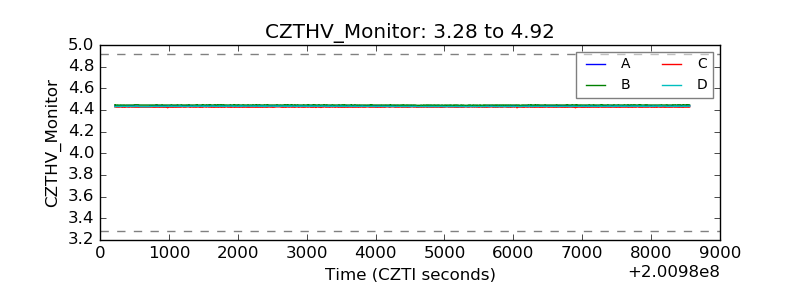 |
| D_VDD | 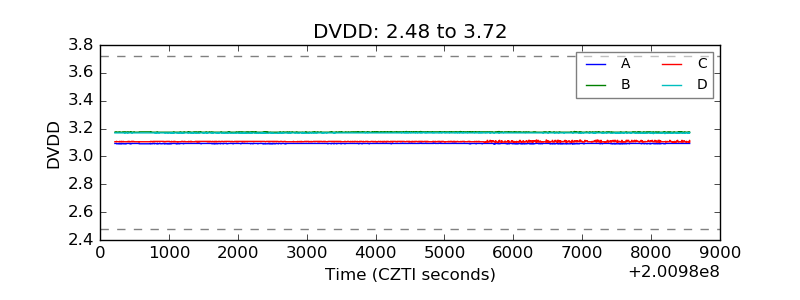 |
| Temperature 1 | 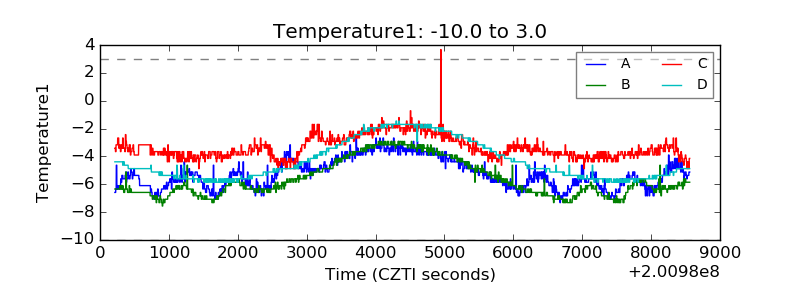 |
| Veto HV Monitor | 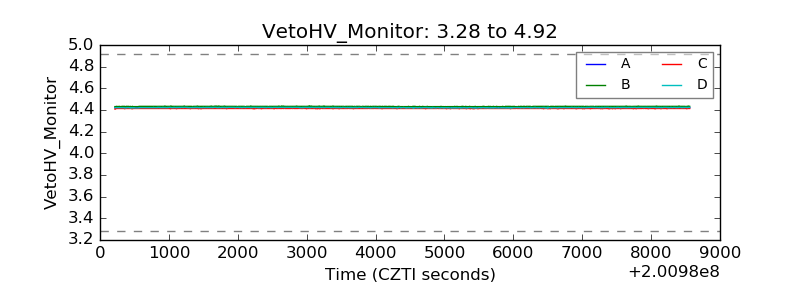 |
| Veto LLD | 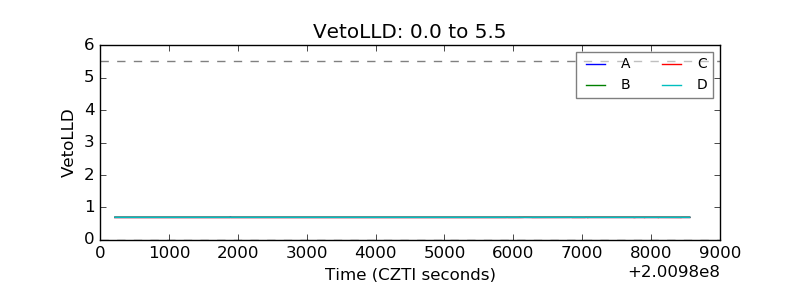 |
| Alpha Counter | 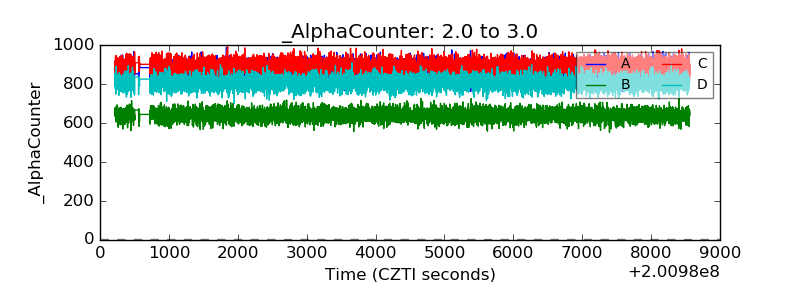 |
| _CPM_Rate | 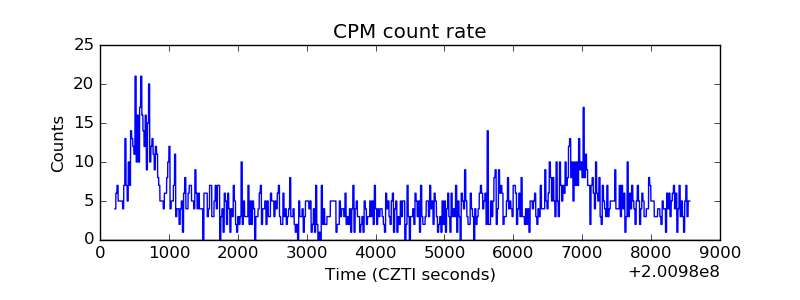 |
| CZT Counter | 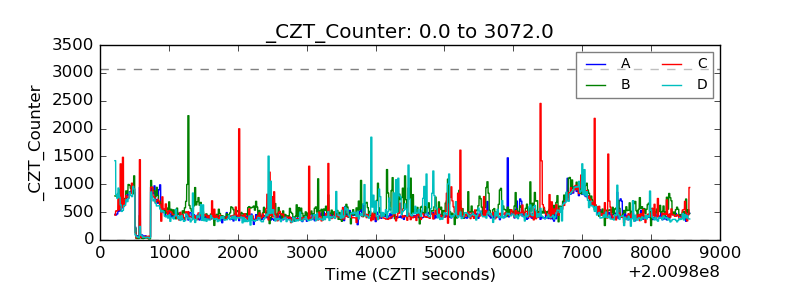 |
| +2.5 Volts monitor |  |
| +5 Volts monitor | 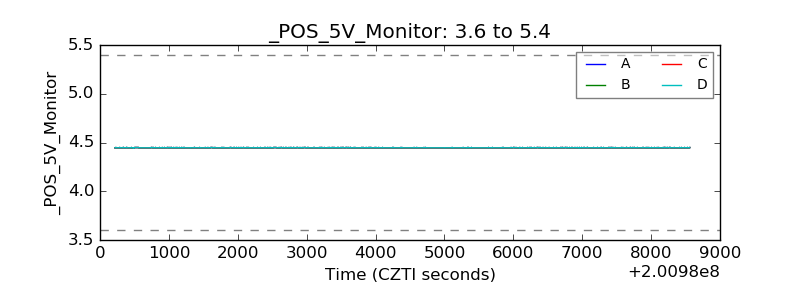 |
| _ROLL_ROT | 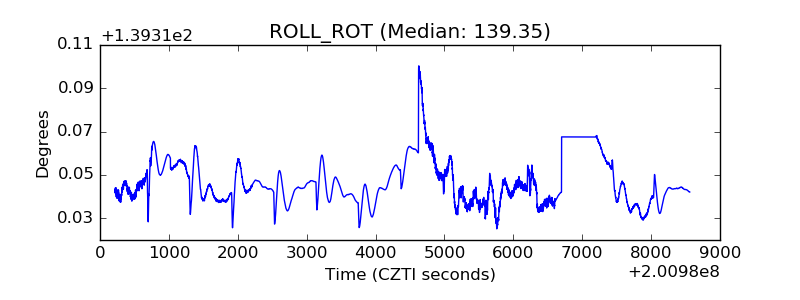 |
| _Roll_DEC | 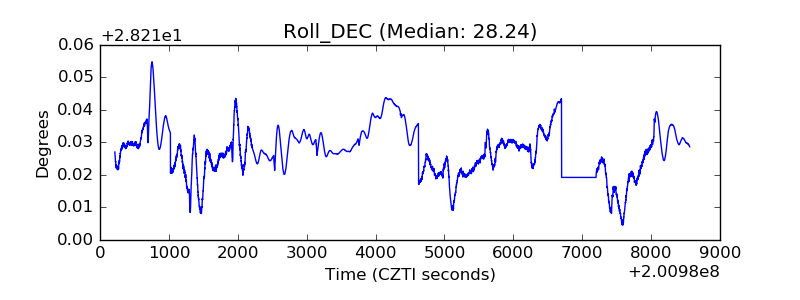 |
| _Roll_RA | 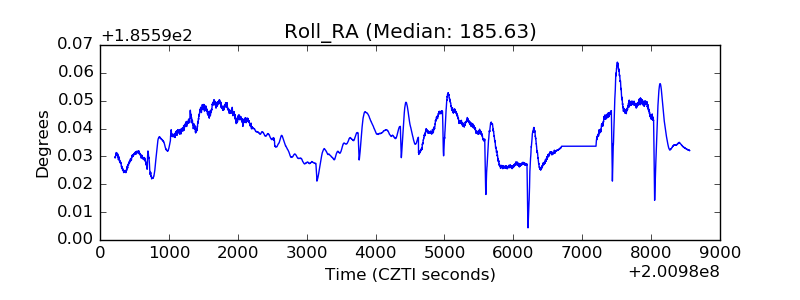 |
| Veto Counter | 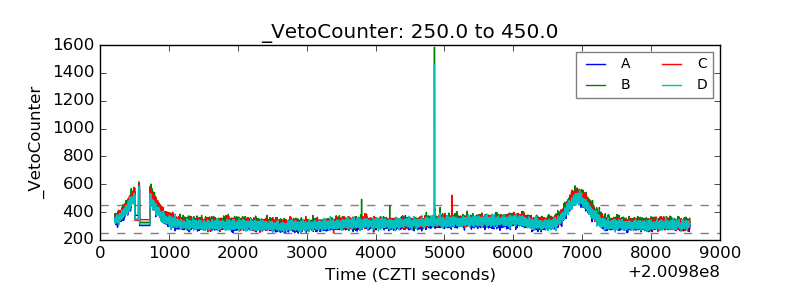 |