| Param | Original file | Final file |
|---|---|---|
| Filename | modeM0/AS1G05_210T01_9000000454_03409cztM0_level2.evt | modeM0/AS1G05_210T01_9000000454_03409cztM0_level2_quad_clean.evt |
| Size (bytes) | 911,226,240 | 142,312,320 |
| Size | 869.0 MB | 135.7 MB |
| Events in quadrant A | 6,581,120 | 846,424 |
| Events in quadrant B | 6,709,106 | 850,407 |
| Events in quadrant C | 6,964,908 | 835,210 |
| Events in quadrant D | 6,398,482 | 817,087 |
| Mode M9 | |||
|---|---|---|---|
| Quadrant | BADHDUFLAG | Total packets | Discarded packets |
| A | 0 | 13 | 0 |
| B | 0 | 13 | 0 |
| C | 0 | 13 | 0 |
| D | 0 | 13 | 0 |
| Mode SS | |||
|---|---|---|---|
| Quadrant | BADHDUFLAG | Total packets | Discarded packets |
| A | 0 | 286 | 0 |
| B | 0 | 286 | 0 |
| C | 0 | 286 | 0 |
| D | 0 | 286 | 0 |
| Mode M0 | |||
|---|---|---|---|
| Quadrant | BADHDUFLAG | Total packets | Discarded packets |
| A | 0 | 29323 | 5 |
| B | 0 | 29039 | 4 |
| C | 0 | 30551 | 4 |
| D | 0 | 29423 | 4 |
| Quadrant | Total seconds | Saturated seconds | Saturation percentage |
|---|---|---|---|
| A | 13911 | 465 | 3.342678% |
| B | 13911 | 450 | 3.234850% |
| C | 13911 | 495 | 3.558335% |
| D | 13911 | 421 | 3.026382% |
Noise dominated data is calculated using 1-second bins in cleaned event files. If a bin has >2000 counts, and if more than 50% of those come from <1% of pixels, then it is considered to be noise-dominated and hence unusable.
| Quadrant | # 1 sec bins | Bins with >0 counts | Bins with >2000 counts | High rate bins dominated by noise | Noise dominated (total time) | Noise dominated (detector-on time) | Marked lightcurve |
|---|---|---|---|---|---|---|---|
| A | 15176 | 13915 | 5 | 5 | 0.03% | 0.04% | 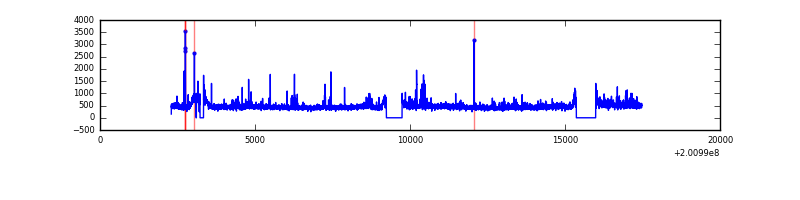 |
| B | 15176 | 13915 | 3 | 3 | 0.02% | 0.02% | 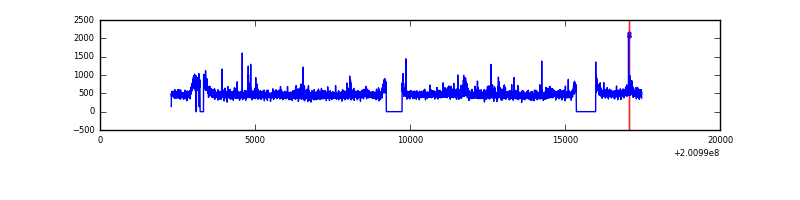 |
| C | 15176 | 13915 | 85 | 85 | 0.56% | 0.61% | 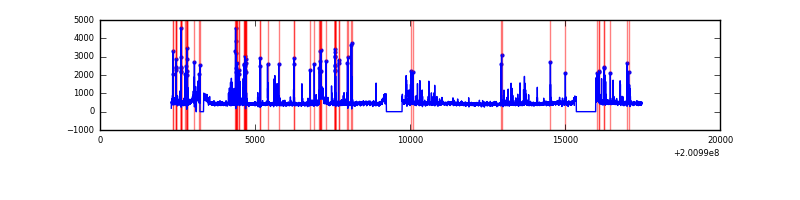 |
| D | 15176 | 13915 | 48 | 48 | 0.32% | 0.34% | 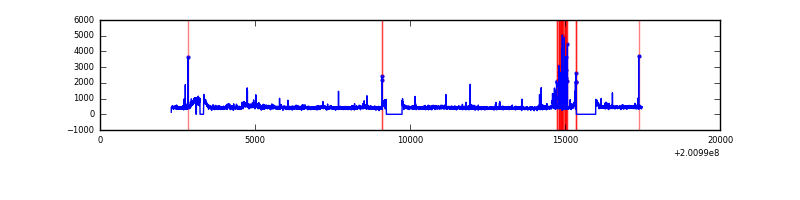 |
Top three noisy pixels from each quadrant. If the there are fewer than three noisy pixels in the level2.evt file, extra rows are filled as -1
| Pixel properties | Quadrant properties | ||||||
|---|---|---|---|---|---|---|---|
| Quadrant | DetID | PixID | Counts | Sigma | Mean | Median | Sigma |
| A | 8 | 15 | 209718 | 627.78 | 1606 | 1566 | 331.6 |
| A | 0 | 118 | 129138 | 384.75 | 1606 | 1566 | 331.6 |
| A | 0 | 226 | 28328 | 80.71 | 1606 | 1566 | 331.6 |
| B | 15 | 204 | 264134 | 818.31 | 1633 | 1587 | 320.8 |
| B | 0 | 229 | 49073 | 148.0 | 1633 | 1587 | 320.8 |
| B | 4 | 200 | 37785 | 112.82 | 1633 | 1587 | 320.8 |
| C | 7 | 220 | 506907 | 1377.24 | 1565 | 1568 | 366.9 |
| C | 14 | 223 | 168870 | 455.96 | 1565 | 1568 | 366.9 |
| C | 1 | 16 | 43514 | 114.32 | 1565 | 1568 | 366.9 |
| D | 2 | 37 | 155342 | 404.6 | 1561 | 1511 | 380.2 |
| D | 12 | 79 | 144010 | 374.8 | 1561 | 1511 | 380.2 |
| D | 13 | 239 | 70612 | 181.75 | 1561 | 1511 | 380.2 |
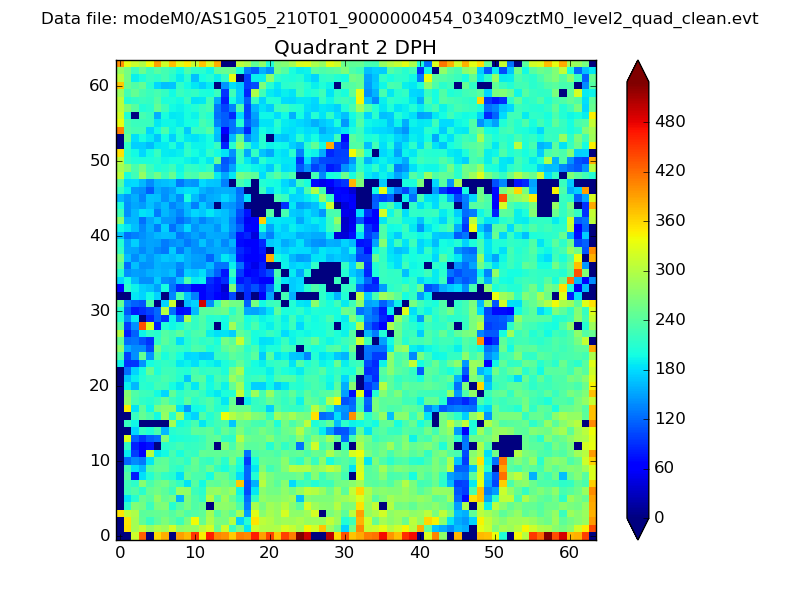
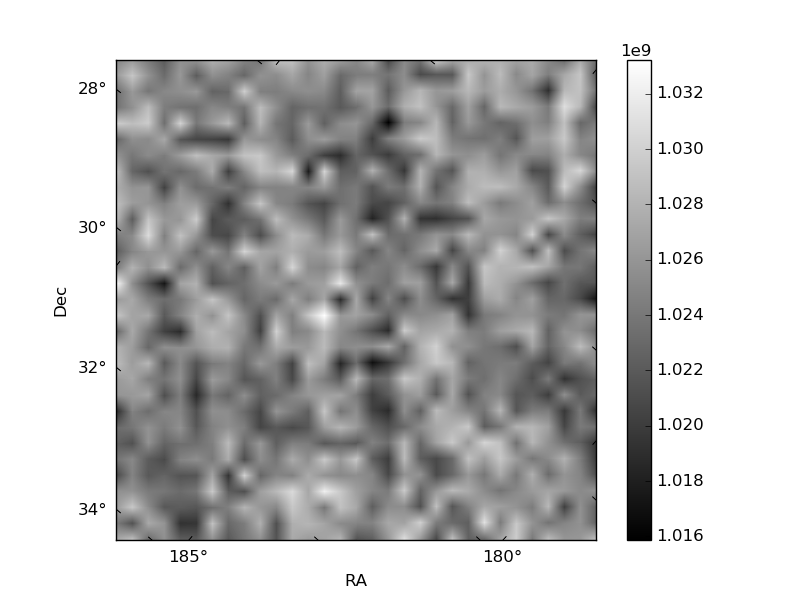
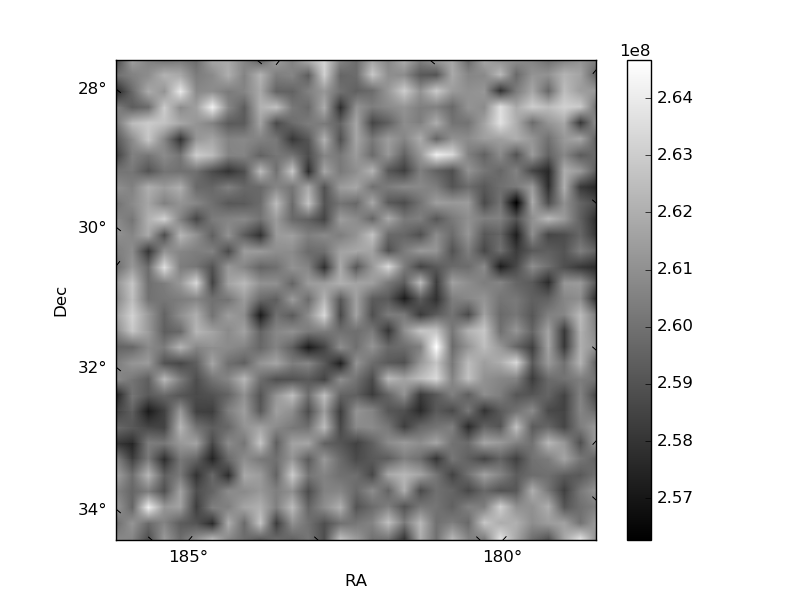
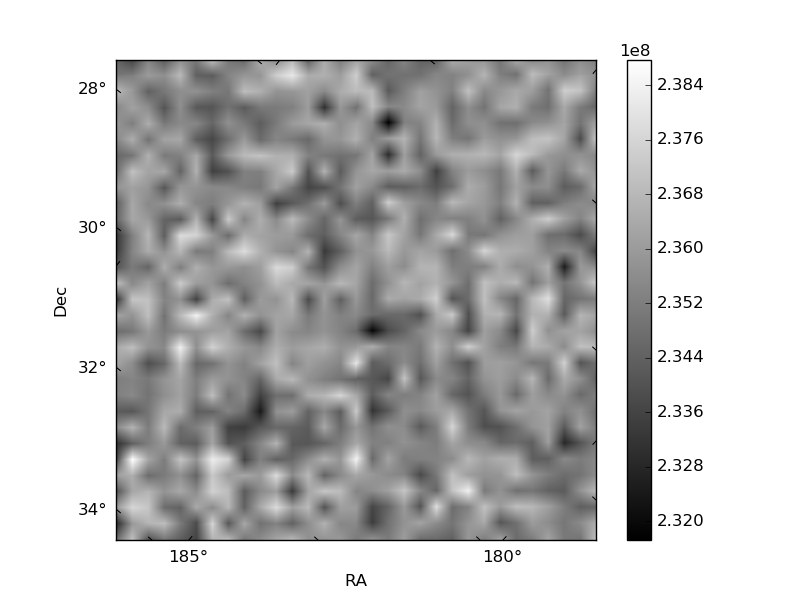
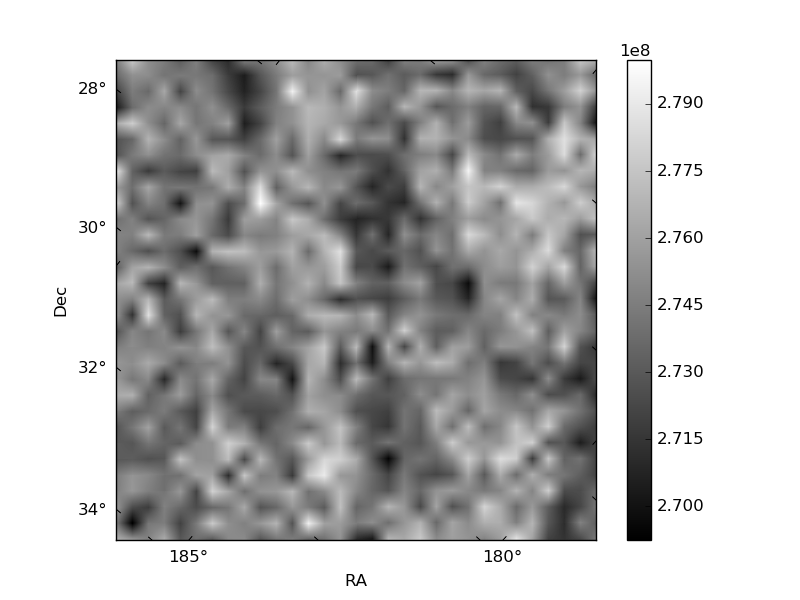
Histogram calculated using DETX and DETY for each event in the final _common_clean file
| Quadrant A | 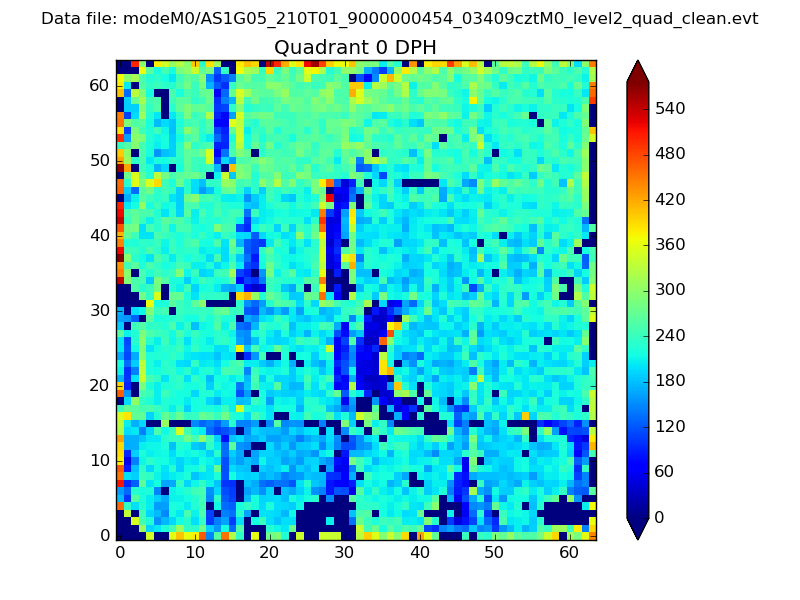 |
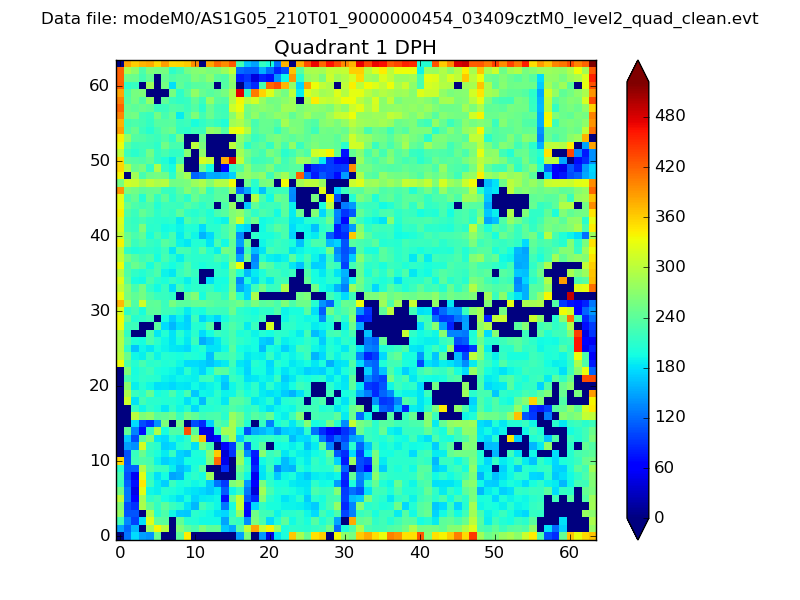 |
Quadrant B |
|---|---|---|---|
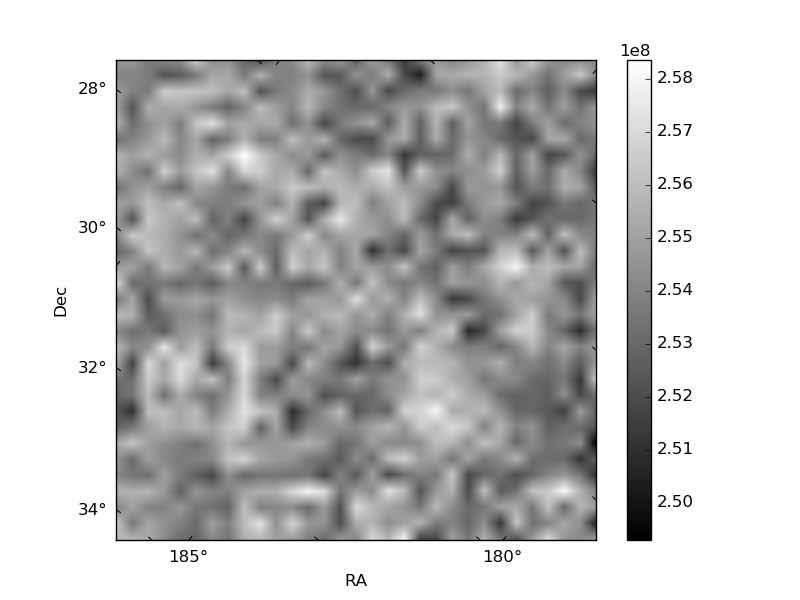
| Quadrant D | 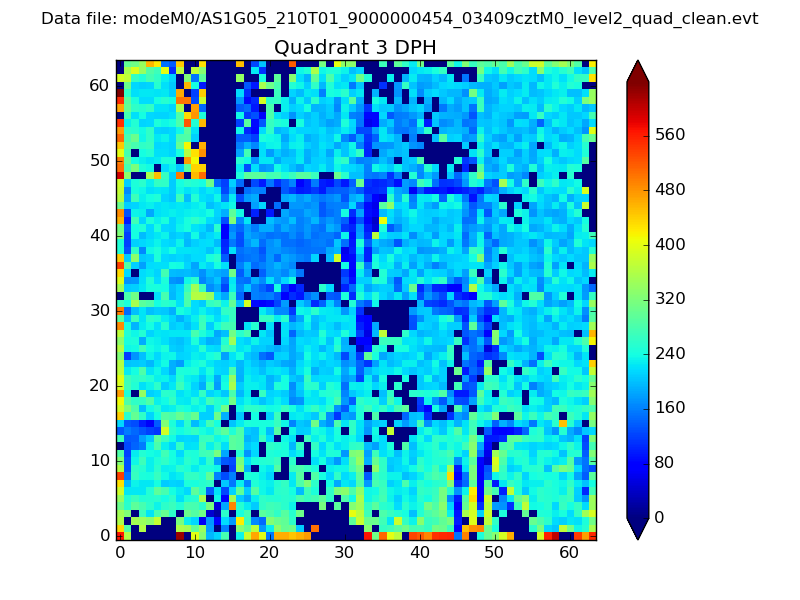 |
 |
Quadrant C |
| Plot type | Count rate plots | Images |
|---|---|---|
| Comparison with Poisson distribution Blue bars denote a histogram of data divided into 1 sec bins. Red curve is a Poisson curve with rate = median count rate of data. |
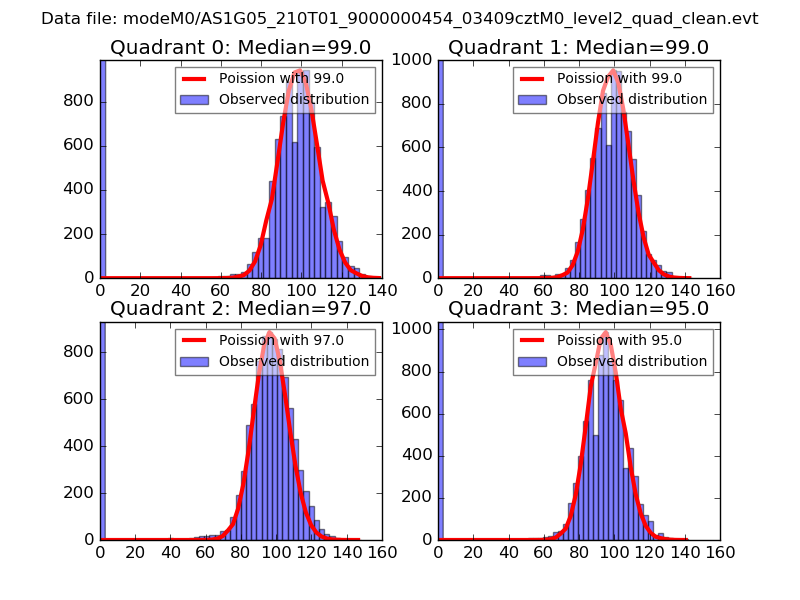 |
 |
| Quadrant-wise count rates Data is divided into 100 sec bins |
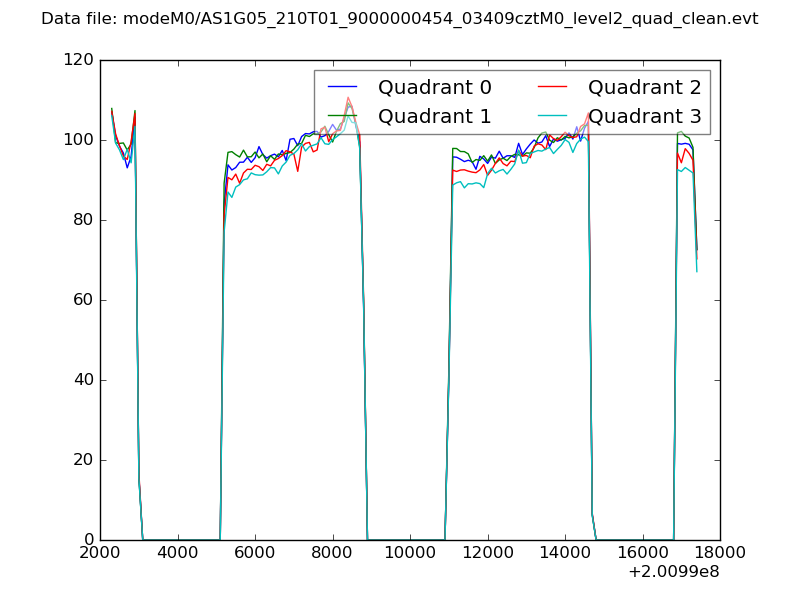 |
|
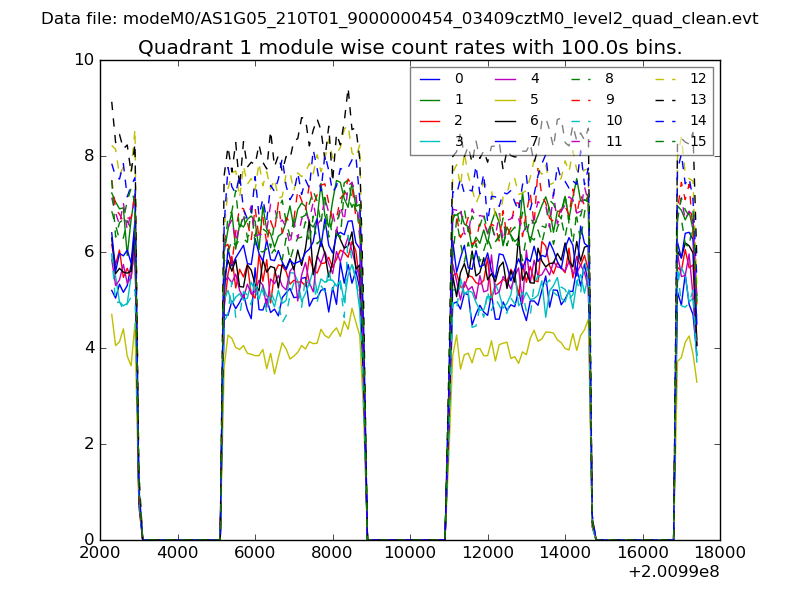
| Module-wise count rates for Quadrant A Data is divided into 100 sec bins |
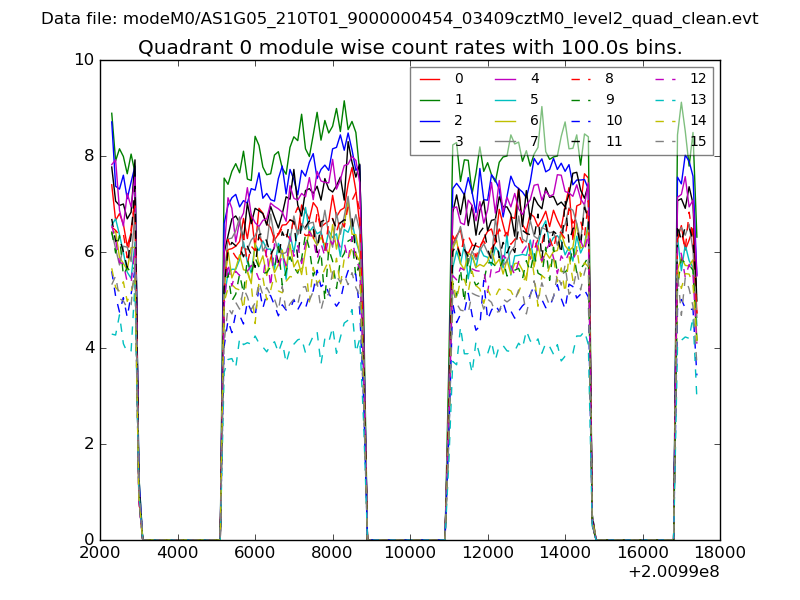 |
 |
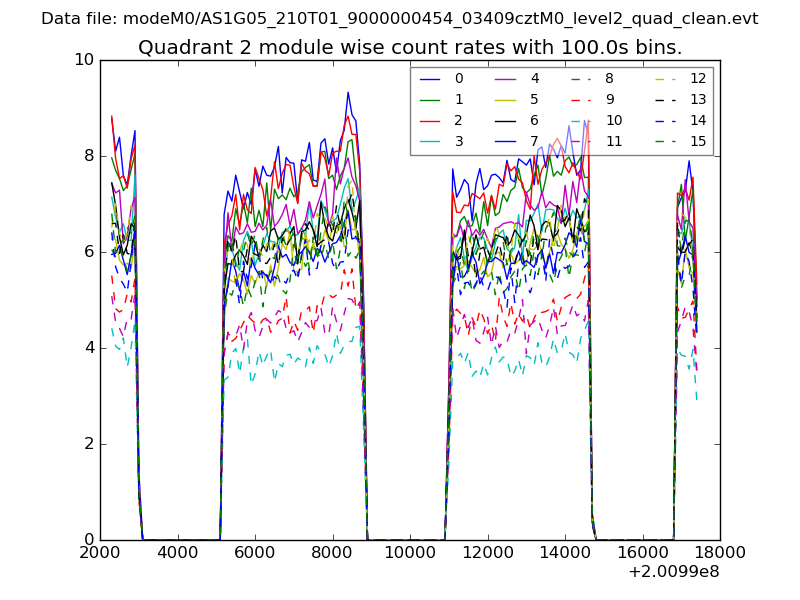
| Module-wise count rates for Quadrant B Data is divided into 100 sec bins |
 |
 |
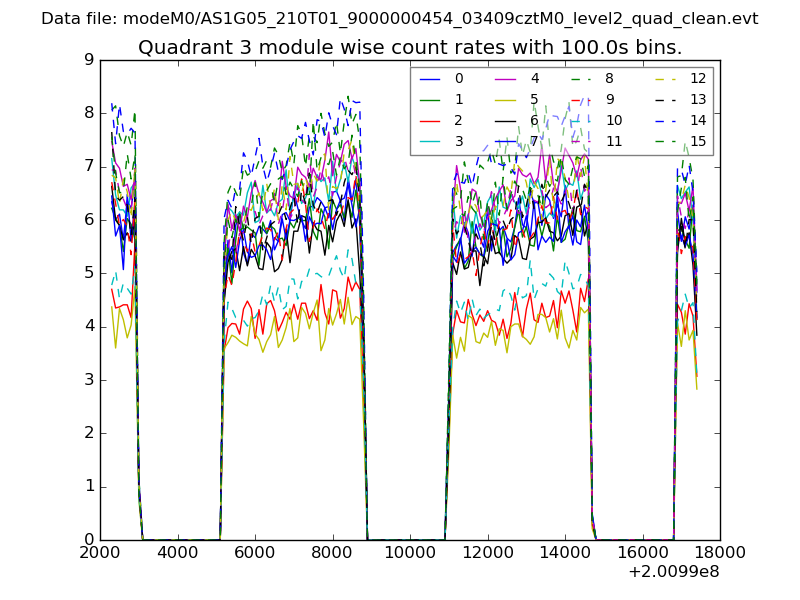
| Module-wise count rates for Quadrant C Data is divided into 100 sec bins |
 |
 |
| Module-wise count rates for Quadrant D Data is divided into 100 sec bins |
 |
 |
| Parameter | Plot |
|---|---|
| CZT HV Monitor | 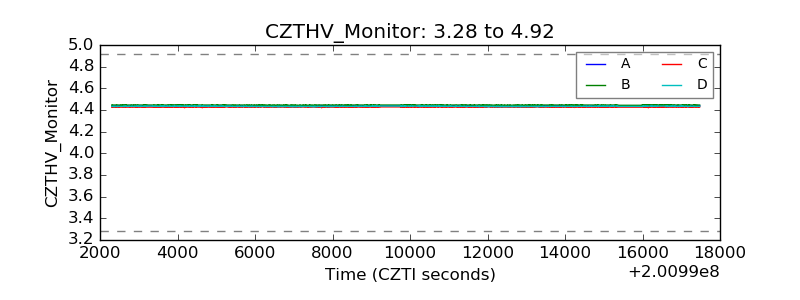 |
| D_VDD |  |
| Temperature 1 | 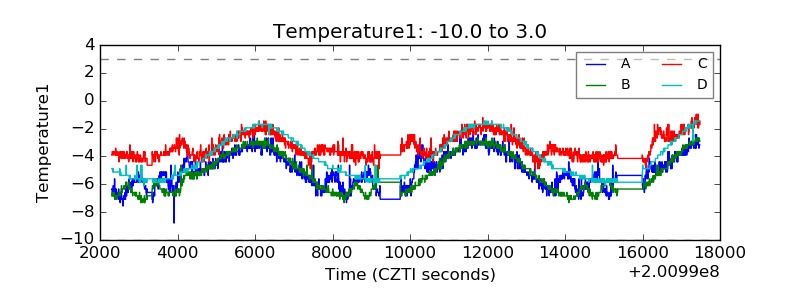 |
| Veto HV Monitor | 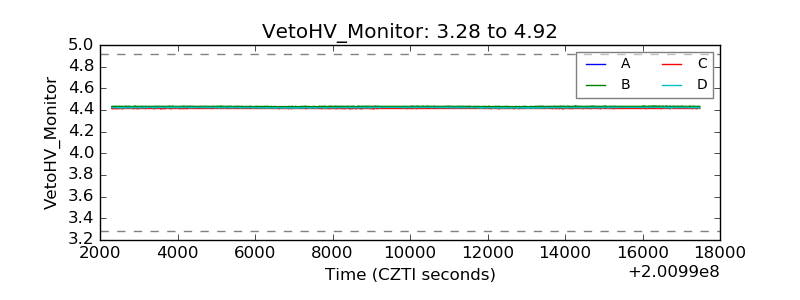 |
| Veto LLD | 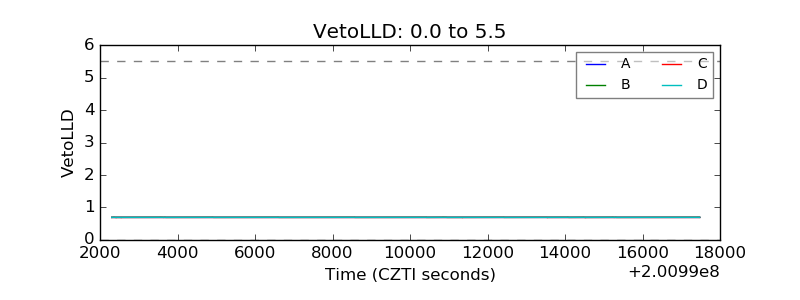 |
| Alpha Counter | 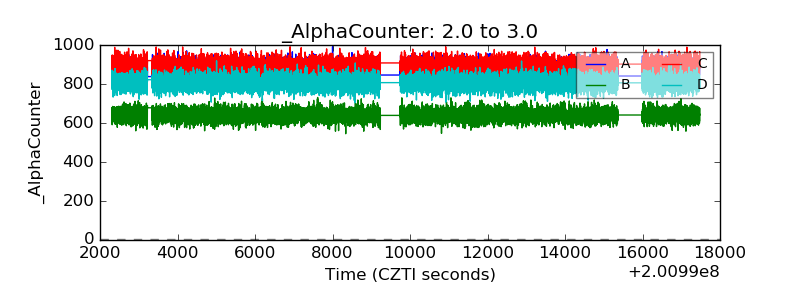 |
| _CPM_Rate | 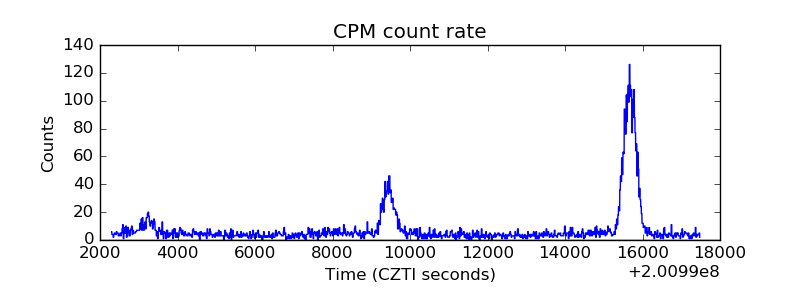 |
| CZT Counter | 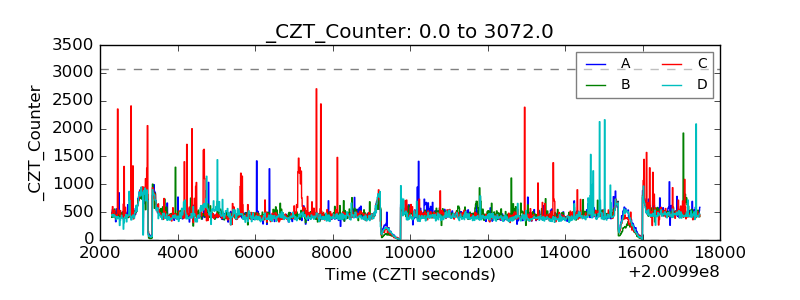 |
| +2.5 Volts monitor |  |
| +5 Volts monitor |  |
| _ROLL_ROT | 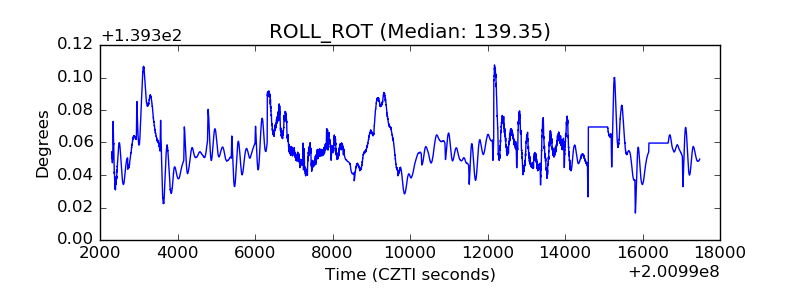 |
| _Roll_DEC | 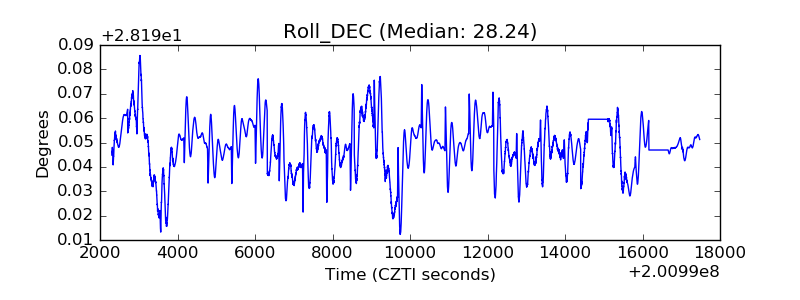 |
| _Roll_RA | 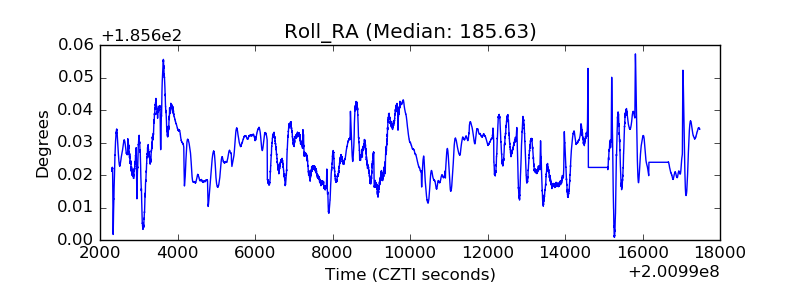 |
| Veto Counter | 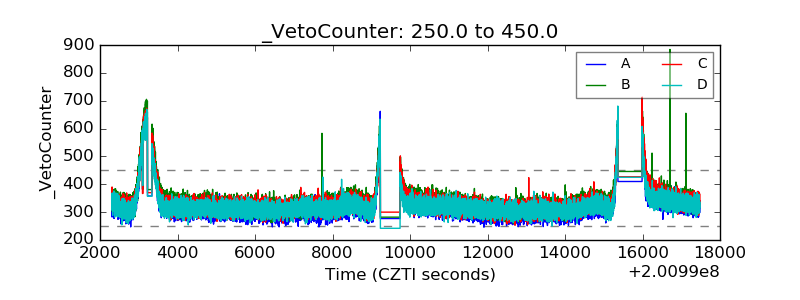 |