| Param | Original file | Final file |
|---|---|---|
| Filename | modeM0/AS1G05_210T01_9000000454_03411cztM0_level2.evt | modeM0/AS1G05_210T01_9000000454_03411cztM0_level2_quad_clean.evt |
| Size (bytes) | 441,423,360 | 82,215,360 |
| Size | 421.0 MB | 78.4 MB |
| Events in quadrant A | 3,202,317 | 513,335 |
| Events in quadrant B | 3,224,152 | 517,718 |
| Events in quadrant C | 3,428,723 | 503,362 |
| Events in quadrant D | 3,062,963 | 493,484 |
| Mode M9 | |||
|---|---|---|---|
| Quadrant | BADHDUFLAG | Total packets | Discarded packets |
| A | 0 | 10 | 0 |
| B | 0 | 10 | 0 |
| C | 0 | 10 | 0 |
| D | 0 | 10 | 0 |
| Mode SS | |||
|---|---|---|---|
| Quadrant | BADHDUFLAG | Total packets | Discarded packets |
| A | 0 | 134 | 0 |
| B | 0 | 134 | 0 |
| C | 0 | 134 | 0 |
| D | 0 | 134 | 0 |
| Mode M0 | |||
|---|---|---|---|
| Quadrant | BADHDUFLAG | Total packets | Discarded packets |
| A | 0 | 14114 | 3 |
| B | 0 | 14018 | 2 |
| C | 0 | 14787 | 2 |
| D | 0 | 13973 | 2 |
| Quadrant | Total seconds | Saturated seconds | Saturation percentage |
|---|---|---|---|
| A | 6624 | 113 | 1.705918% |
| B | 6624 | 87 | 1.313406% |
| C | 6624 | 170 | 2.566425% |
| D | 6625 | 79 | 1.192453% |
Noise dominated data is calculated using 1-second bins in cleaned event files. If a bin has >2000 counts, and if more than 50% of those come from <1% of pixels, then it is considered to be noise-dominated and hence unusable.
| Quadrant | # 1 sec bins | Bins with >0 counts | Bins with >2000 counts | High rate bins dominated by noise | Noise dominated (total time) | Noise dominated (detector-on time) | Marked lightcurve |
|---|---|---|---|---|---|---|---|
| A | 7589 | 6625 | 5 | 5 | 0.07% | 0.08% | 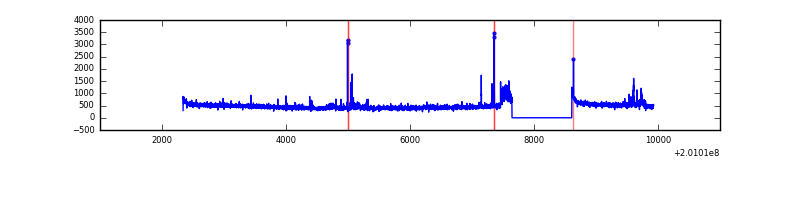 |
| B | 7589 | 6625 | 0 | 0 | 0.00% | 0.00% | 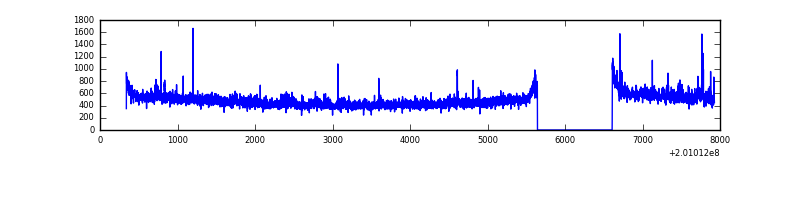 |
| C | 7589 | 6625 | 63 | 63 | 0.83% | 0.95% | 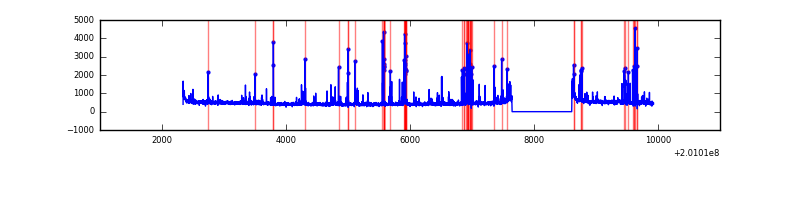 |
| D | 7590 | 6626 | 8 | 8 | 0.11% | 0.12% | 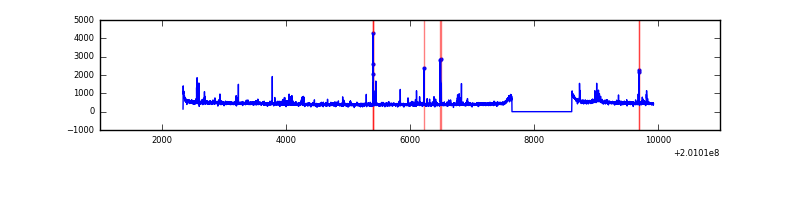 |
Top three noisy pixels from each quadrant. If the there are fewer than three noisy pixels in the level2.evt file, extra rows are filled as -1
| Pixel properties | Quadrant properties | ||||||
|---|---|---|---|---|---|---|---|
| Quadrant | DetID | PixID | Counts | Sigma | Mean | Median | Sigma |
| A | 14 | 249 | 95344 | 594.92 | 777 | 759 | 159.0 |
| A | 8 | 15 | 39960 | 246.57 | 777 | 759 | 159.0 |
| A | 0 | 31 | 34130 | 209.9 | 777 | 759 | 159.0 |
| B | 15 | 204 | 94033 | 608.95 | 784 | 763 | 153.2 |
| B | 14 | 167 | 23528 | 148.63 | 784 | 763 | 153.2 |
| B | 0 | 182 | 22933 | 144.75 | 784 | 763 | 153.2 |
| C | 7 | 220 | 332011 | 1876.28 | 752 | 755 | 176.5 |
| C | 1 | 192 | 108049 | 607.73 | 752 | 755 | 176.5 |
| C | 9 | 54 | 19298 | 105.03 | 752 | 755 | 176.5 |
| D | 9 | 85 | 52584 | 283.01 | 755 | 732 | 183.2 |
| D | 13 | 223 | 34754 | 185.69 | 755 | 732 | 183.2 |
| D | 3 | 247 | 31577 | 168.35 | 755 | 732 | 183.2 |
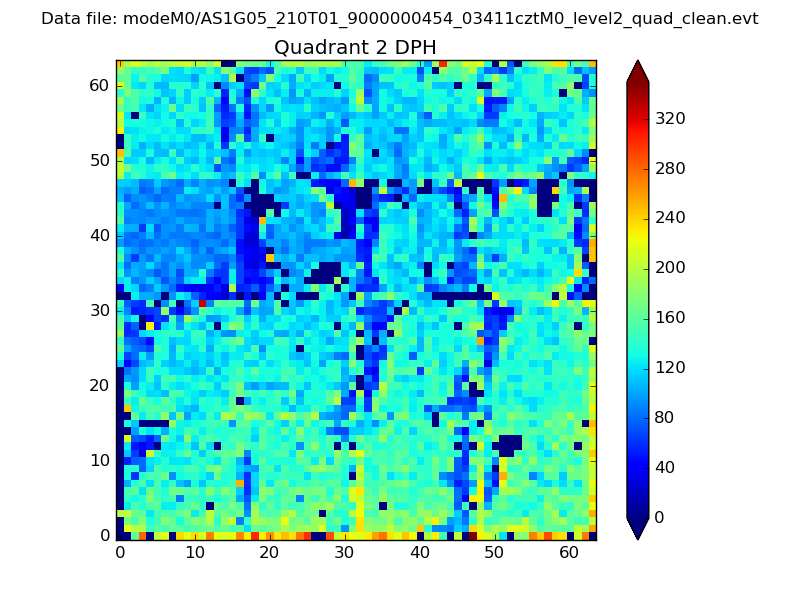
Histogram calculated using DETX and DETY for each event in the final _common_clean file
| Quadrant A | 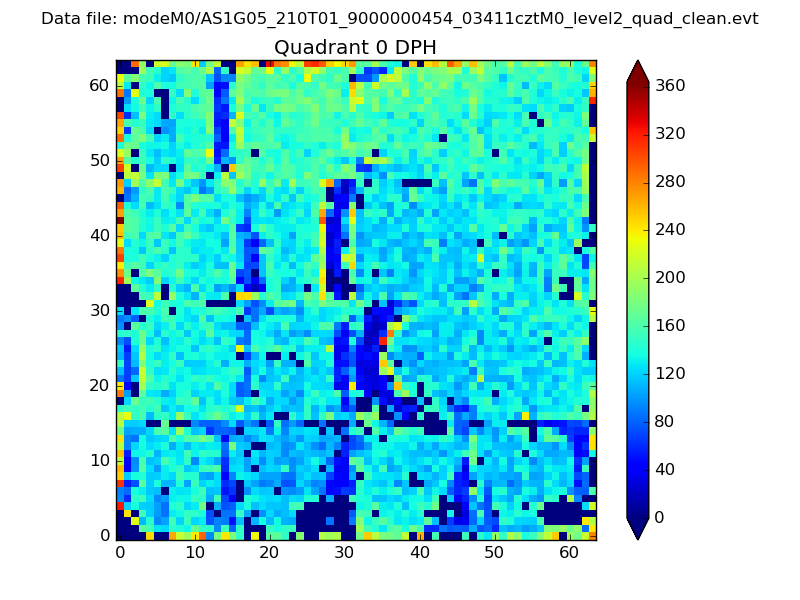 |
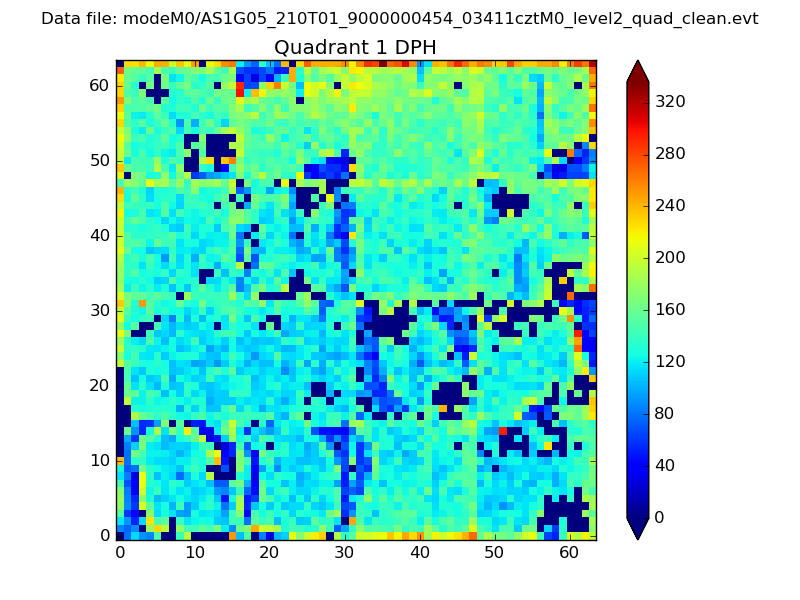 |
Quadrant B |
|---|---|---|---|
| Quadrant D | 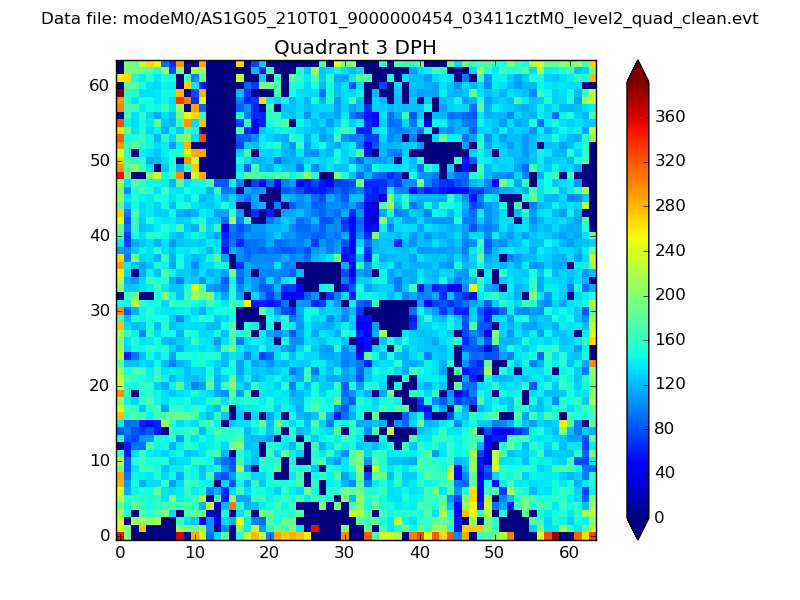 |
 |
Quadrant C |
| Plot type | Count rate plots | Images |
|---|---|---|
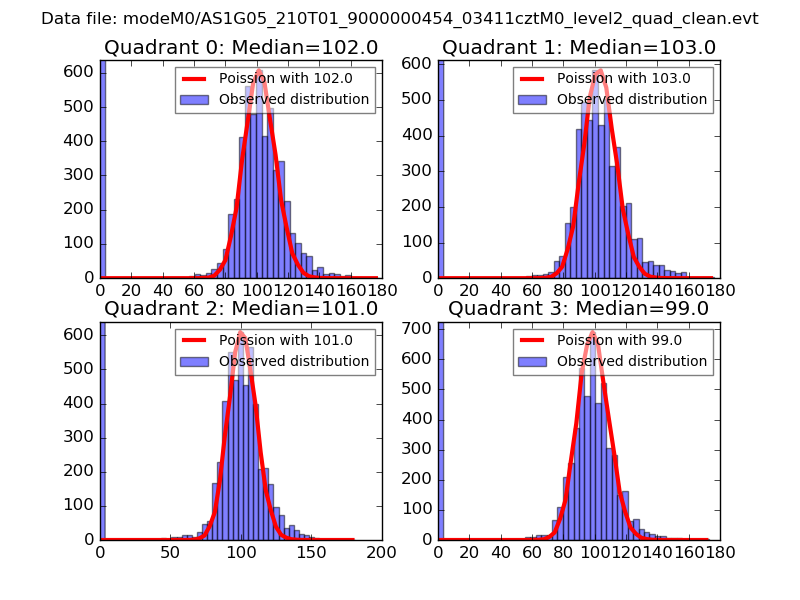
| Comparison with Poisson distribution Blue bars denote a histogram of data divided into 1 sec bins. Red curve is a Poisson curve with rate = median count rate of data. |
 |
 |
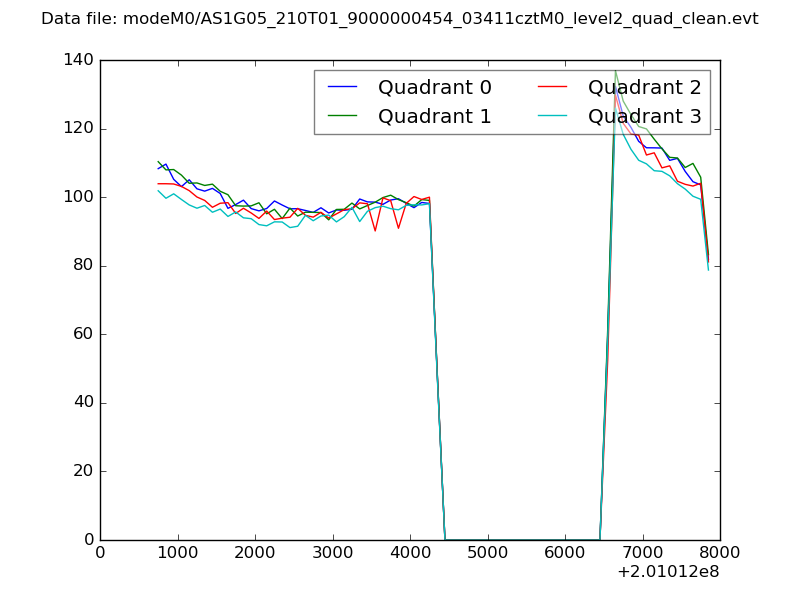
| Quadrant-wise count rates Data is divided into 100 sec bins |
 |
|
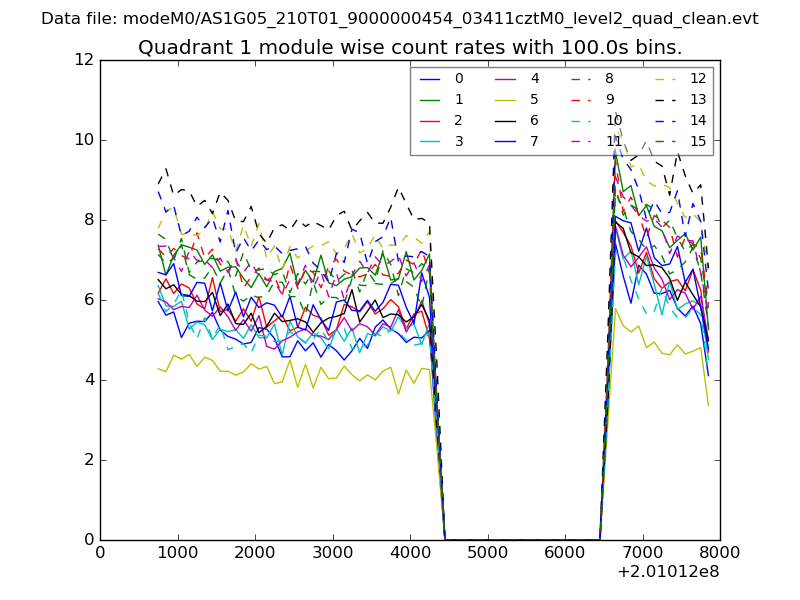
| Module-wise count rates for Quadrant A Data is divided into 100 sec bins |
 |
 |
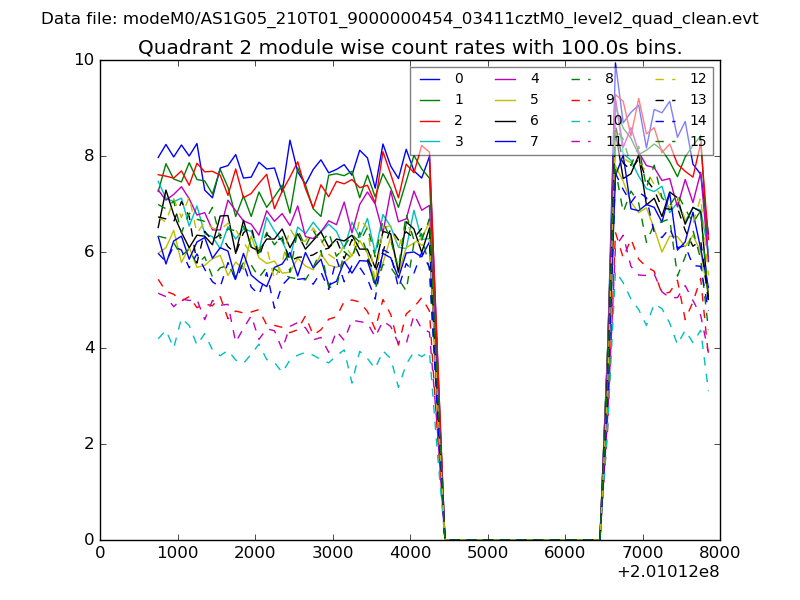
| Module-wise count rates for Quadrant B Data is divided into 100 sec bins |
 |
 |
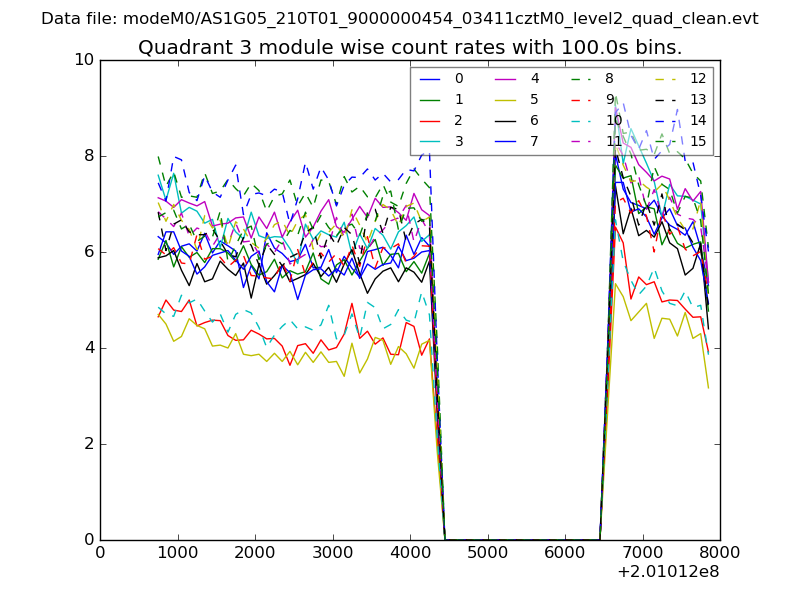
| Module-wise count rates for Quadrant C Data is divided into 100 sec bins |
 |
 |
| Module-wise count rates for Quadrant D Data is divided into 100 sec bins |
 |
 |
| Parameter | Plot |
|---|---|
| CZT HV Monitor | 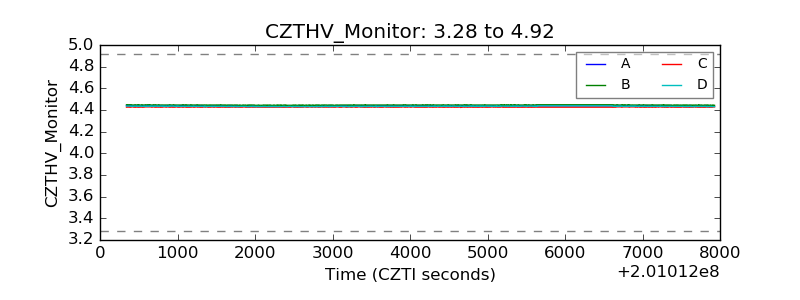 |
| D_VDD | 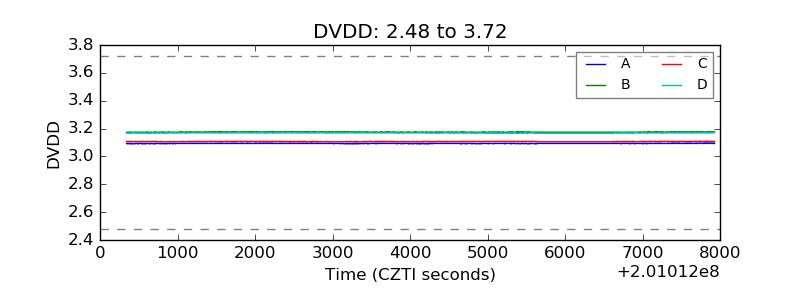 |
| Temperature 1 | 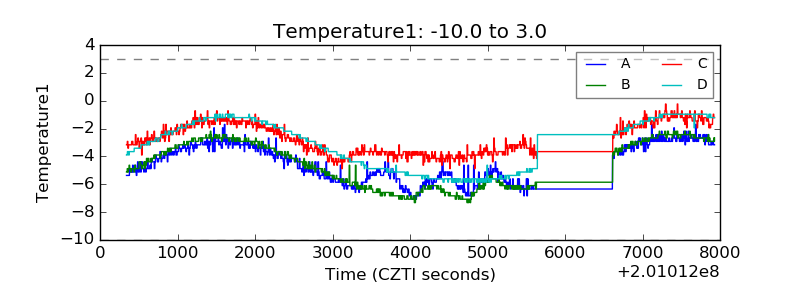 |
| Veto HV Monitor | 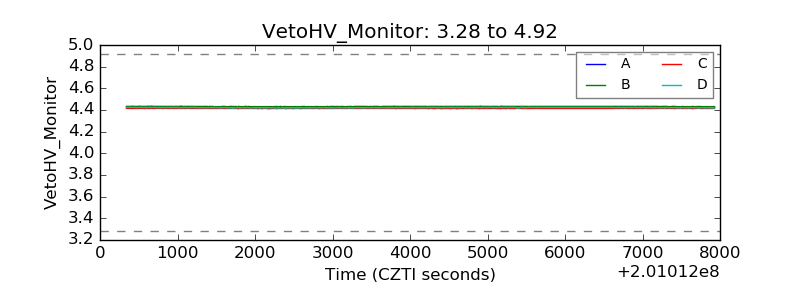 |
| Veto LLD | 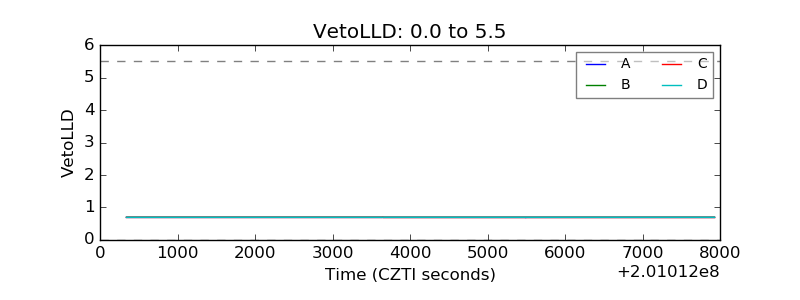 |
| Alpha Counter | 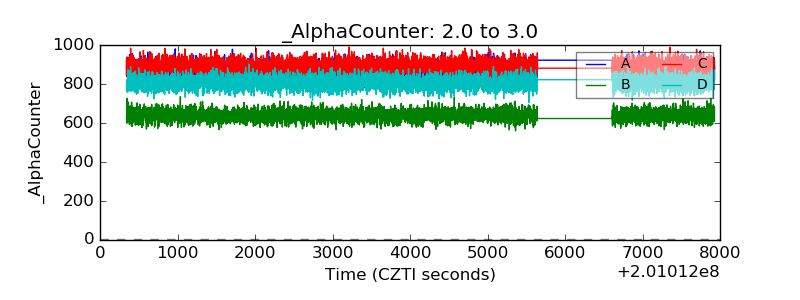 |
| _CPM_Rate |  |
| CZT Counter | 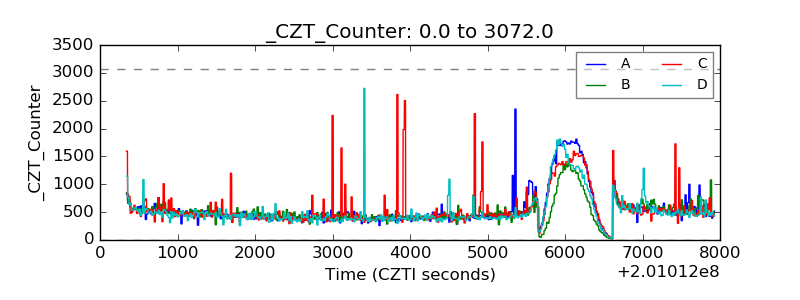 |
| +2.5 Volts monitor |  |
| +5 Volts monitor |  |
| _ROLL_ROT | 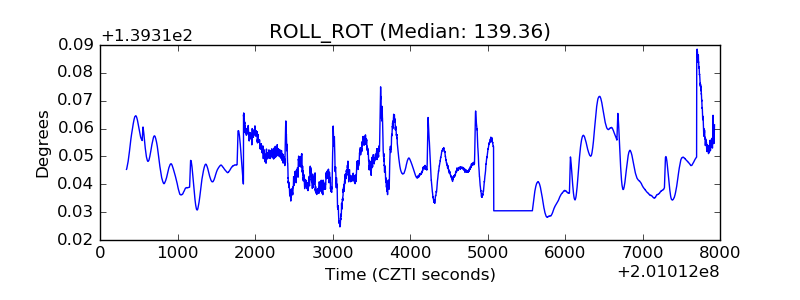 |
| _Roll_DEC | 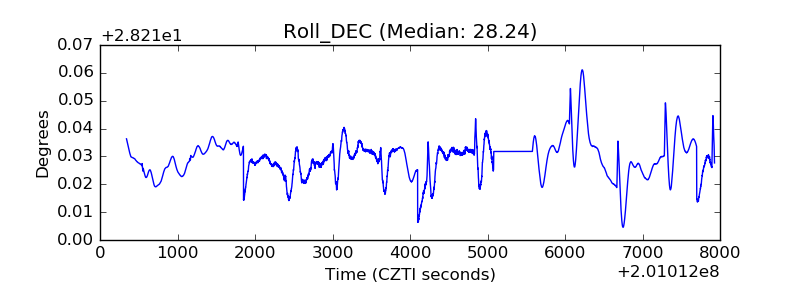 |
| _Roll_RA | 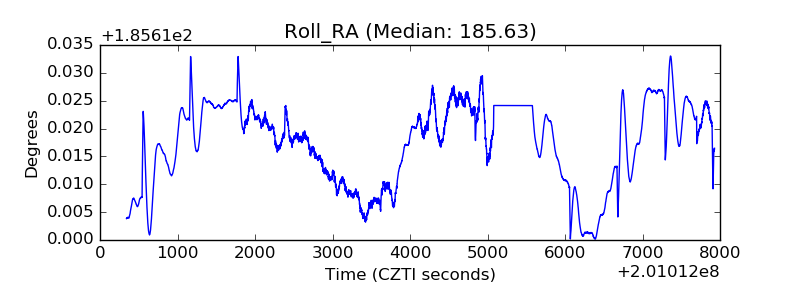 |
| Veto Counter | 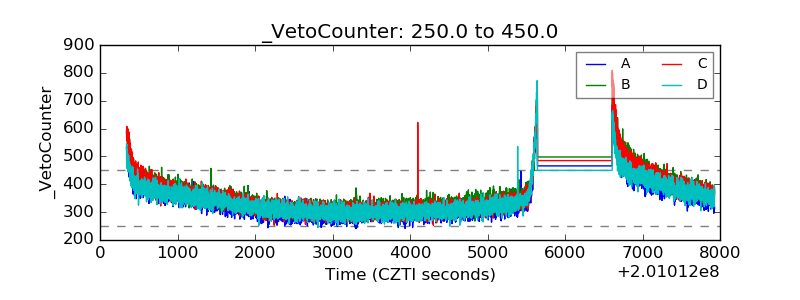 |