| Param | Original file | Final file |
|---|---|---|
| Filename | modeM0/AS1G05_210T01_9000000454_03413cztM0_level2.evt | modeM0/AS1G05_210T01_9000000454_03413cztM0_level2_quad_clean.evt |
| Size (bytes) | 447,410,880 | 83,399,040 |
| Size | 426.7 MB | 79.5 MB |
| Events in quadrant A | 3,261,146 | 524,335 |
| Events in quadrant B | 3,337,423 | 529,881 |
| Events in quadrant C | 3,439,718 | 518,038 |
| Events in quadrant D | 3,075,268 | 505,690 |
| Mode M9 | |||
|---|---|---|---|
| Quadrant | BADHDUFLAG | Total packets | Discarded packets |
| A | 0 | 22 | 0 |
| B | 0 | 22 | 0 |
| C | 0 | 22 | 0 |
| D | 0 | 22 | 0 |
| Mode SS | |||
|---|---|---|---|
| Quadrant | BADHDUFLAG | Total packets | Discarded packets |
| A | 0 | 130 | 0 |
| B | 0 | 130 | 0 |
| C | 0 | 130 | 0 |
| D | 0 | 130 | 0 |
| Mode M0 | |||
|---|---|---|---|
| Quadrant | BADHDUFLAG | Total packets | Discarded packets |
| A | 0 | 14110 | 3 |
| B | 0 | 14293 | 2 |
| C | 0 | 14608 | 2 |
| D | 0 | 13740 | 2 |
| Quadrant | Total seconds | Saturated seconds | Saturation percentage |
|---|---|---|---|
| A | 6422 | 159 | 2.475864% |
| B | 6422 | 142 | 2.211149% |
| C | 6422 | 185 | 2.880723% |
| D | 6422 | 131 | 2.039863% |
Noise dominated data is calculated using 1-second bins in cleaned event files. If a bin has >2000 counts, and if more than 50% of those come from <1% of pixels, then it is considered to be noise-dominated and hence unusable.
| Quadrant | # 1 sec bins | Bins with >0 counts | Bins with >2000 counts | High rate bins dominated by noise | Noise dominated (total time) | Noise dominated (detector-on time) | Marked lightcurve |
|---|---|---|---|---|---|---|---|
| A | 8497 | 6424 | 15 | 15 | 0.18% | 0.23% | 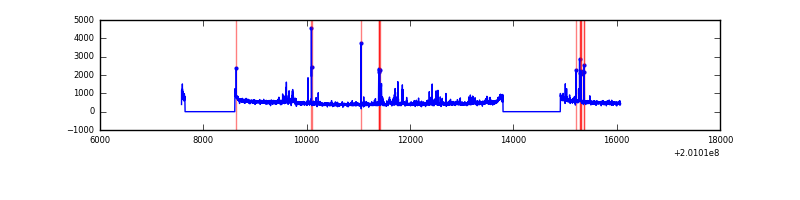 |
| B | 8497 | 6424 | 2 | 2 | 0.02% | 0.03% | 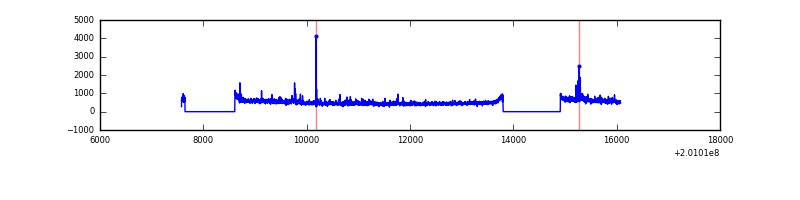 |
| C | 8497 | 6424 | 30 | 30 | 0.35% | 0.47% | 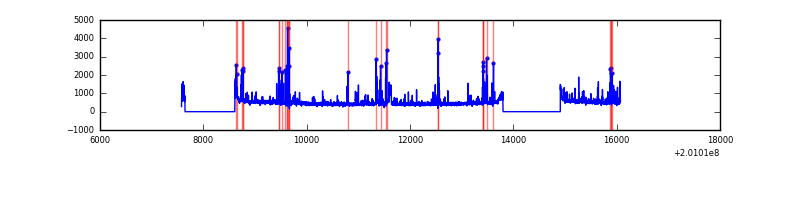 |
| D | 8497 | 6424 | 11 | 11 | 0.13% | 0.17% | 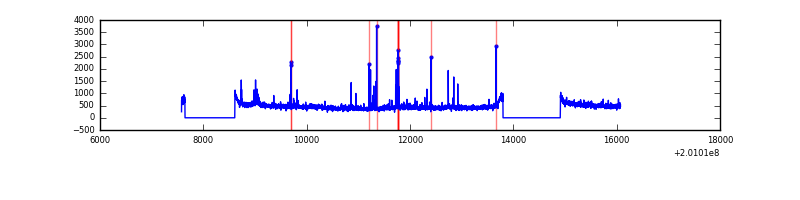 |
Top three noisy pixels from each quadrant. If the there are fewer than three noisy pixels in the level2.evt file, extra rows are filled as -1
| Pixel properties | Quadrant properties | ||||||
|---|---|---|---|---|---|---|---|
| Quadrant | DetID | PixID | Counts | Sigma | Mean | Median | Sigma |
| A | 0 | 118 | 160330 | 1023.92 | 767 | 751 | 155.9 |
| A | 0 | 31 | 70845 | 449.75 | 767 | 751 | 155.9 |
| A | 14 | 249 | 35483 | 222.85 | 767 | 751 | 155.9 |
| B | 15 | 204 | 230682 | 1525.6 | 777 | 758 | 150.7 |
| B | 0 | 182 | 26043 | 167.77 | 777 | 758 | 150.7 |
| B | 0 | 246 | 24138 | 155.13 | 777 | 758 | 150.7 |
| C | 7 | 220 | 279500 | 1589.91 | 750 | 753 | 175.3 |
| C | 9 | 54 | 89342 | 505.29 | 750 | 753 | 175.3 |
| C | 1 | 192 | 64525 | 363.74 | 750 | 753 | 175.3 |
| D | 13 | 223 | 58799 | 319.31 | 750 | 728 | 181.9 |
| D | 2 | 37 | 53507 | 290.22 | 750 | 728 | 181.9 |
| D | 3 | 247 | 31539 | 169.42 | 750 | 728 | 181.9 |
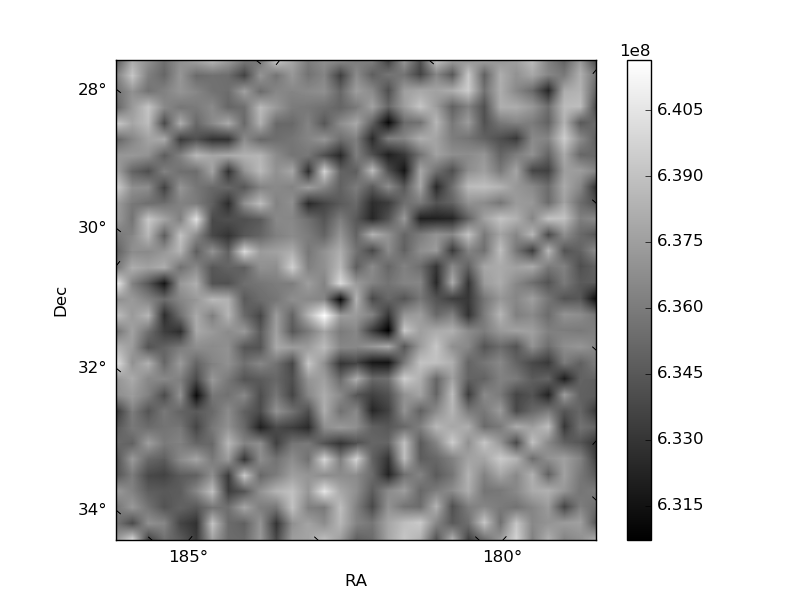
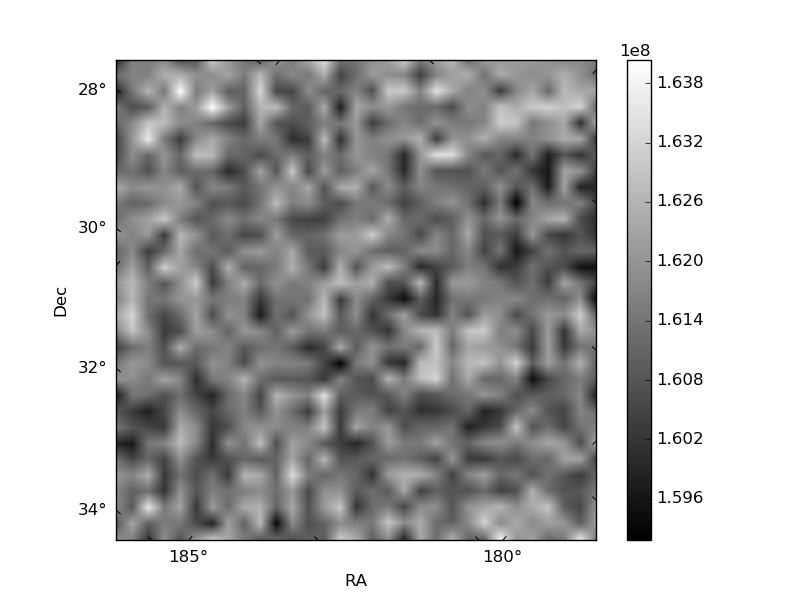
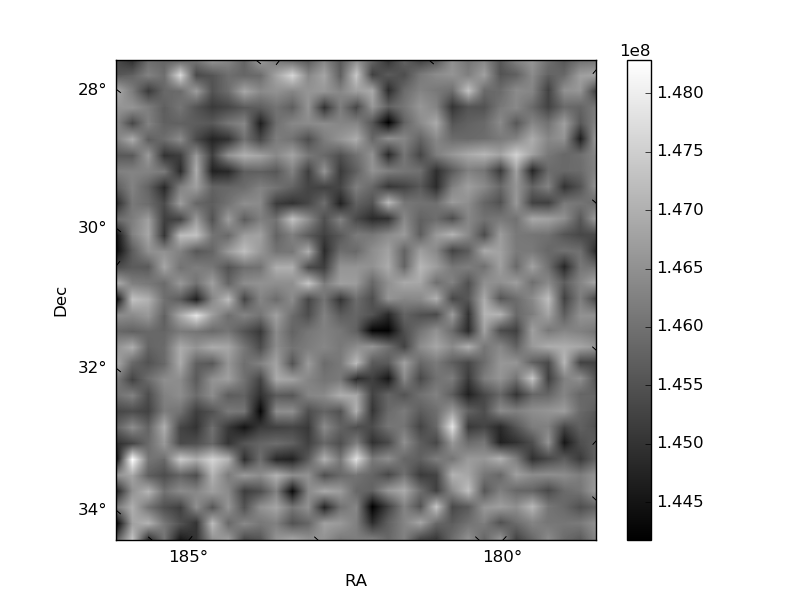
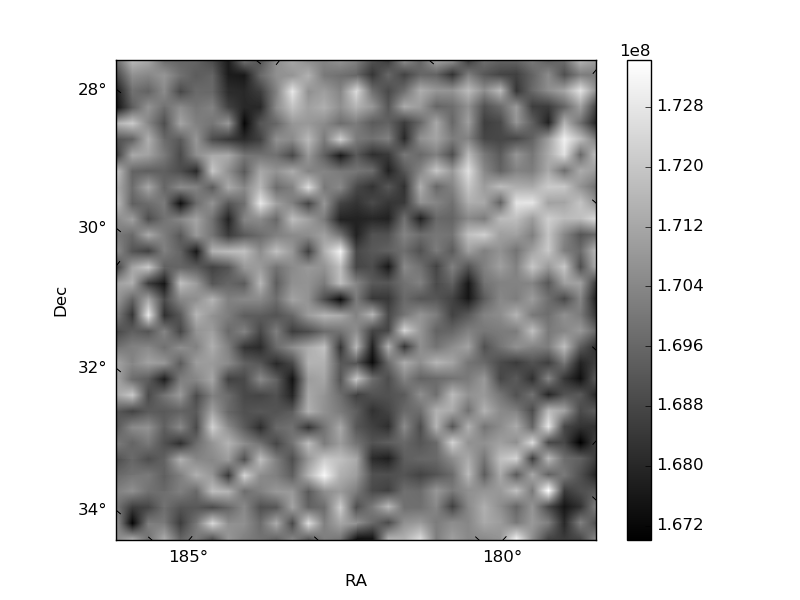
Histogram calculated using DETX and DETY for each event in the final _common_clean file
| Quadrant A | 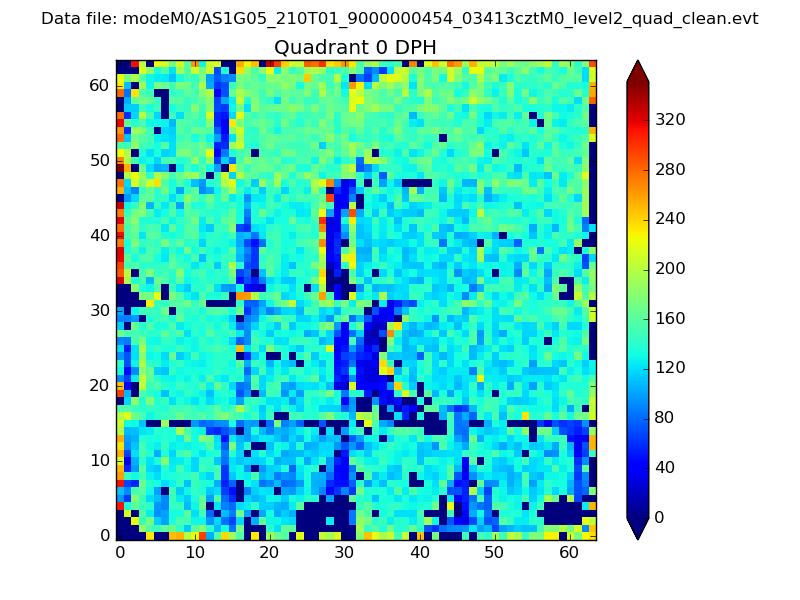 |
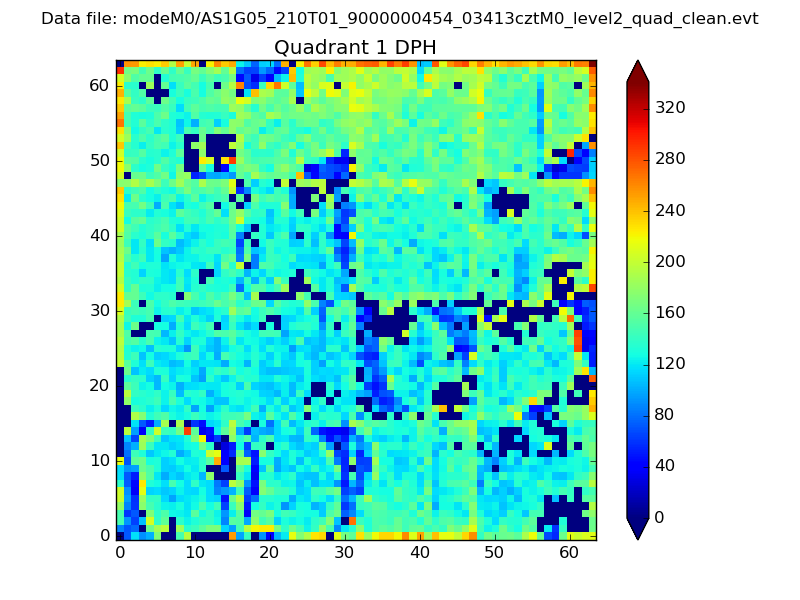 |
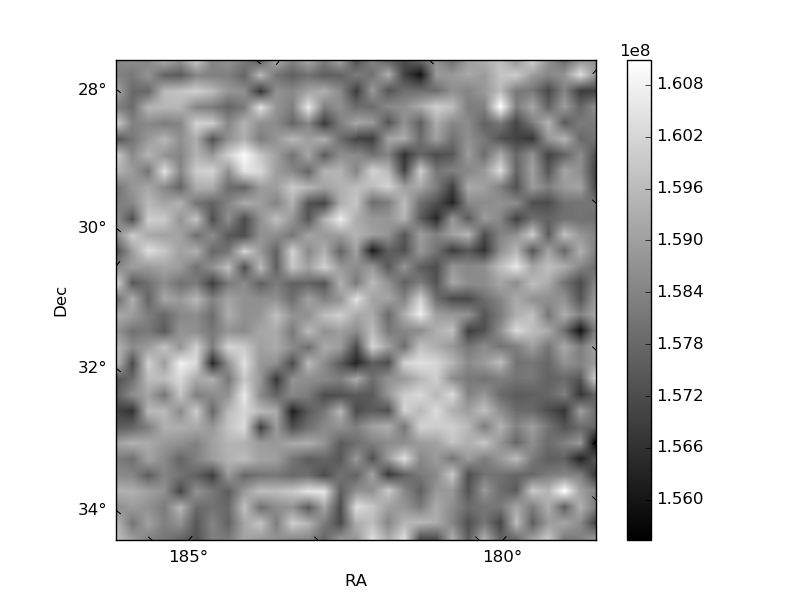
Quadrant B |
|---|---|---|---|
| Quadrant D | 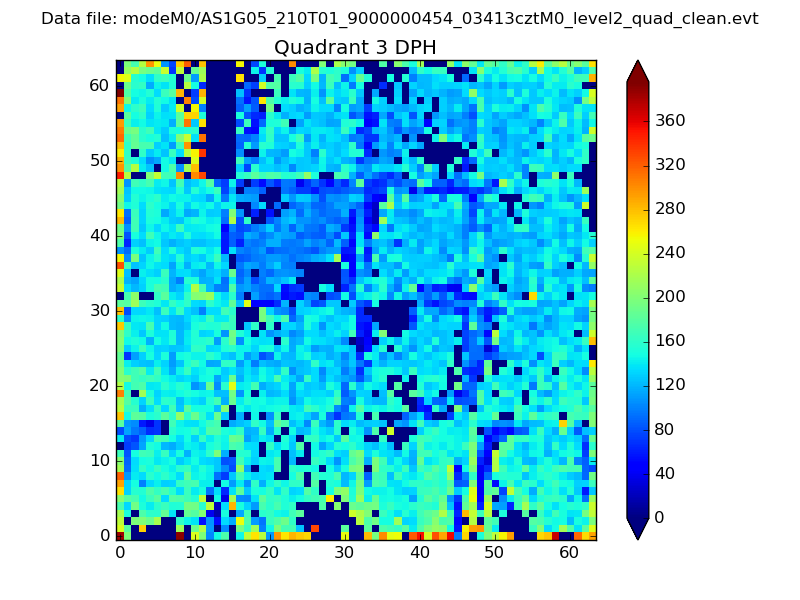 |
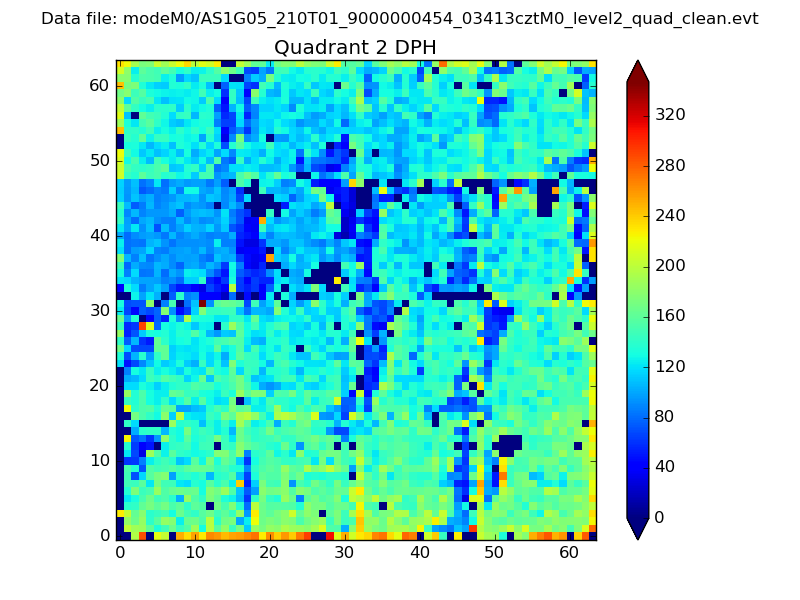 |
Quadrant C |
| Plot type | Count rate plots | Images |
|---|---|---|
| Comparison with Poisson distribution Blue bars denote a histogram of data divided into 1 sec bins. Red curve is a Poisson curve with rate = median count rate of data. |
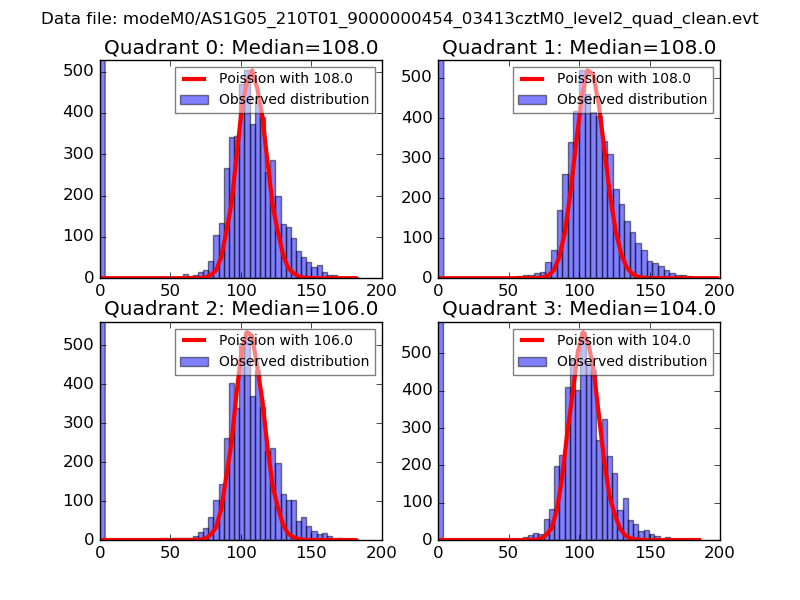 |
 |
| Quadrant-wise count rates Data is divided into 100 sec bins |
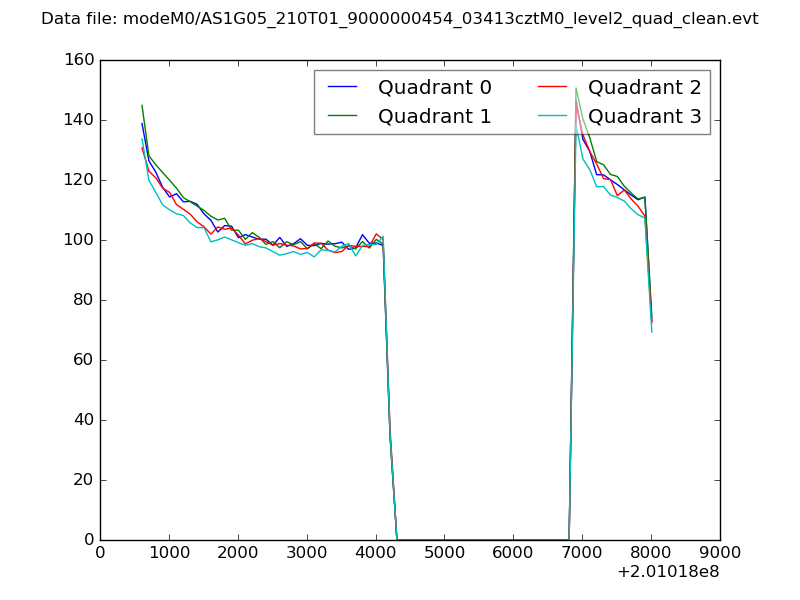 |
|
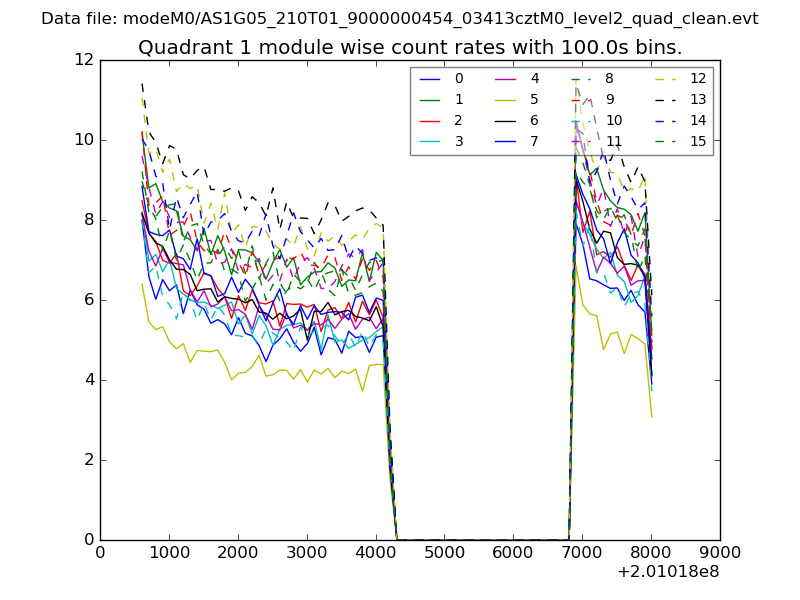
| Module-wise count rates for Quadrant A Data is divided into 100 sec bins |
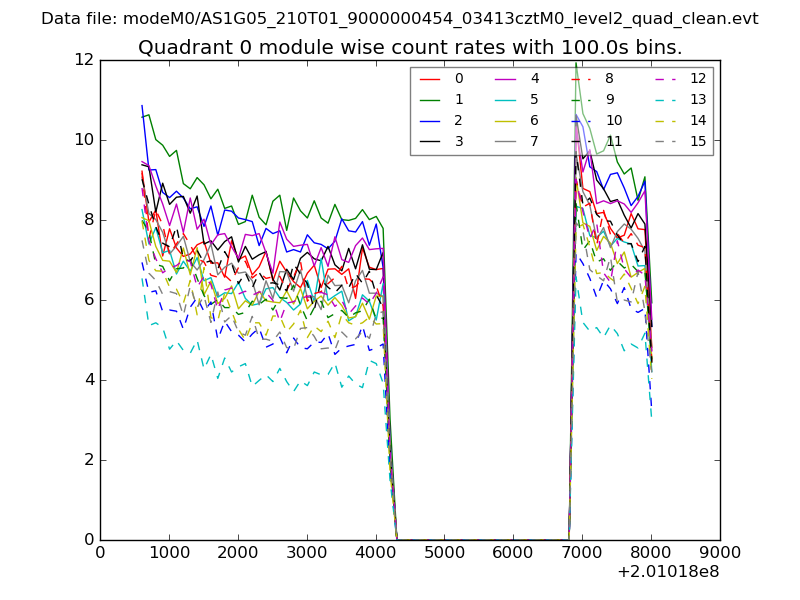 |
 |
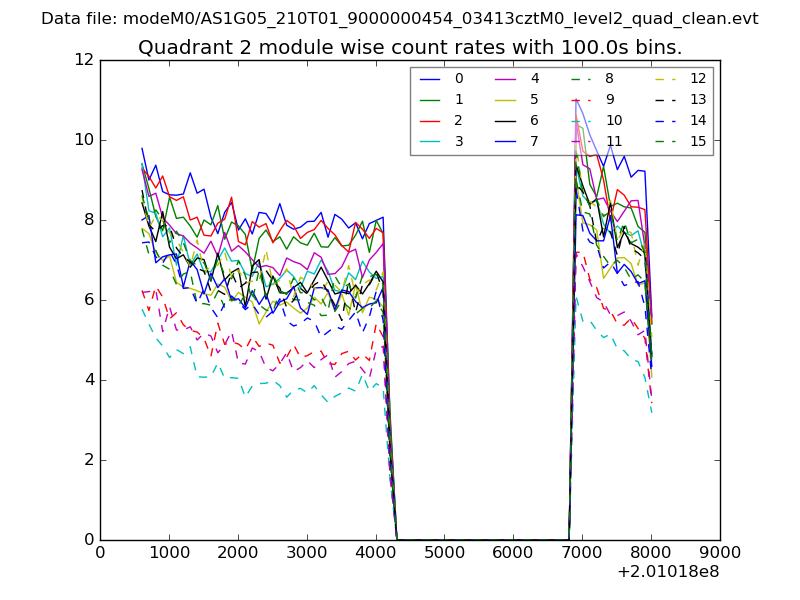
| Module-wise count rates for Quadrant B Data is divided into 100 sec bins |
 |
 |
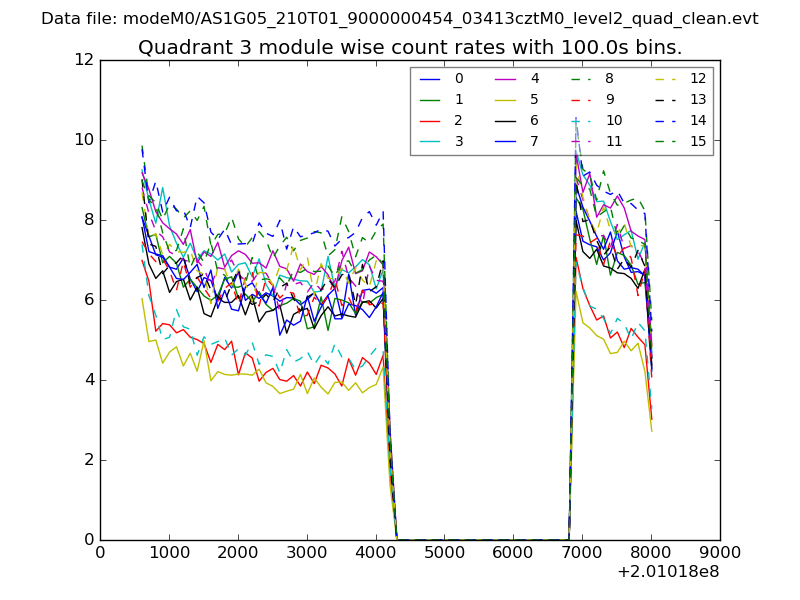
| Module-wise count rates for Quadrant C Data is divided into 100 sec bins |
 |
 |
| Module-wise count rates for Quadrant D Data is divided into 100 sec bins |
 |
 |
| Parameter | Plot |
|---|---|
| CZT HV Monitor | 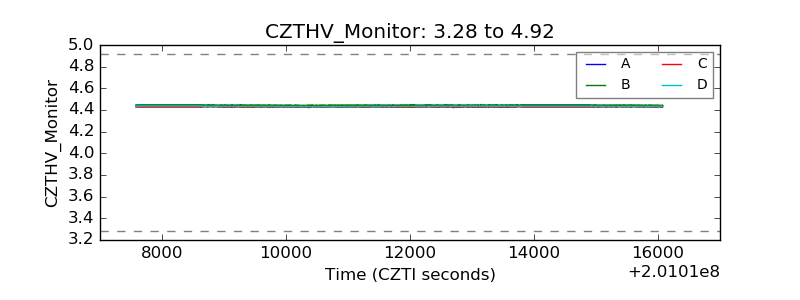 |
| D_VDD | 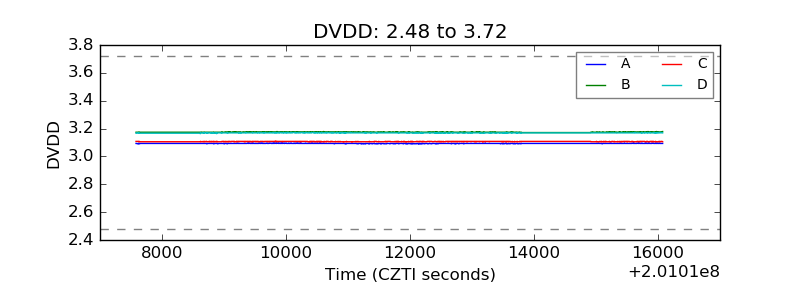 |
| Temperature 1 | 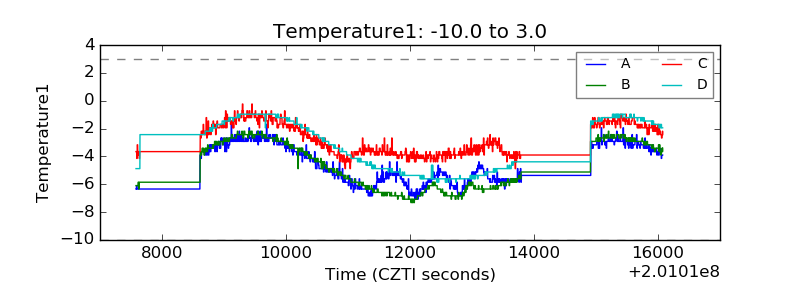 |
| Veto HV Monitor | 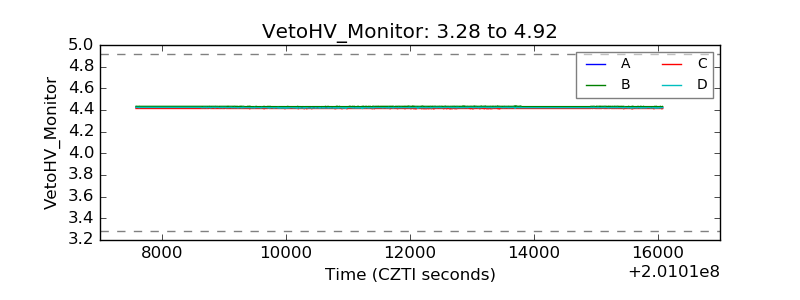 |
| Veto LLD | 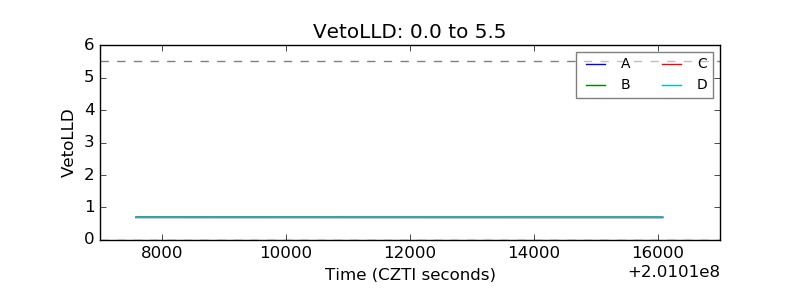 |
| Alpha Counter | 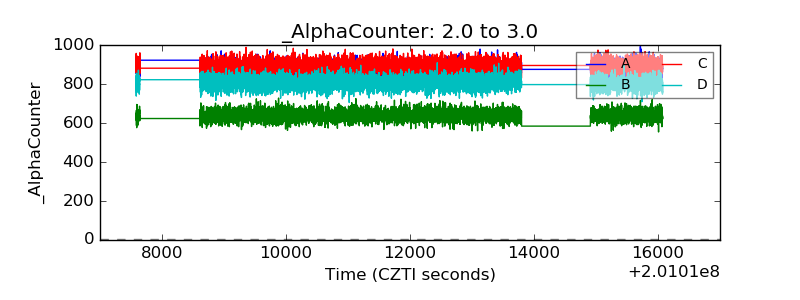 |
| _CPM_Rate | 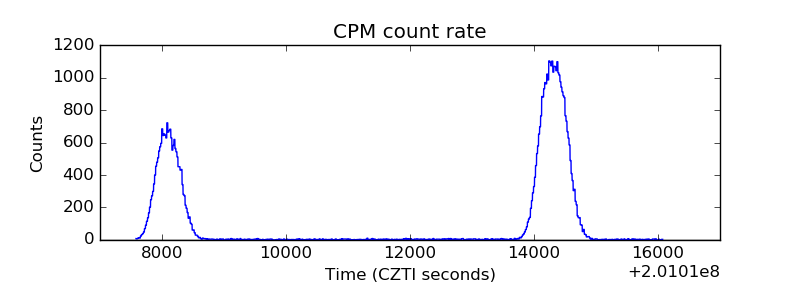 |
| CZT Counter | 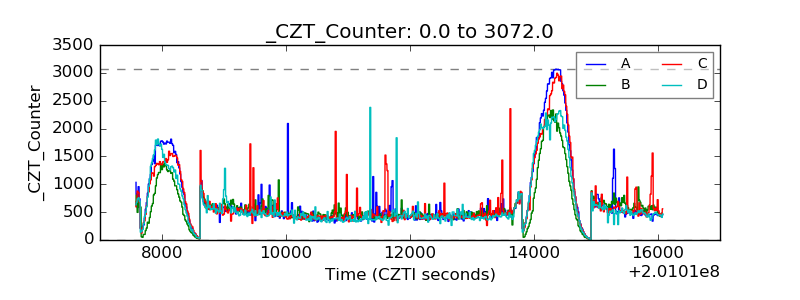 |
| +2.5 Volts monitor |  |
| +5 Volts monitor |  |
| _ROLL_ROT | 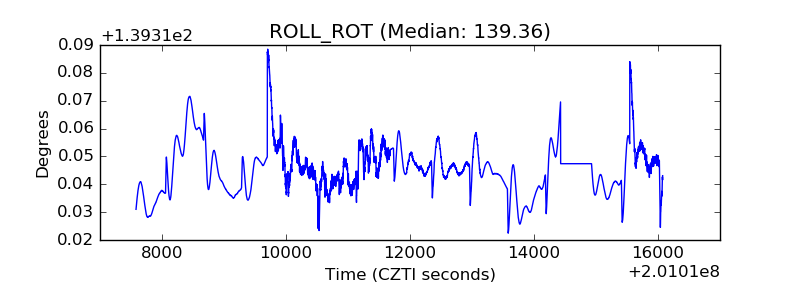 |
| _Roll_DEC | 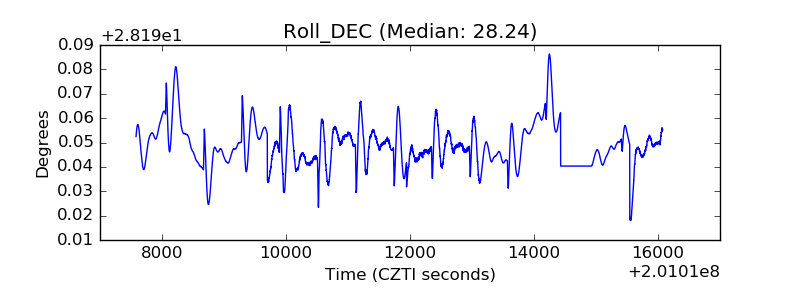 |
| _Roll_RA | 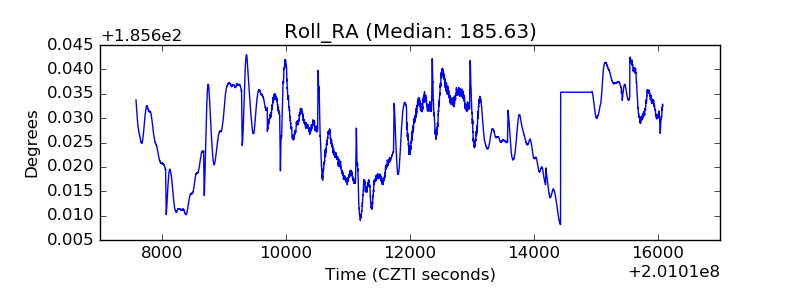 |
| Veto Counter | 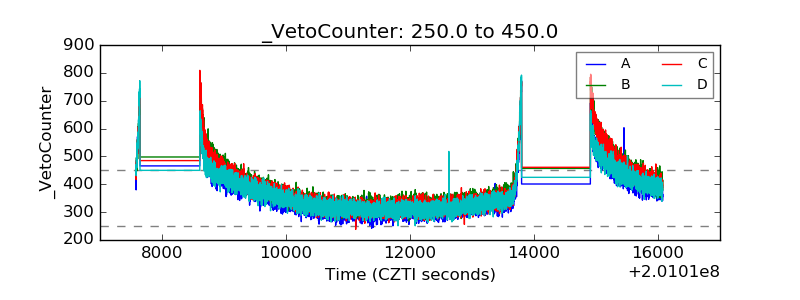 |