| Param | Original file | Final file |
|---|---|---|
| Filename | modeM0/AS1G05_210T01_9000000454_03414cztM0_level2.evt | modeM0/AS1G05_210T01_9000000454_03414cztM0_level2_quad_clean.evt |
| Size (bytes) | 484,943,040 | 82,152,000 |
| Size | 462.5 MB | 78.3 MB |
| Events in quadrant A | 3,015,363 | 517,376 |
| Events in quadrant B | 3,984,083 | 515,968 |
| Events in quadrant C | 4,295,299 | 507,963 |
| Events in quadrant D | 2,958,305 | 500,772 |
| Mode M9 | |||
|---|---|---|---|
| Quadrant | BADHDUFLAG | Total packets | Discarded packets |
| A | 0 | 12 | 0 |
| B | 0 | 12 | 0 |
| C | 0 | 12 | 0 |
| D | 0 | 12 | 0 |
| Mode SS | |||
|---|---|---|---|
| Quadrant | BADHDUFLAG | Total packets | Discarded packets |
| A | 0 | 130 | 0 |
| B | 0 | 130 | 0 |
| C | 0 | 130 | 0 |
| D | 0 | 130 | 0 |
| Mode M0 | |||
|---|---|---|---|
| Quadrant | BADHDUFLAG | Total packets | Discarded packets |
| A | 0 | 13473 | 3 |
| B | 0 | 16360 | 2 |
| C | 0 | 16943 | 2 |
| D | 0 | 13454 | 2 |
| Quadrant | Total seconds | Saturated seconds | Saturation percentage |
|---|---|---|---|
| A | 6384 | 74 | 1.159148% |
| B | 6384 | 118 | 1.848371% |
| C | 6384 | 214 | 3.352130% |
| D | 6384 | 57 | 0.892857% |
Noise dominated data is calculated using 1-second bins in cleaned event files. If a bin has >2000 counts, and if more than 50% of those come from <1% of pixels, then it is considered to be noise-dominated and hence unusable.
| Quadrant | # 1 sec bins | Bins with >0 counts | Bins with >2000 counts | High rate bins dominated by noise | Noise dominated (total time) | Noise dominated (detector-on time) | Marked lightcurve |
|---|---|---|---|---|---|---|---|
| A | 7579 | 6385 | 7 | 7 | 0.09% | 0.11% | 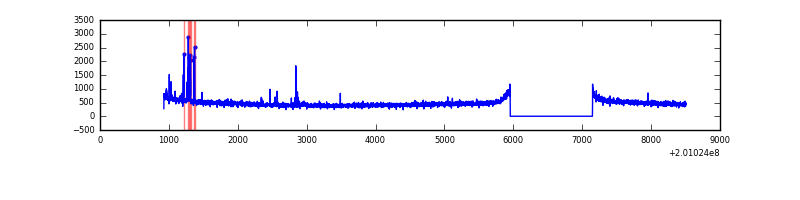 |
| B | 7579 | 6385 | 44 | 44 | 0.58% | 0.69% | 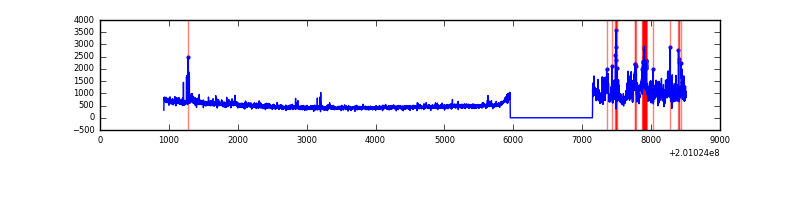 |
| C | 7579 | 6385 | 160 | 160 | 2.11% | 2.51% | 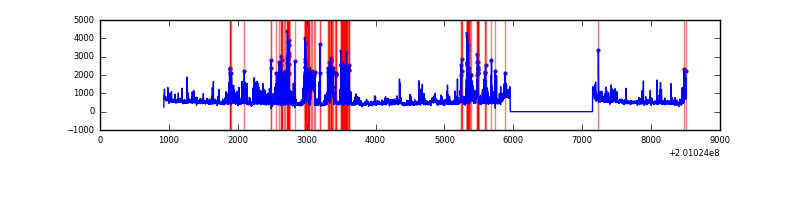 |
| D | 7579 | 6385 | 16 | 16 | 0.21% | 0.25% | 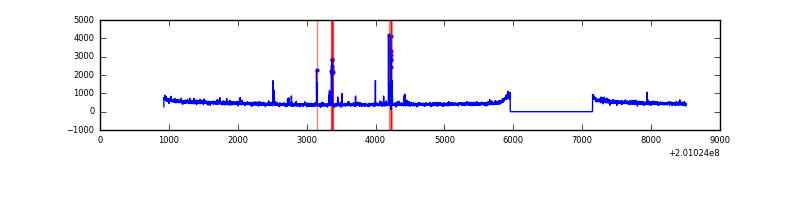 |
Top three noisy pixels from each quadrant. If the there are fewer than three noisy pixels in the level2.evt file, extra rows are filled as -1
| Pixel properties | Quadrant properties | ||||||
|---|---|---|---|---|---|---|---|
| Quadrant | DetID | PixID | Counts | Sigma | Mean | Median | Sigma |
| A | 0 | 118 | 65668 | 416.79 | 763 | 747 | 155.8 |
| A | 0 | 226 | 13782 | 83.68 | 763 | 747 | 155.8 |
| A | 12 | 194 | 8231 | 48.05 | 763 | 747 | 155.8 |
| B | 15 | 204 | 730190 | 4949.65 | 768 | 749 | 147.4 |
| B | 14 | 167 | 177800 | 1201.38 | 768 | 749 | 147.4 |
| B | 7 | 252 | 51899 | 347.08 | 768 | 749 | 147.4 |
| C | 1 | 192 | 706167 | 4089.55 | 741 | 745 | 172.5 |
| C | 7 | 220 | 419367 | 2426.88 | 741 | 745 | 172.5 |
| C | 8 | 208 | 180123 | 1039.91 | 741 | 745 | 172.5 |
| D | 9 | 85 | 51877 | 281.31 | 743 | 724 | 181.8 |
| D | 13 | 223 | 40243 | 217.33 | 743 | 724 | 181.8 |
| D | 12 | 246 | 24411 | 130.26 | 743 | 724 | 181.8 |
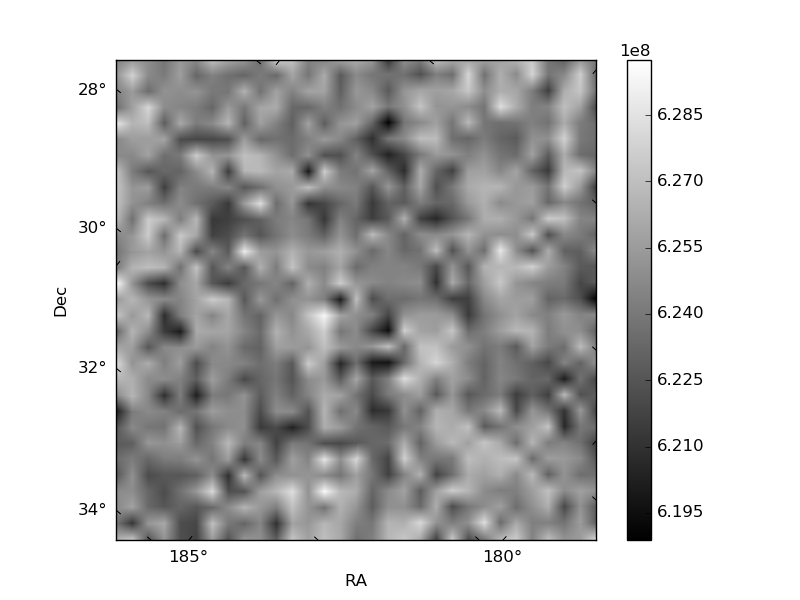
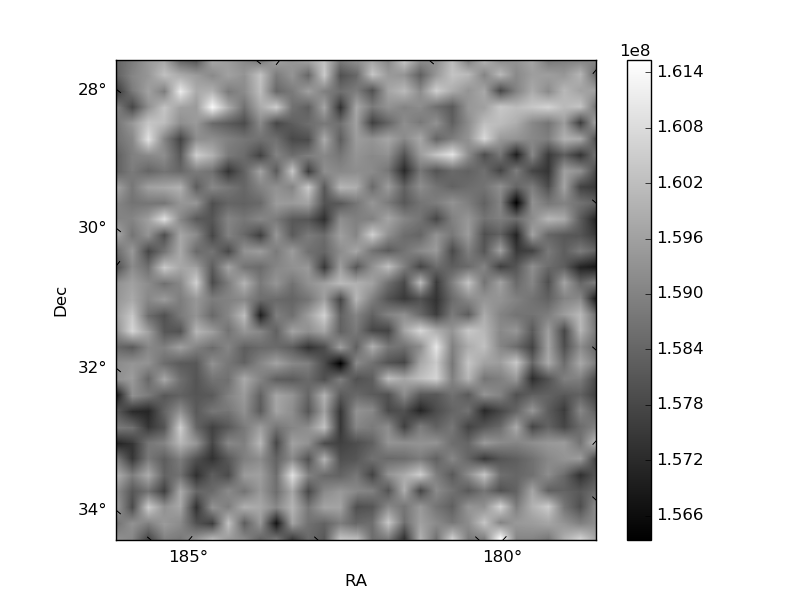
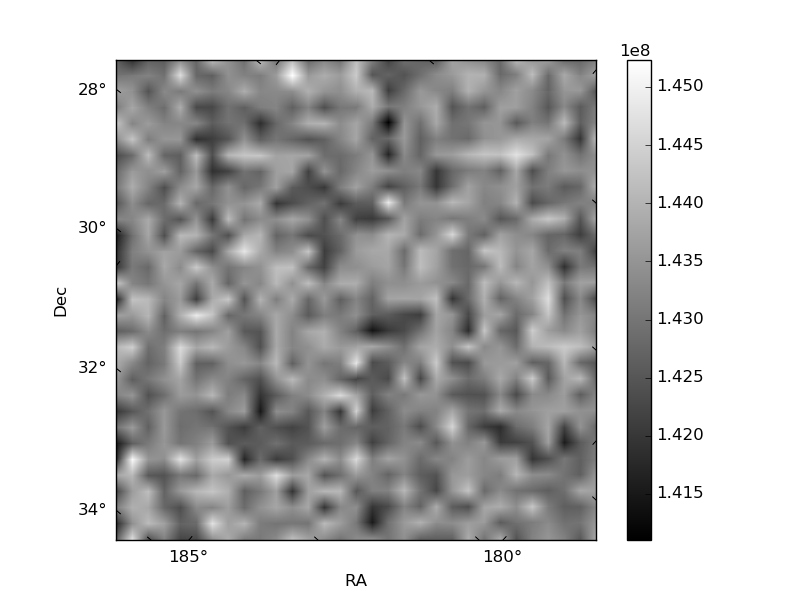
Histogram calculated using DETX and DETY for each event in the final _common_clean file
| Quadrant A | 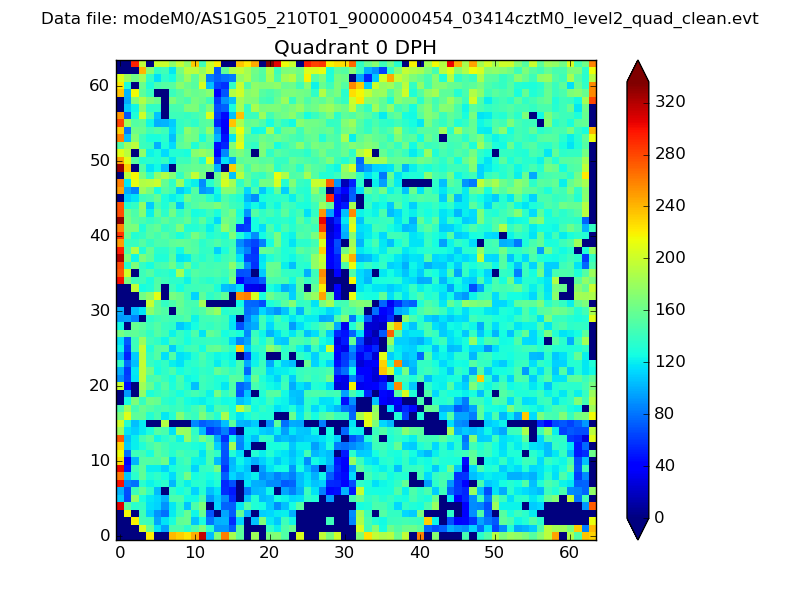 |
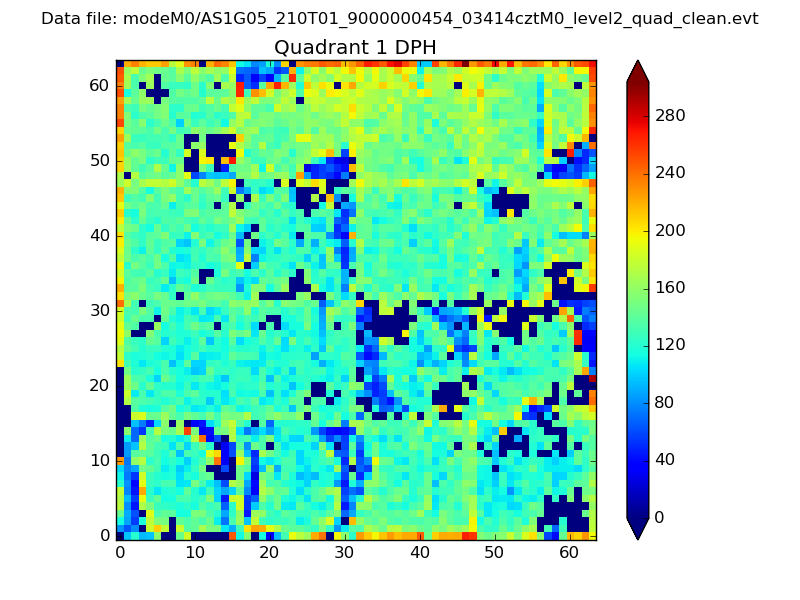 |
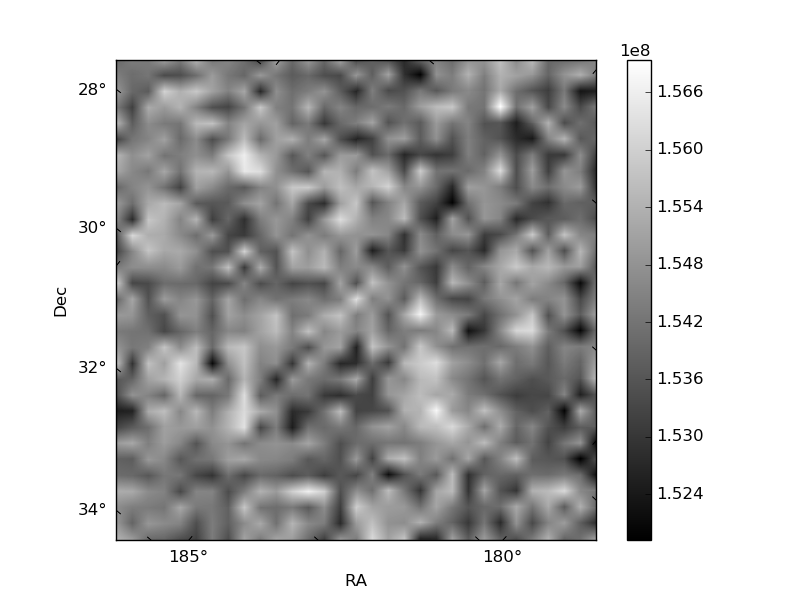
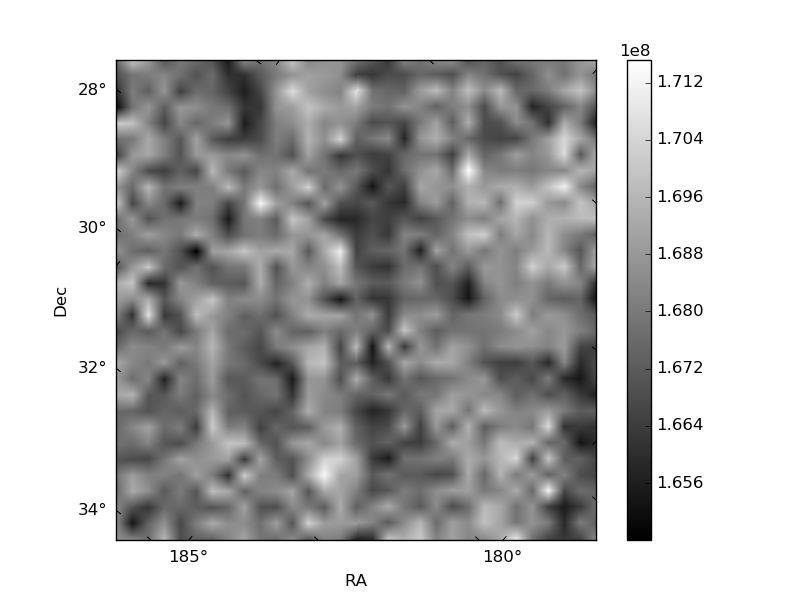
Quadrant B |
|---|---|---|---|
| Quadrant D | 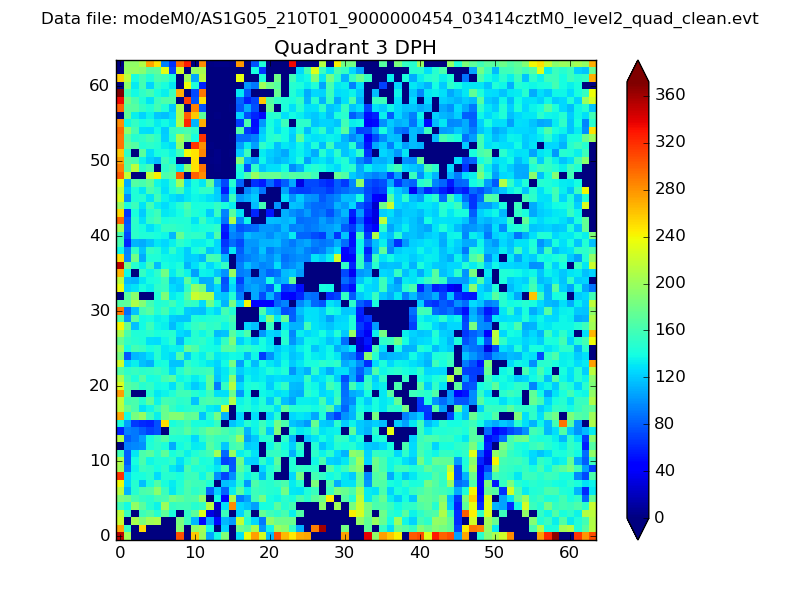 |
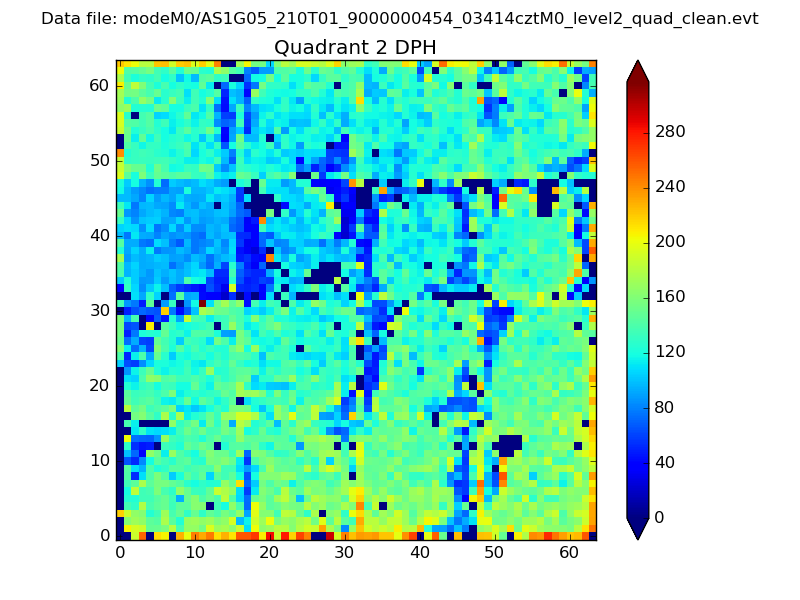 |
Quadrant C |
| Plot type | Count rate plots | Images |
|---|---|---|
| Comparison with Poisson distribution Blue bars denote a histogram of data divided into 1 sec bins. Red curve is a Poisson curve with rate = median count rate of data. |
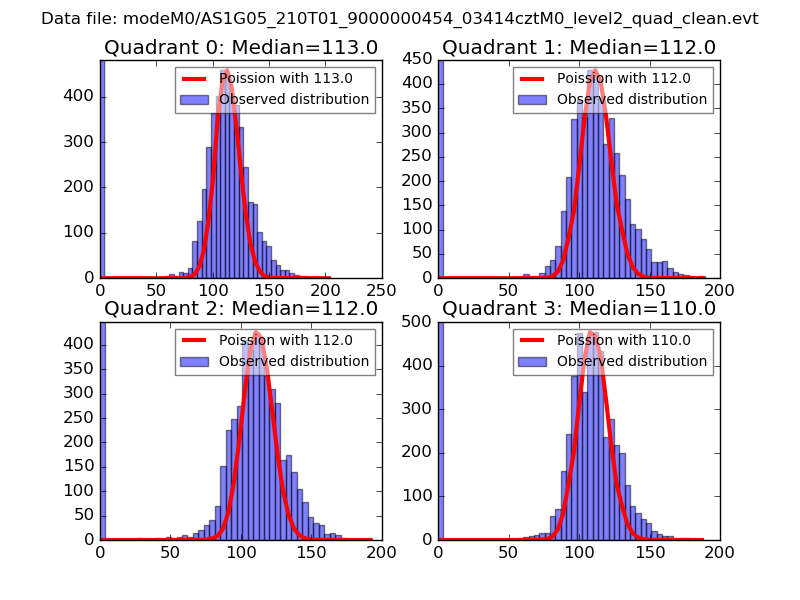 |
 |
| Quadrant-wise count rates Data is divided into 100 sec bins |
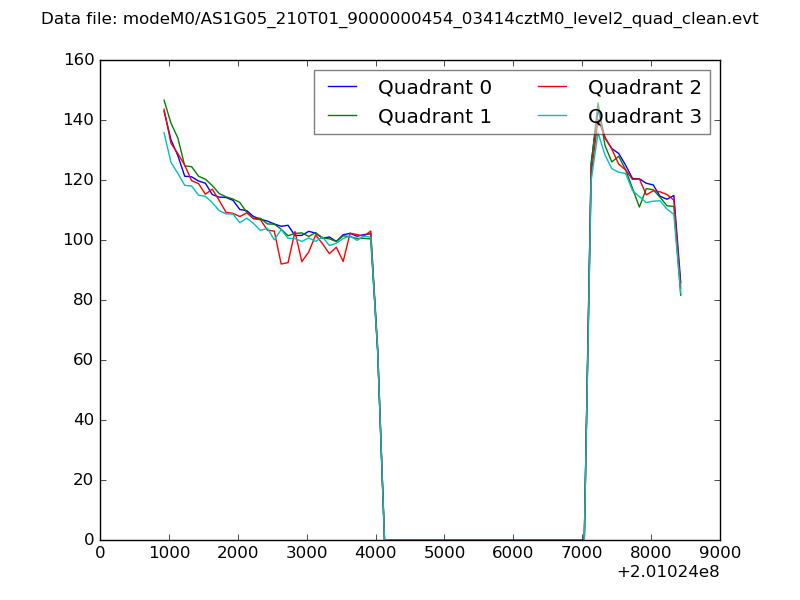 |
|
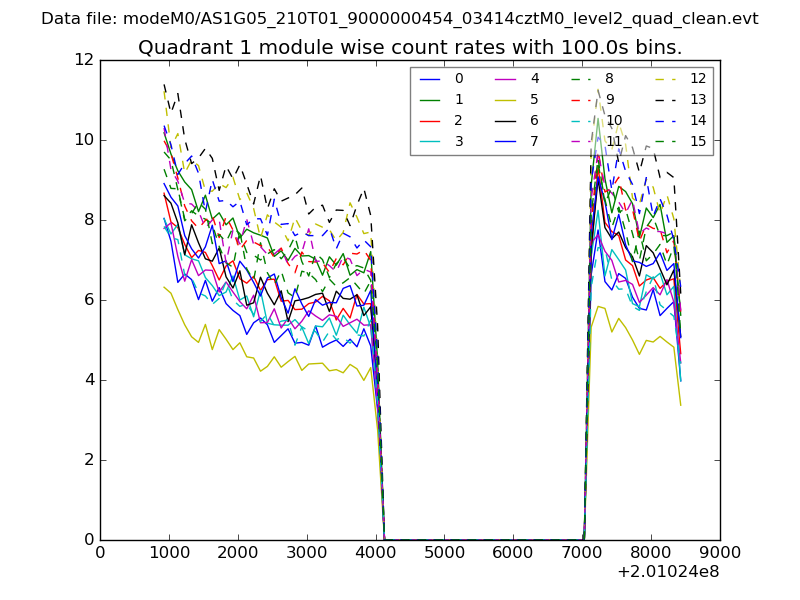
| Module-wise count rates for Quadrant A Data is divided into 100 sec bins |
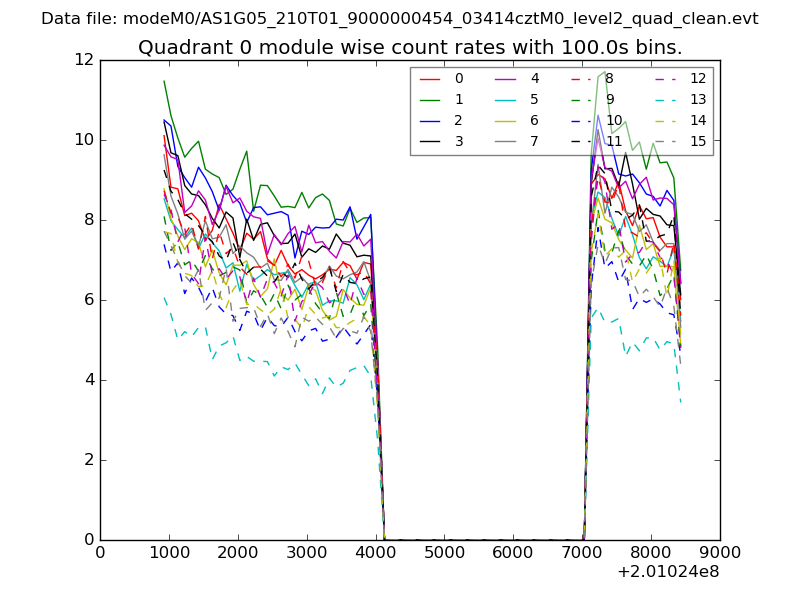 |
 |
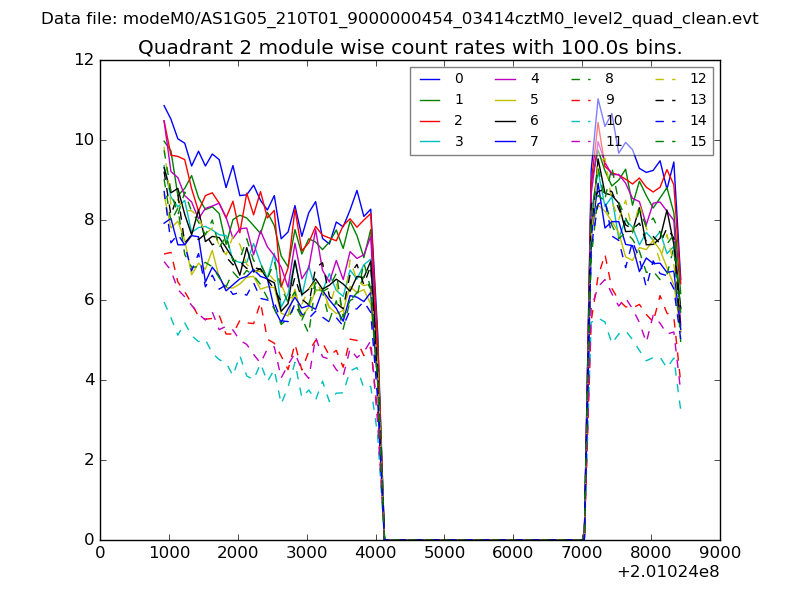
| Module-wise count rates for Quadrant B Data is divided into 100 sec bins |
 |
 |
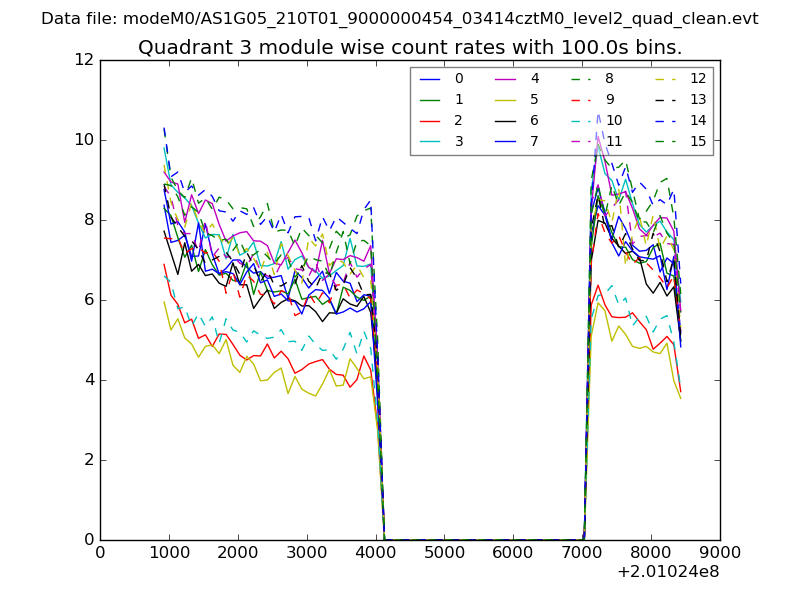
| Module-wise count rates for Quadrant C Data is divided into 100 sec bins |
 |
 |
| Module-wise count rates for Quadrant D Data is divided into 100 sec bins |
 |
 |
| Parameter | Plot |
|---|---|
| CZT HV Monitor | 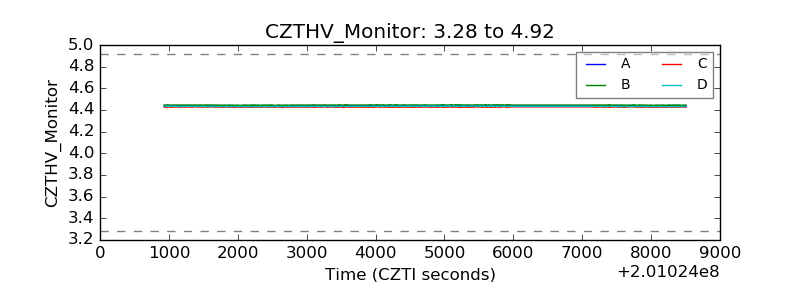 |
| D_VDD | 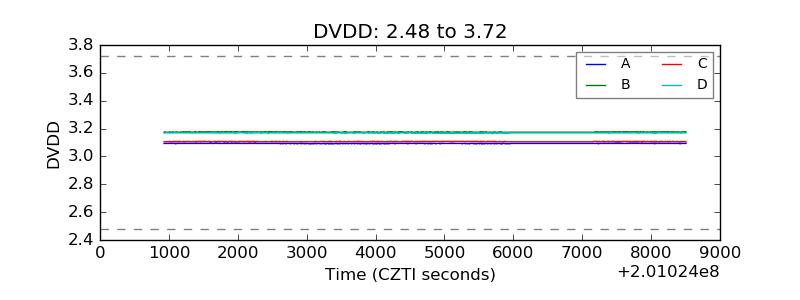 |
| Temperature 1 | 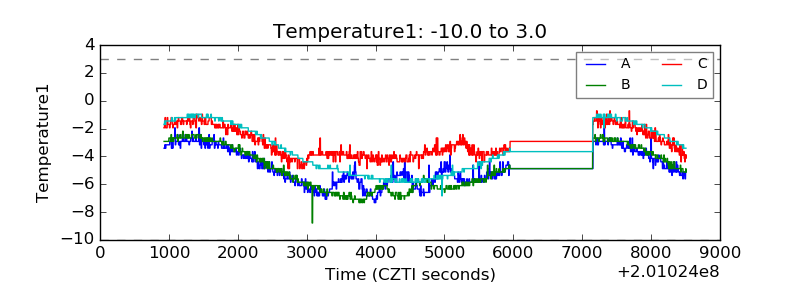 |
| Veto HV Monitor | 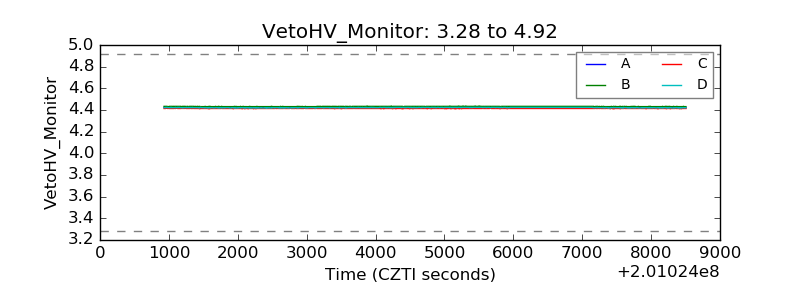 |
| Veto LLD | 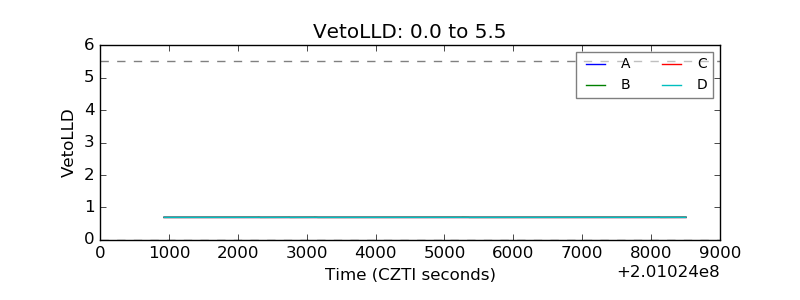 |
| Alpha Counter | 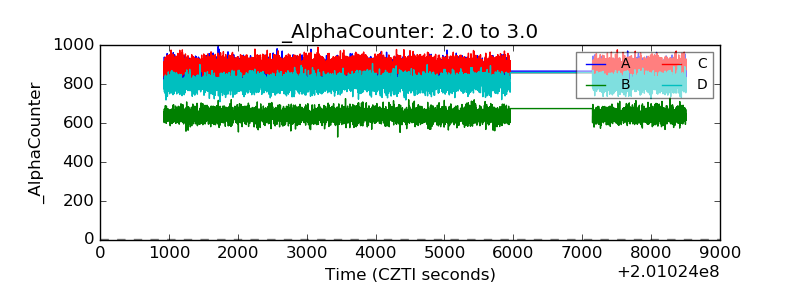 |
| _CPM_Rate | 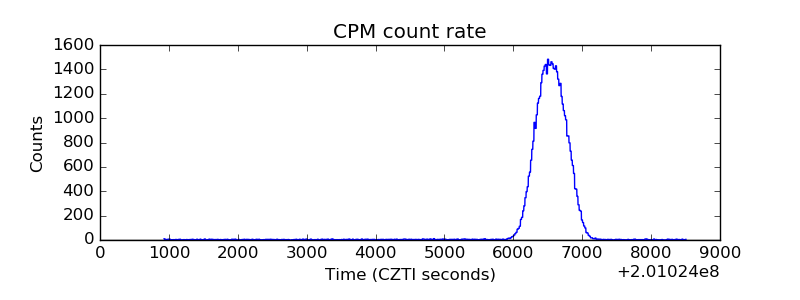 |
| CZT Counter | 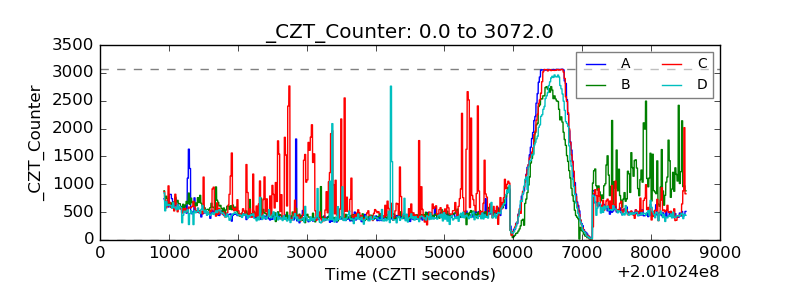 |
| +2.5 Volts monitor | 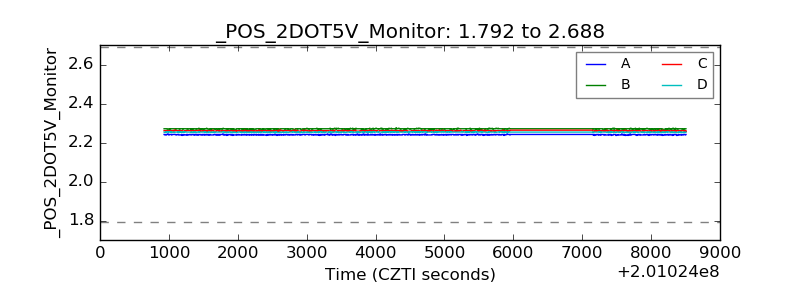 |
| +5 Volts monitor | 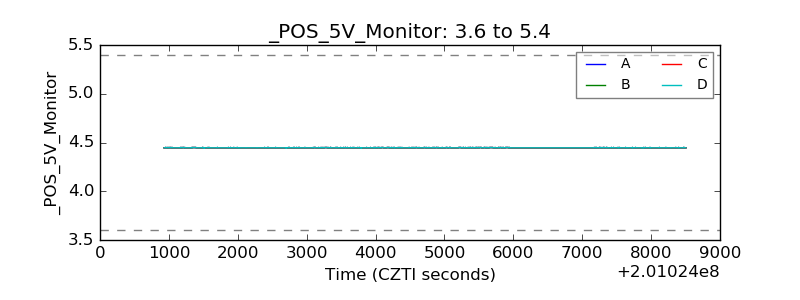 |
| _ROLL_ROT | 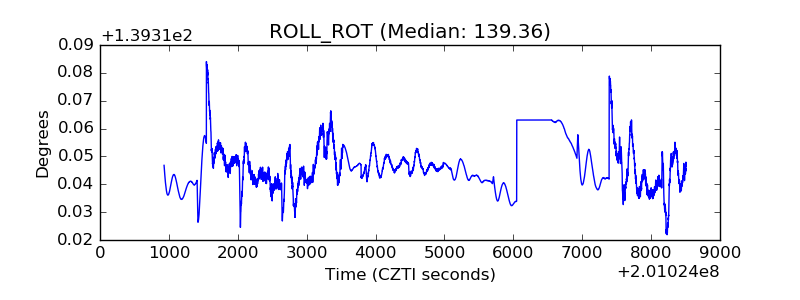 |
| _Roll_DEC | 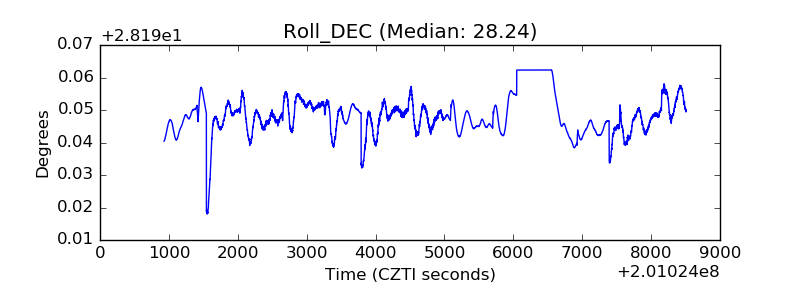 |
| _Roll_RA | 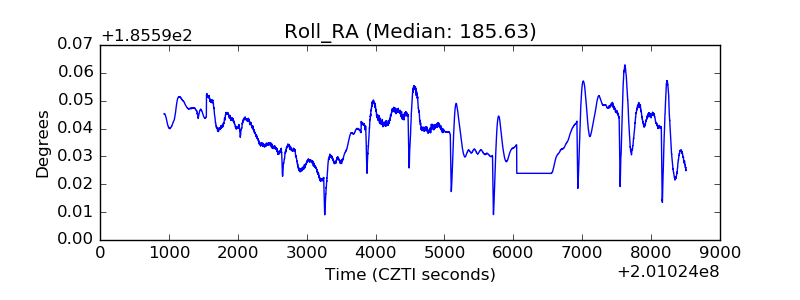 |
| Veto Counter | 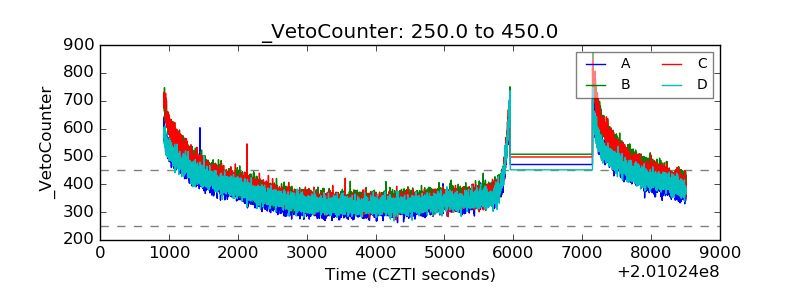 |