| Param | Original file | Final file |
|---|---|---|
| Filename | modeM0/AS1G05_210T01_9000000454_03415cztM0_level2.evt | modeM0/AS1G05_210T01_9000000454_03415cztM0_level2_quad_clean.evt |
| Size (bytes) | 499,633,920 | 75,176,640 |
| Size | 476.5 MB | 71.7 MB |
| Events in quadrant A | 2,947,523 | 467,356 |
| Events in quadrant B | 4,450,202 | 466,891 |
| Events in quadrant C | 4,455,713 | 459,876 |
| Events in quadrant D | 2,858,432 | 450,193 |
| Mode M9 | |||
|---|---|---|---|
| Quadrant | BADHDUFLAG | Total packets | Discarded packets |
| A | 0 | 18 | 0 |
| B | 0 | 18 | 0 |
| C | 0 | 18 | 0 |
| D | 0 | 19 | 0 |
| Mode SS | |||
|---|---|---|---|
| Quadrant | BADHDUFLAG | Total packets | Discarded packets |
| A | 0 | 126 | 0 |
| B | 0 | 126 | 0 |
| C | 0 | 126 | 0 |
| D | 0 | 126 | 0 |
| Mode M0 | |||
|---|---|---|---|
| Quadrant | BADHDUFLAG | Total packets | Discarded packets |
| A | 0 | 12971 | 3 |
| B | 0 | 17337 | 2 |
| C | 0 | 17419 | 2 |
| D | 0 | 12975 | 2 |
| Quadrant | Total seconds | Saturated seconds | Saturation percentage |
|---|---|---|---|
| A | 6188 | 49 | 0.791855% |
| B | 6188 | 96 | 1.551390% |
| C | 6188 | 208 | 3.361345% |
| D | 6188 | 40 | 0.646412% |
Noise dominated data is calculated using 1-second bins in cleaned event files. If a bin has >2000 counts, and if more than 50% of those come from <1% of pixels, then it is considered to be noise-dominated and hence unusable.
| Quadrant | # 1 sec bins | Bins with >0 counts | Bins with >2000 counts | High rate bins dominated by noise | Noise dominated (total time) | Noise dominated (detector-on time) | Marked lightcurve |
|---|---|---|---|---|---|---|---|
| A | 7478 | 6189 | 3 | 3 | 0.04% | 0.05% | 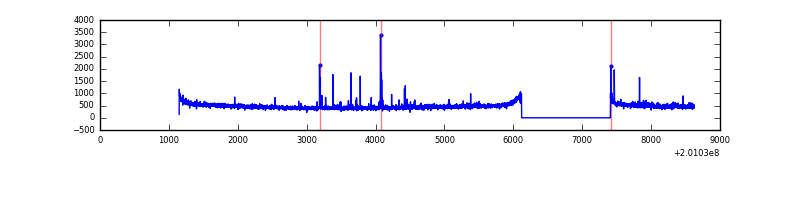 |
| B | 7478 | 6189 | 43 | 43 | 0.58% | 0.69% | 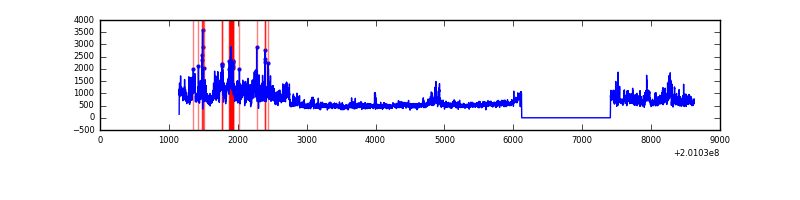 |
| C | 7478 | 6189 | 148 | 148 | 1.98% | 2.39% | 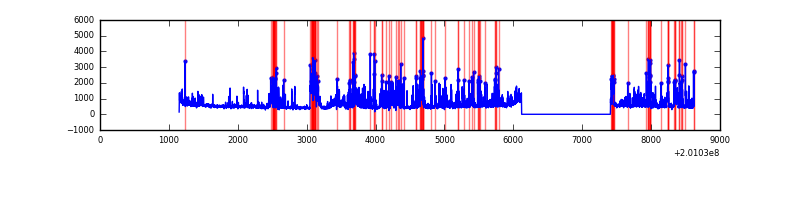 |
| D | 7478 | 6189 | 6 | 6 | 0.08% | 0.10% | 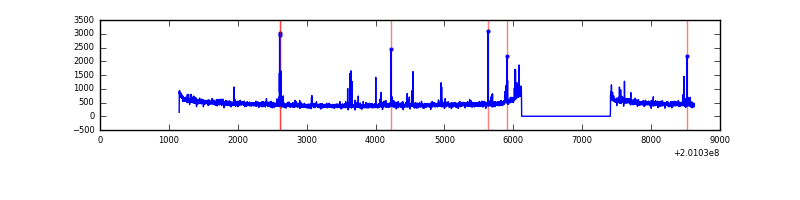 |
Top three noisy pixels from each quadrant. If the there are fewer than three noisy pixels in the level2.evt file, extra rows are filled as -1
| Pixel properties | Quadrant properties | ||||||
|---|---|---|---|---|---|---|---|
| Quadrant | DetID | PixID | Counts | Sigma | Mean | Median | Sigma |
| A | 0 | 118 | 50882 | 333.48 | 742 | 725 | 150.4 |
| A | 8 | 15 | 23039 | 148.36 | 742 | 725 | 150.4 |
| A | 0 | 226 | 12642 | 79.23 | 742 | 725 | 150.4 |
| B | 15 | 204 | 947354 | 6639.05 | 749 | 733 | 142.6 |
| B | 14 | 167 | 497264 | 3482.38 | 749 | 733 | 142.6 |
| B | 7 | 252 | 49186 | 339.82 | 749 | 733 | 142.6 |
| C | 14 | 223 | 662192 | 3957.35 | 721 | 724 | 167.1 |
| C | 8 | 208 | 478081 | 2855.88 | 721 | 724 | 167.1 |
| C | 7 | 220 | 346854 | 2070.79 | 721 | 724 | 167.1 |
| D | 13 | 223 | 43111 | 243.6 | 721 | 701 | 174.1 |
| D | 12 | 246 | 24547 | 136.97 | 721 | 701 | 174.1 |
| D | 2 | 37 | 14622 | 79.96 | 721 | 701 | 174.1 |
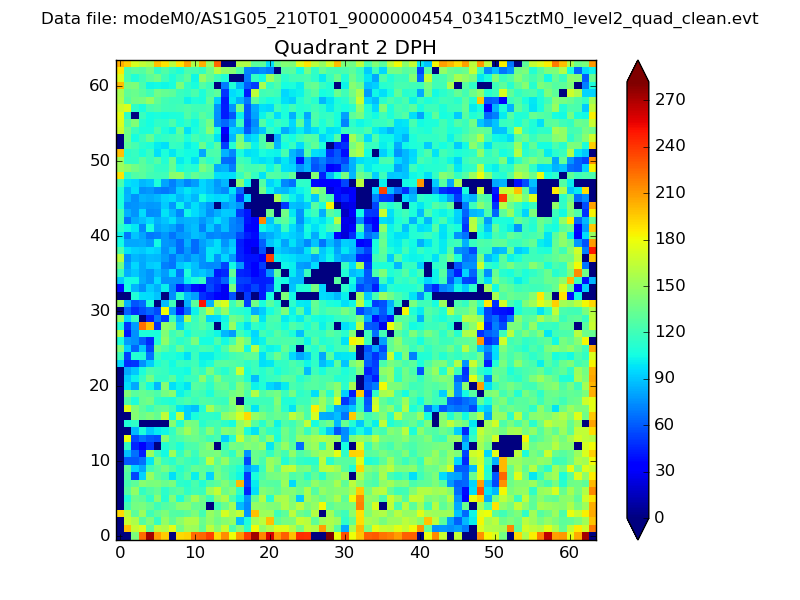
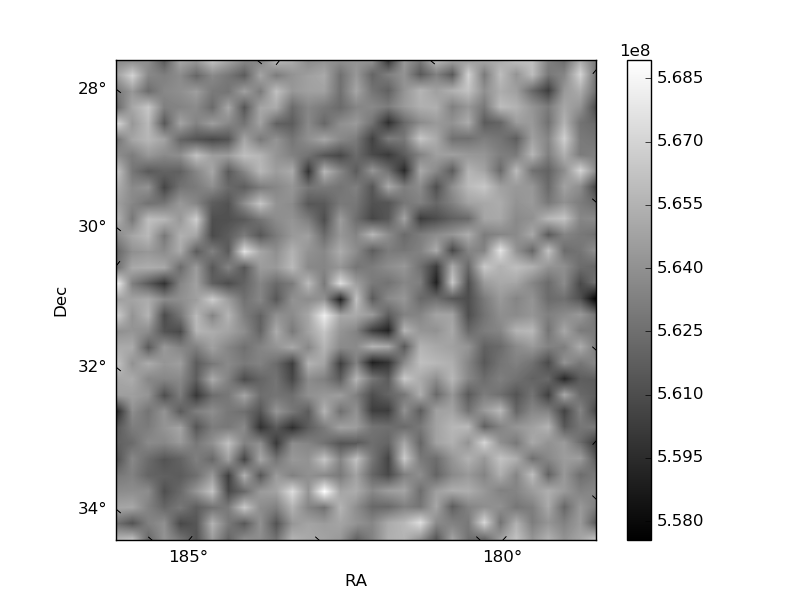
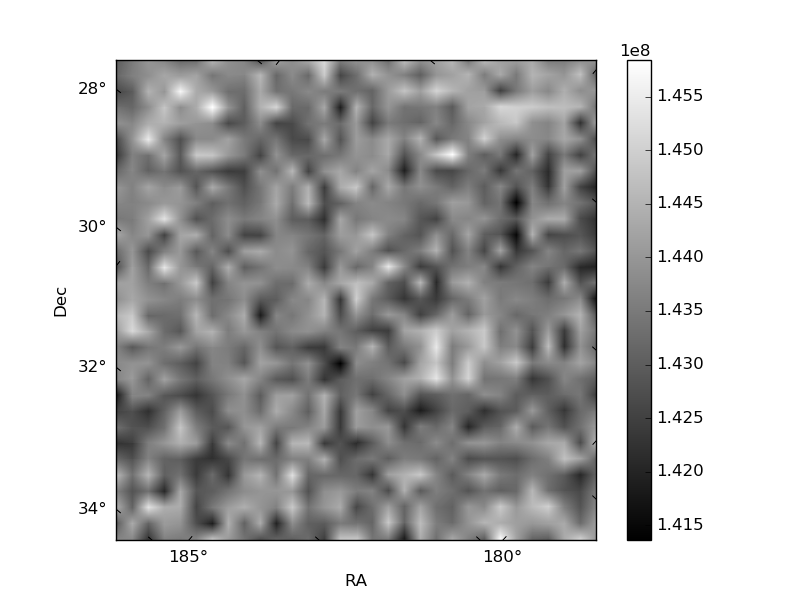
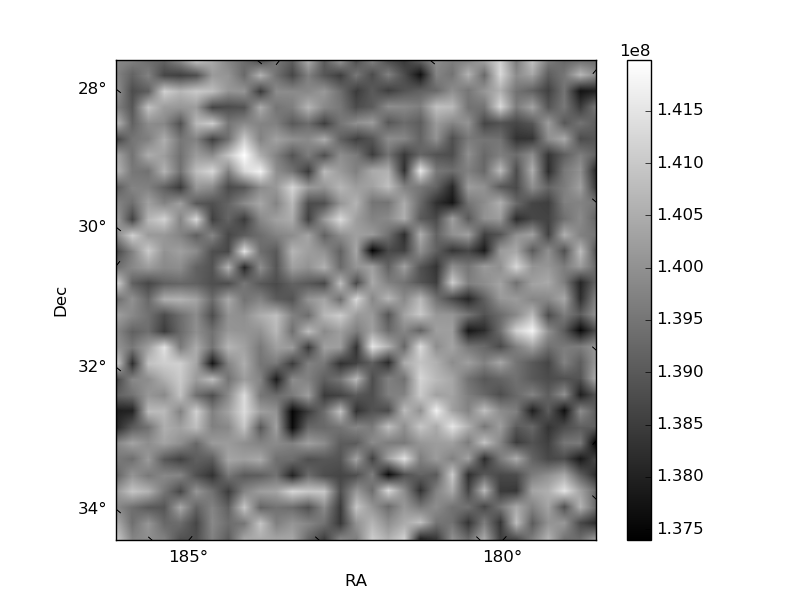
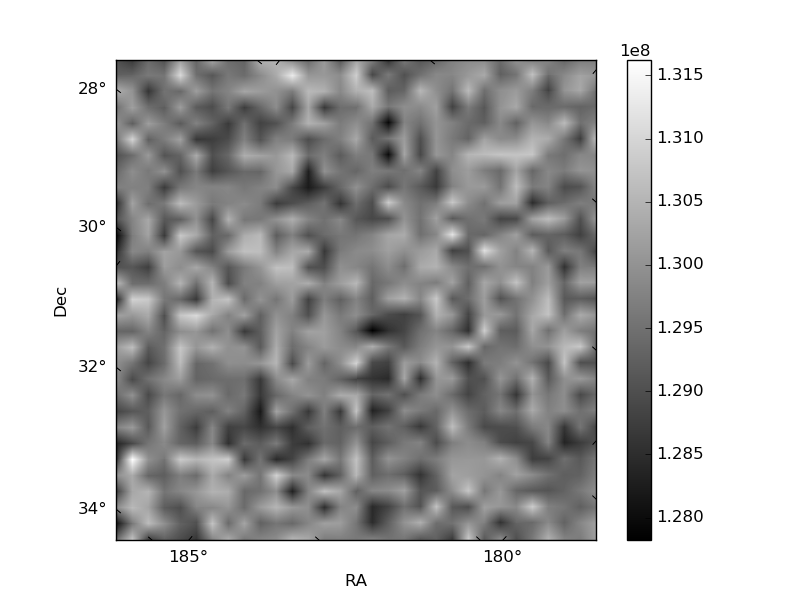
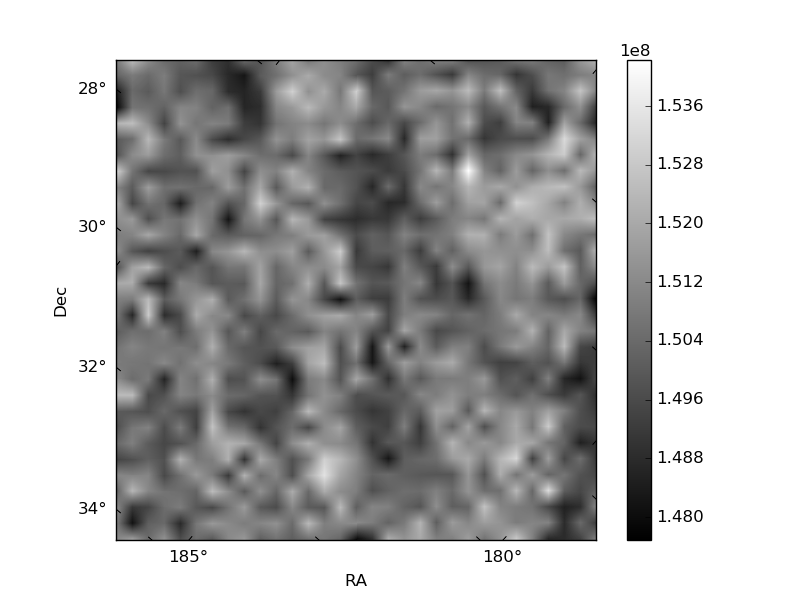
Histogram calculated using DETX and DETY for each event in the final _common_clean file
| Quadrant A | 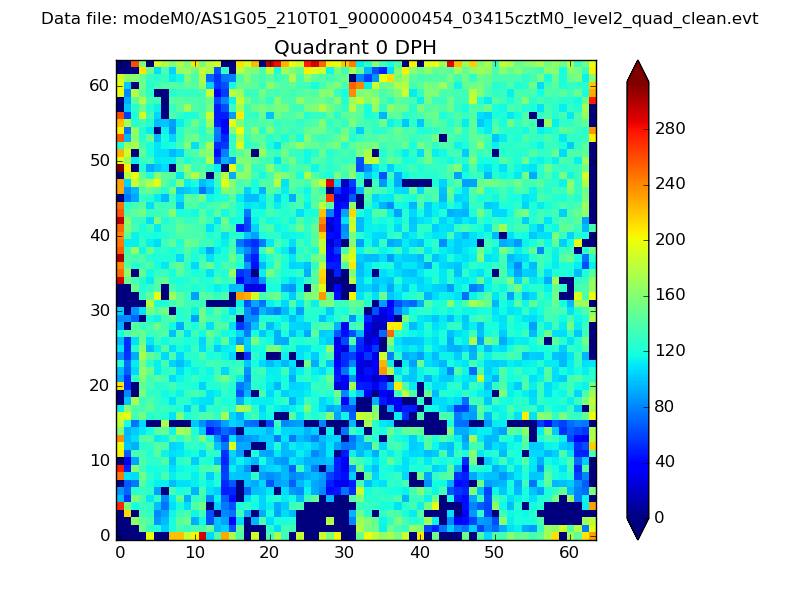 |
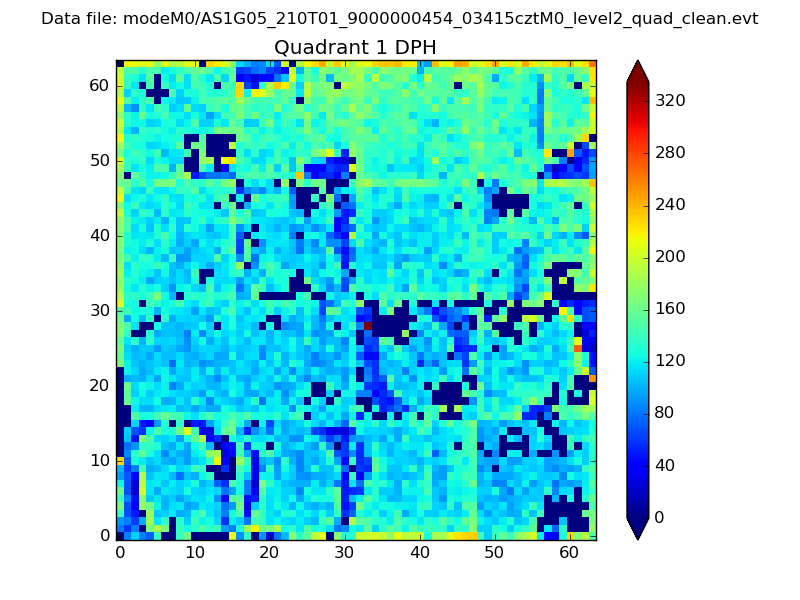 |
Quadrant B |
|---|---|---|---|
| Quadrant D | 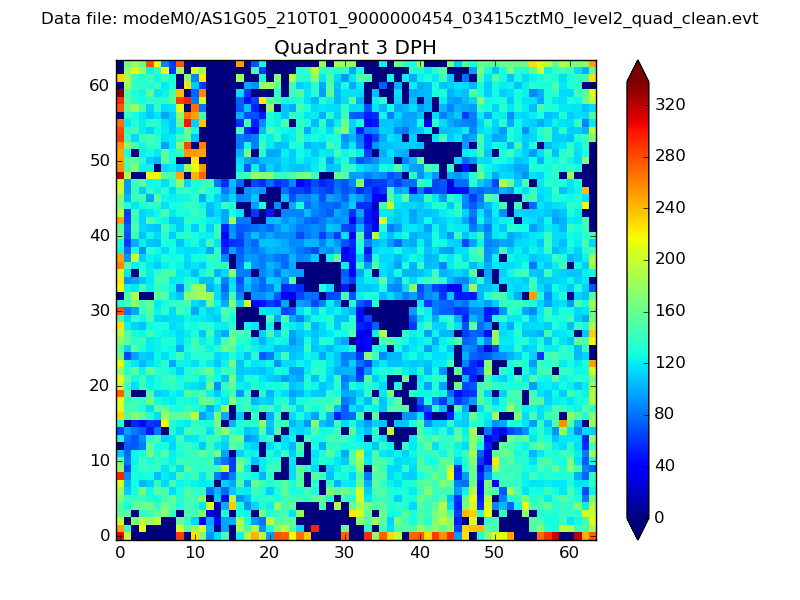 |
 |
Quadrant C |
| Plot type | Count rate plots | Images |
|---|---|---|
| Comparison with Poisson distribution Blue bars denote a histogram of data divided into 1 sec bins. Red curve is a Poisson curve with rate = median count rate of data. |
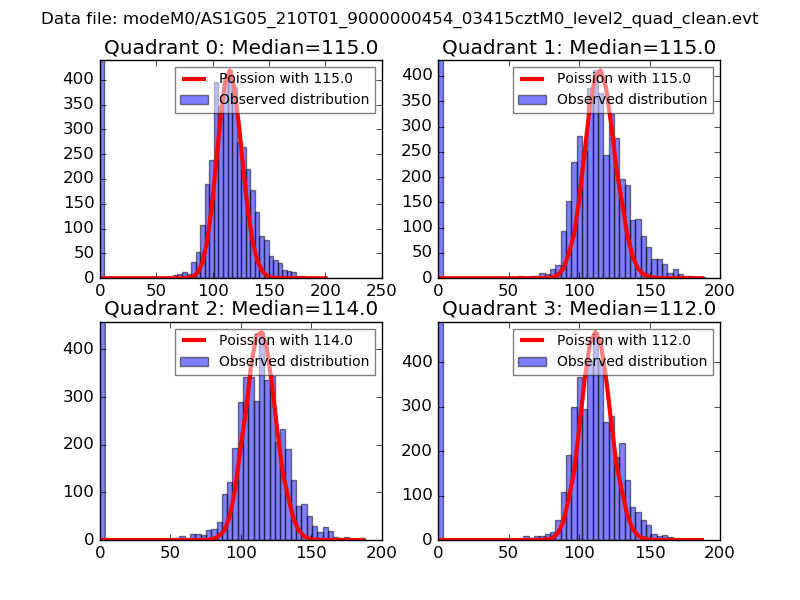 |
 |
| Quadrant-wise count rates Data is divided into 100 sec bins |
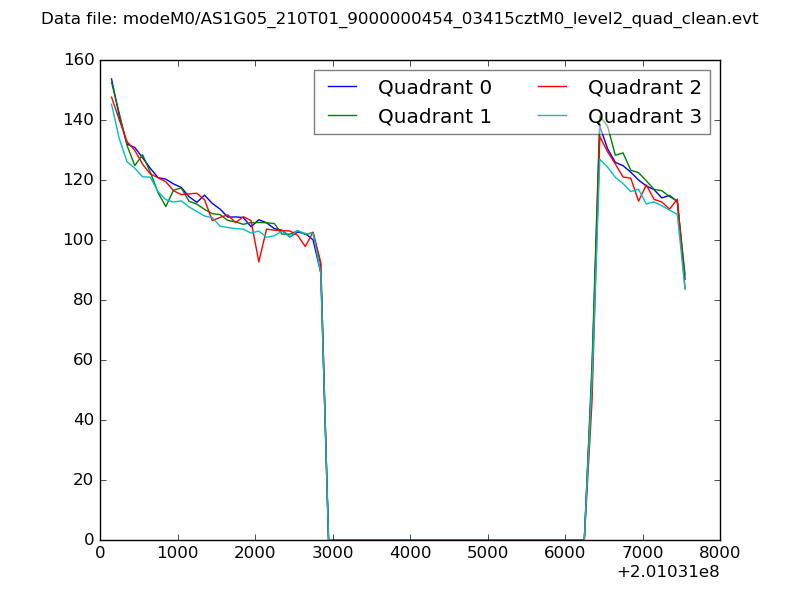 |
|
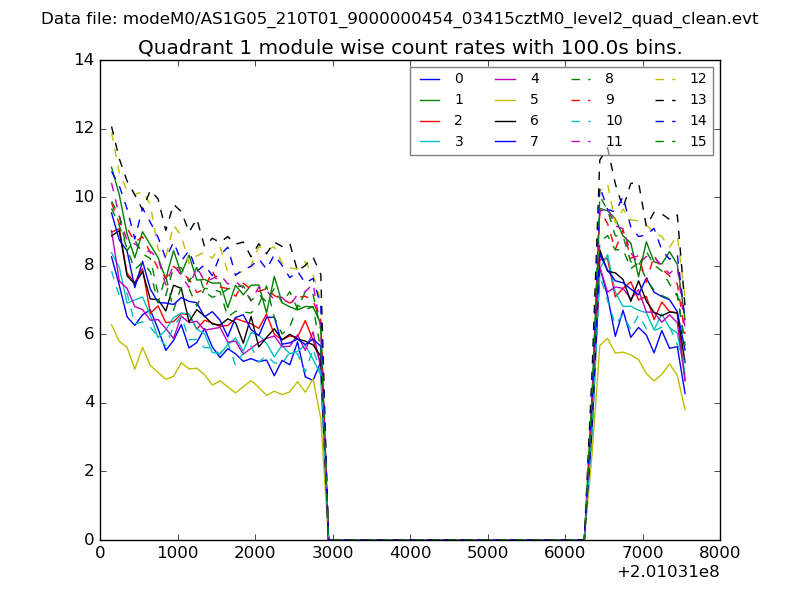
| Module-wise count rates for Quadrant A Data is divided into 100 sec bins |
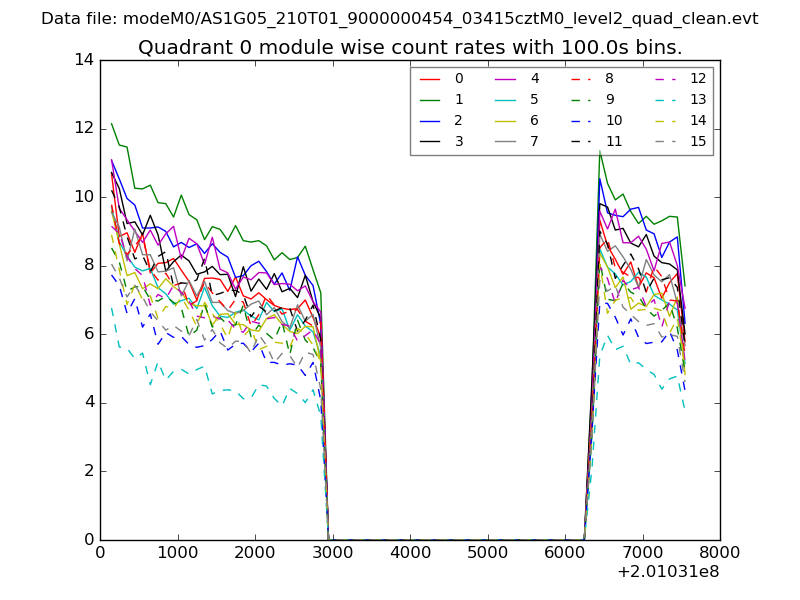 |
 |
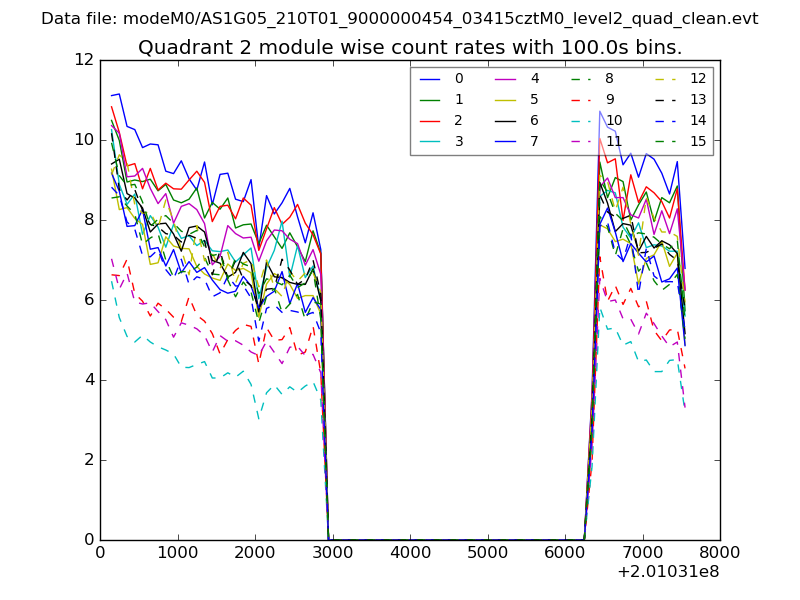
| Module-wise count rates for Quadrant B Data is divided into 100 sec bins |
 |
 |
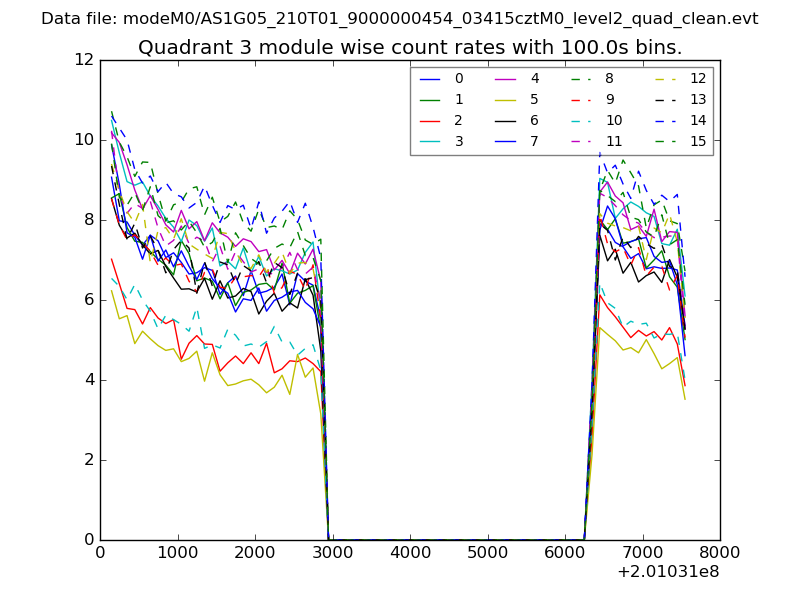
| Module-wise count rates for Quadrant C Data is divided into 100 sec bins |
 |
 |
| Module-wise count rates for Quadrant D Data is divided into 100 sec bins |
 |
 |
| Parameter | Plot |
|---|---|
| CZT HV Monitor | 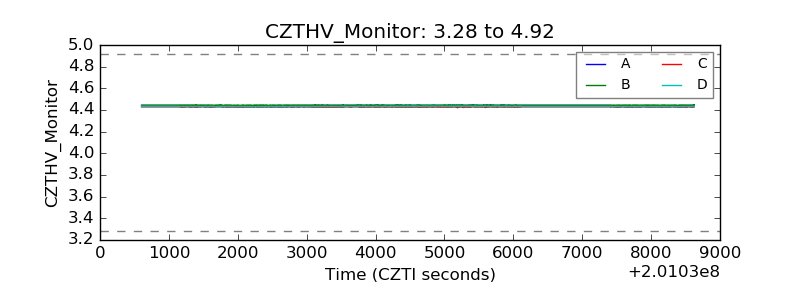 |
| D_VDD | 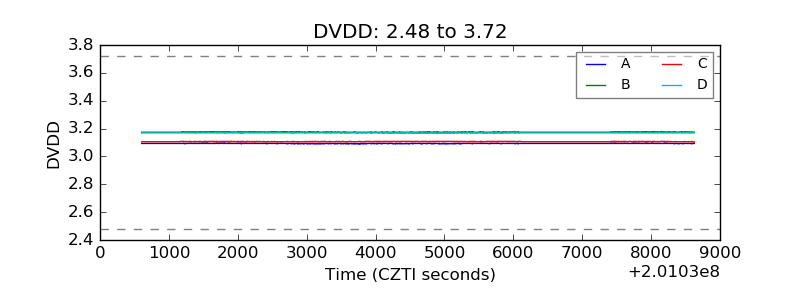 |
| Temperature 1 | 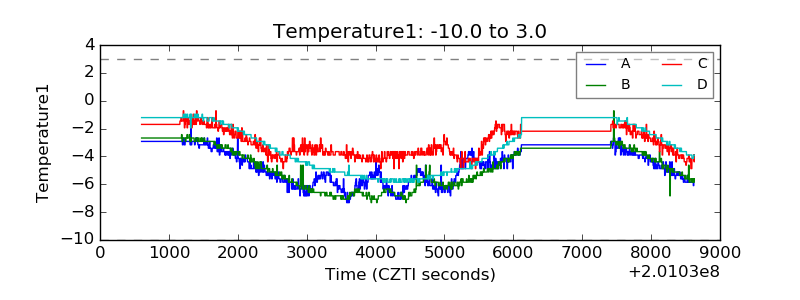 |
| Veto HV Monitor | 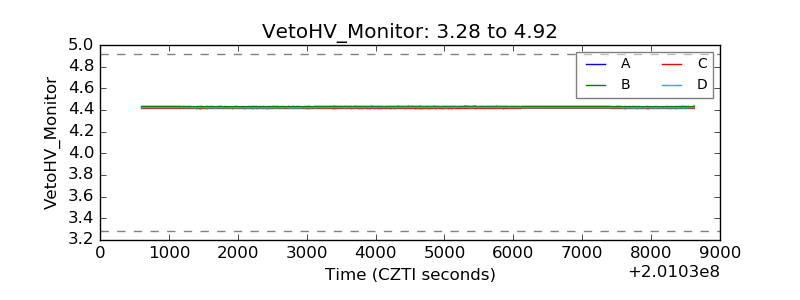 |
| Veto LLD | 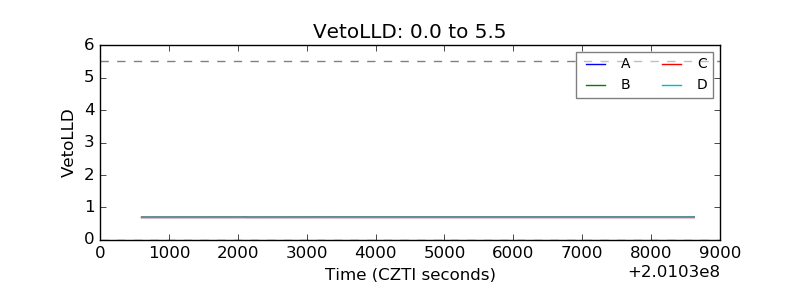 |
| Alpha Counter | 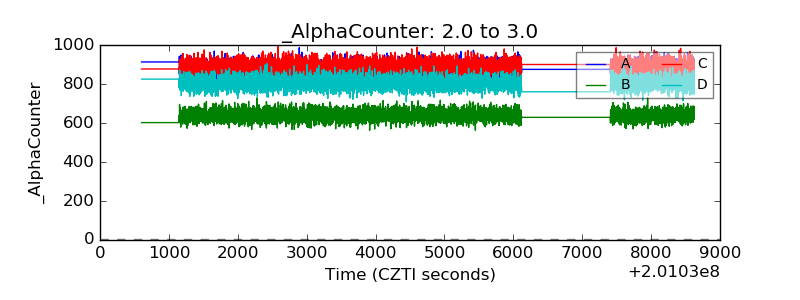 |
| _CPM_Rate | 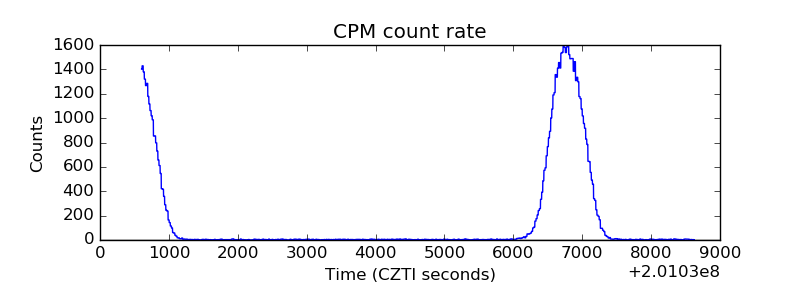 |
| CZT Counter | 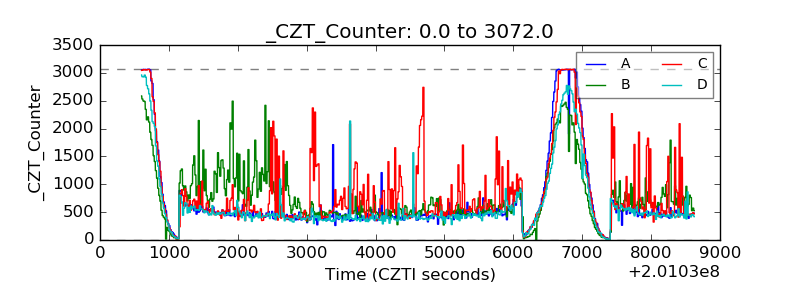 |
| +2.5 Volts monitor | 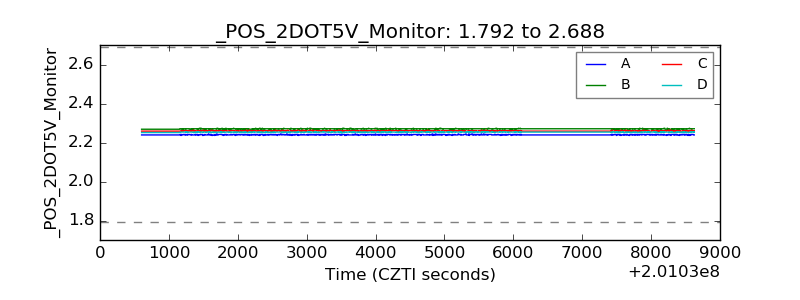 |
| +5 Volts monitor |  |
| _ROLL_ROT | 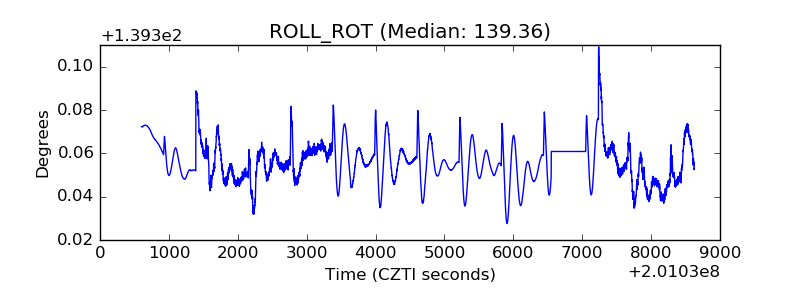 |
| _Roll_DEC | 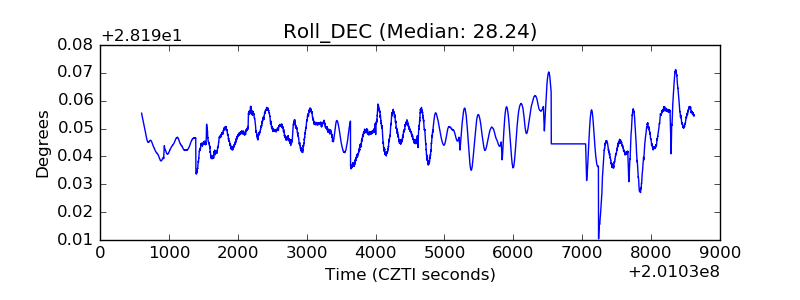 |
| _Roll_RA | 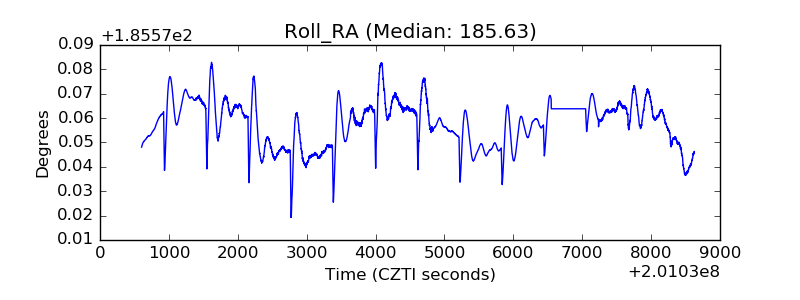 |
| Veto Counter | 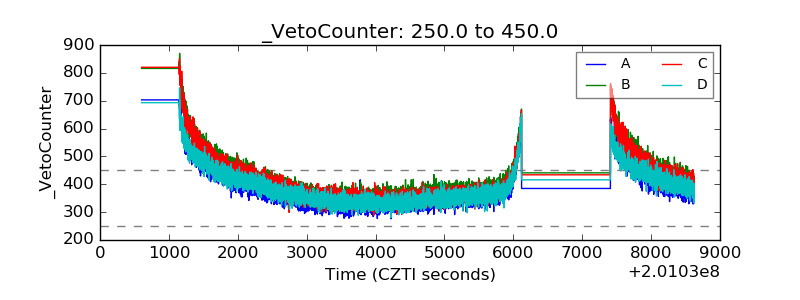 |