| Param | Original file | Final file |
|---|---|---|
| Filename | modeM0/AS1G05_167T01_9000000456cztM0_level2.fits | modeM0/AS1G05_167T01_9000000456cztM0_level2_quad_clean.evt |
| Size (bytes) | 1,926,509,760 | 2,281,026,240 |
| Size | 1.8 GB | 2.1 GB |
| Events in quadrant A | 11,564,990 | 14,320,363 |
| Events in quadrant B | 11,196,062 | 14,318,537 |
| Events in quadrant C | 11,145,174 | 13,243,428 |
| Events in quadrant D | 9,935,192 | 12,711,764 |
| Mode M9 | |||
|---|---|---|---|
| Quadrant | BADHDUFLAG | Total packets | Discarded packets |
| A | 0 | 296 | 0 |
| B | 0 | 296 | 0 |
| C | 0 | 296 | 0 |
| D | 0 | 294 | 0 |
| Mode SS | |||
|---|---|---|---|
| Quadrant | BADHDUFLAG | Total packets | Discarded packets |
| A | 0 | 4302 | 0 |
| B | 0 | 4304 | 0 |
| C | 0 | 4306 | 0 |
| D | 0 | 4312 | 0 |
| Mode M0 | |||
|---|---|---|---|
| Quadrant | BADHDUFLAG | Total packets | Discarded packets |
| A | 0 | 451182 | 0 |
| B | 0 | 480056 | 0 |
| C | 0 | 552599 | 0 |
| D | 0 | 450414 | 0 |
| Quadrant | Total seconds | Saturated seconds | Saturation percentage |
|---|---|---|---|
| A | 211606 | 2847 | 1.345425% |
| B | 211591 | 3341 | 1.578990% |
| C | 211608 | 13235 | 6.254489% |
| D | 211609 | 2598 | 1.227736% |
Noise dominated data is calculated using 1-second bins in cleaned event files. If a bin has >2000 counts, and if more than 50% of those come from <1% of pixels, then it is considered to be noise-dominated and hence unusable.
| Quadrant | # 1 sec bins | Bins with >0 counts | Bins with >2000 counts | High rate bins dominated by noise | Noise dominated (total time) | Noise dominated (detector-on time) | Marked lightcurve |
|---|---|---|---|---|---|---|---|
| A | 246212 | 211836 | 0 | 0 | 0.00% | 0.00% | 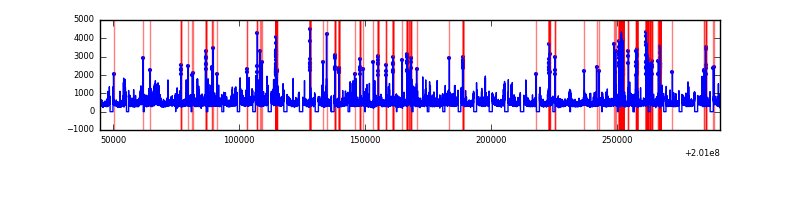 |
| B | 246212 | 211837 | 0 | 0 | 0.00% | 0.00% | 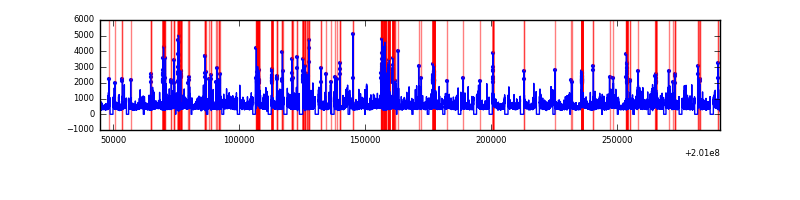 |
| C | 246212 | 211462 | 0 | 0 | 0.00% | 0.00% | 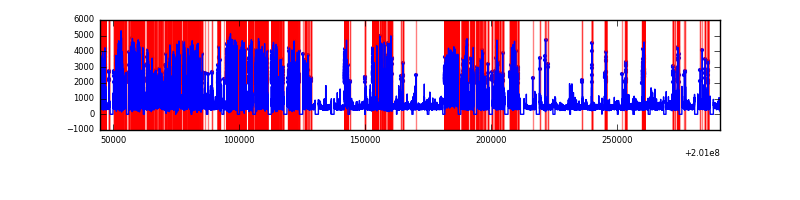 |
| D | 246212 | 211851 | 0 | 0 | 0.00% | 0.00% | 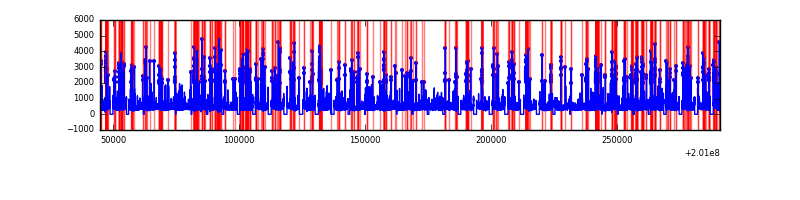 |
Top three noisy pixels from each quadrant. If the there are fewer than three noisy pixels in the level2.evt file, extra rows are filled as -1
| Pixel properties | Quadrant properties | ||||||
|---|---|---|---|---|---|---|---|
| Quadrant | DetID | PixID | Counts | Sigma | Mean | Median | Sigma |
| A | 14 | 188 | 11560 | 11.24 | 3003 | 2787 | 780.8 |
| A | 0 | 29 | 11421 | 11.06 | 3003 | 2787 | 780.8 |
| A | 7 | 110 | 10146 | 9.42 | 3003 | 2787 | 780.8 |
| B | 2 | 9 | 9799 | 11.77 | 2953 | 2804 | 594.2 |
| B | 12 | 226 | 8678 | 9.88 | 2953 | 2804 | 594.2 |
| B | 14 | 254 | 7703 | 8.24 | 2953 | 2804 | 594.2 |
| C | 1 | 81 | 8597 | 7.49 | 2950 | 2729 | 782.9 |
| C | 1 | 80 | 8541 | 7.42 | 2950 | 2729 | 782.9 |
| C | 9 | 188 | 7785 | 6.46 | 2950 | 2729 | 782.9 |
| D | 1 | 19 | 7558 | 6.63 | 2831 | 2566 | 753.2 |
| D | 3 | 14 | 7422 | 6.45 | 2831 | 2566 | 753.2 |
| D | 6 | 83 | 7281 | 6.26 | 2831 | 2566 | 753.2 |
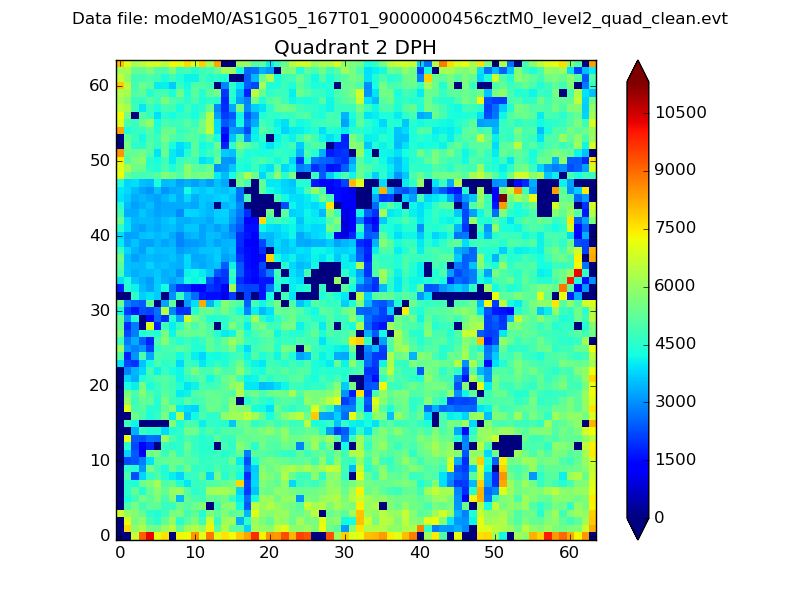
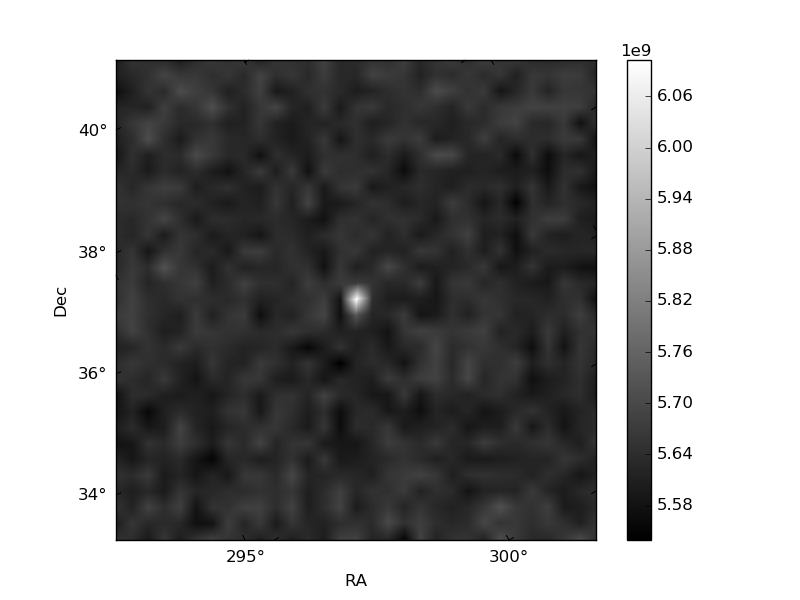
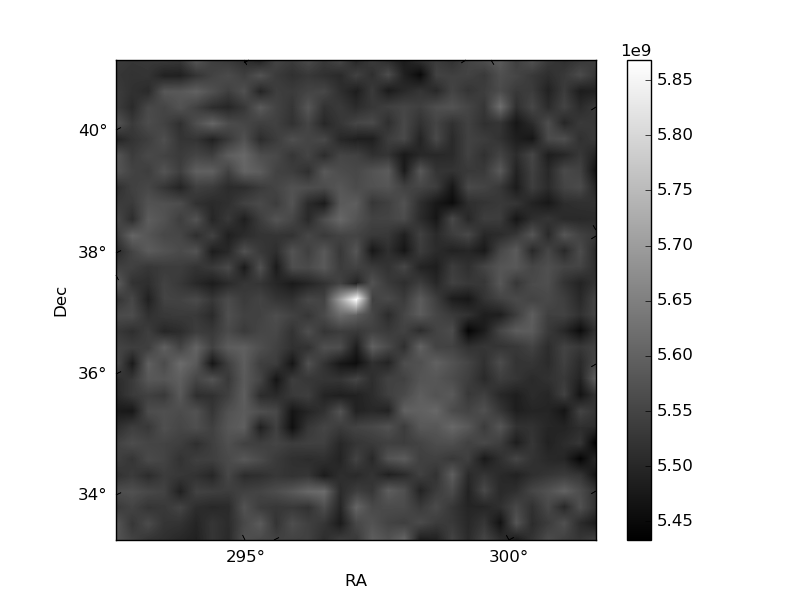
Histogram calculated using DETX and DETY for each event in the final _common_clean file
| Quadrant A | 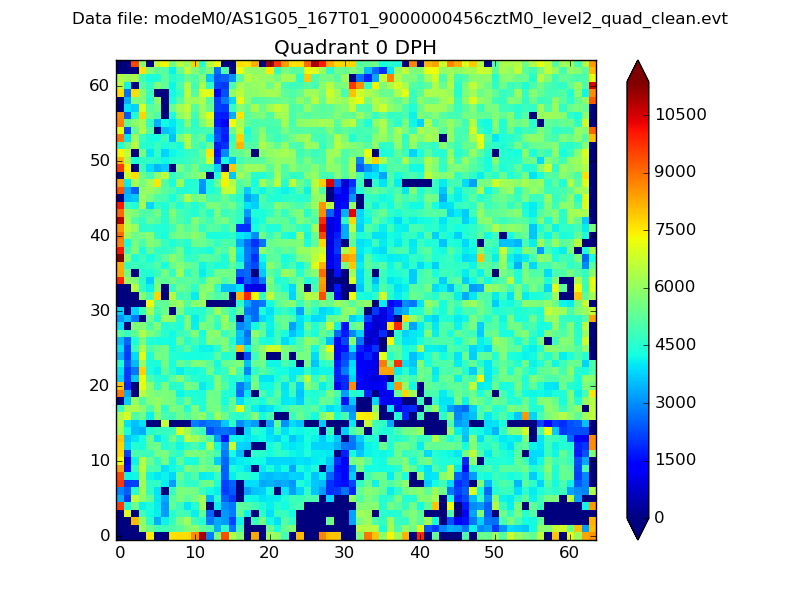 |
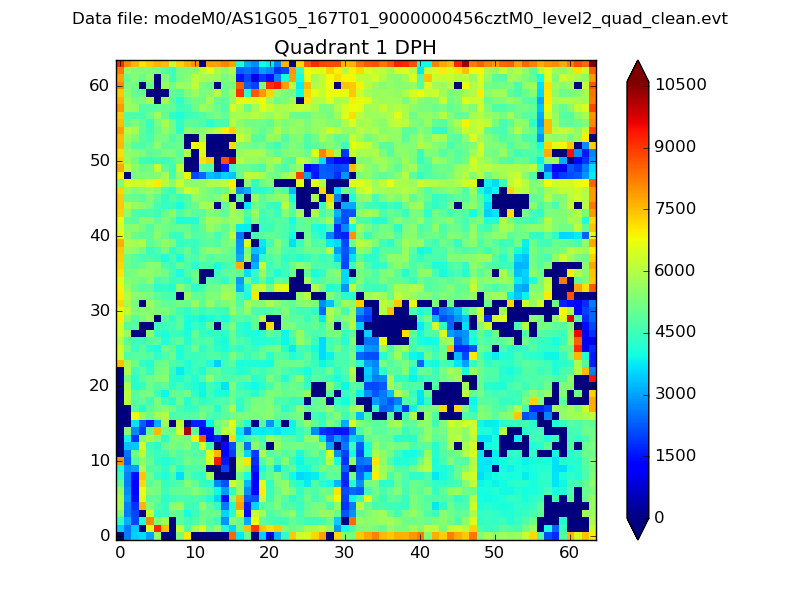 |
Quadrant B |
|---|---|---|---|
| Quadrant D | 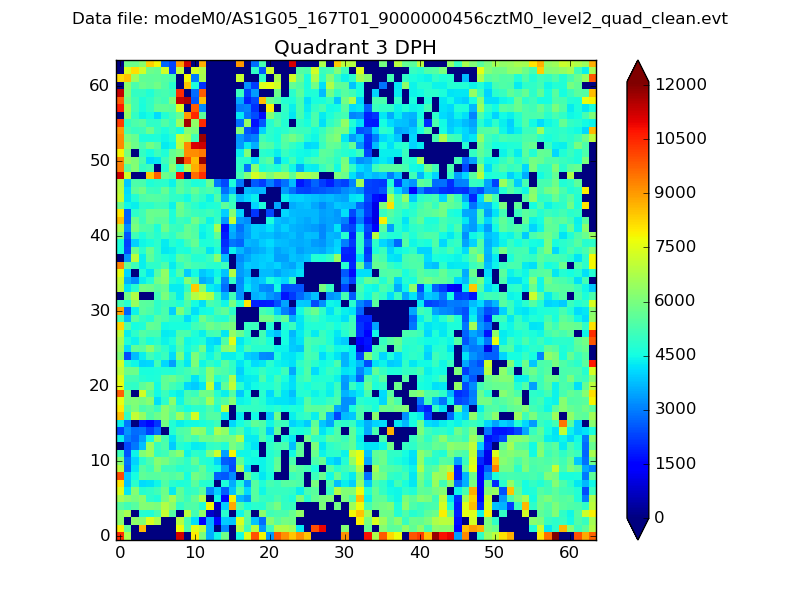 |
 |
Quadrant C |
| Plot type | Count rate plots | Images |
|---|---|---|
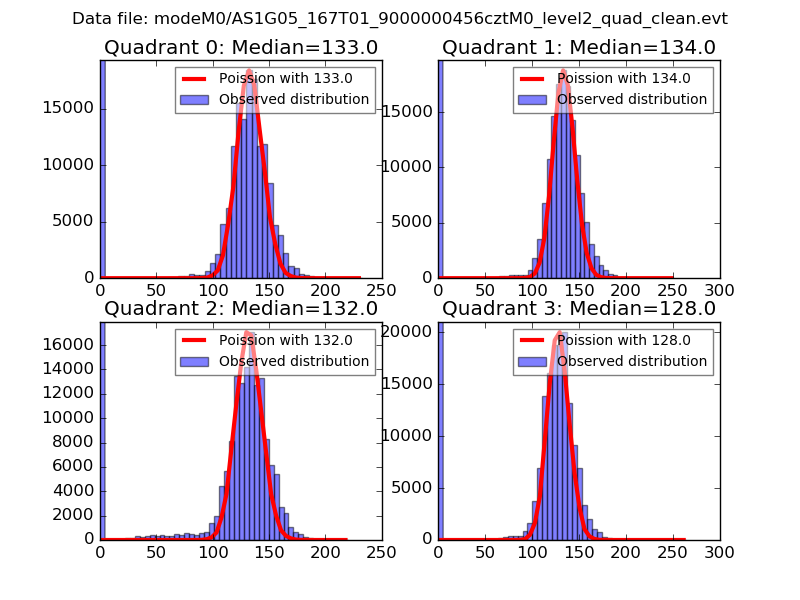
| Comparison with Poisson distribution Blue bars denote a histogram of data divided into 1 sec bins. Red curve is a Poisson curve with rate = median count rate of data. |
 |
 |
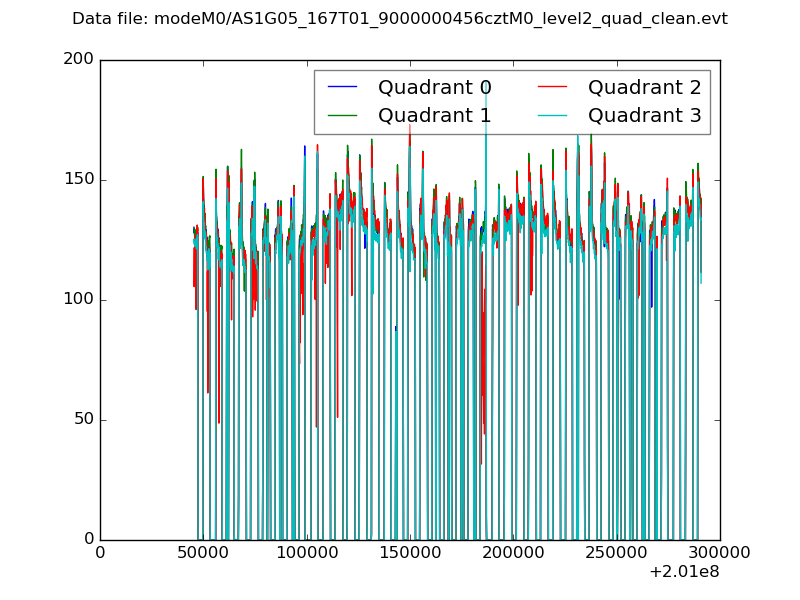
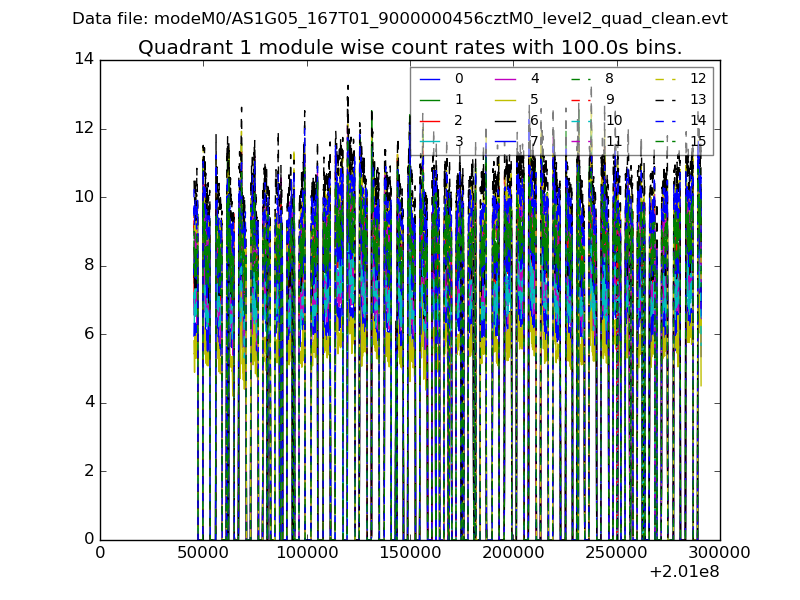
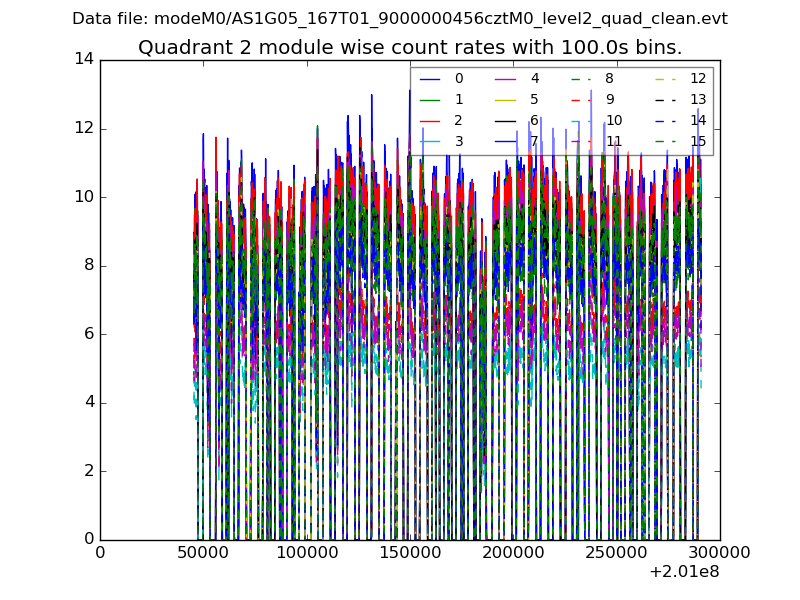
| Quadrant-wise count rates Data is divided into 100 sec bins |
 |
|
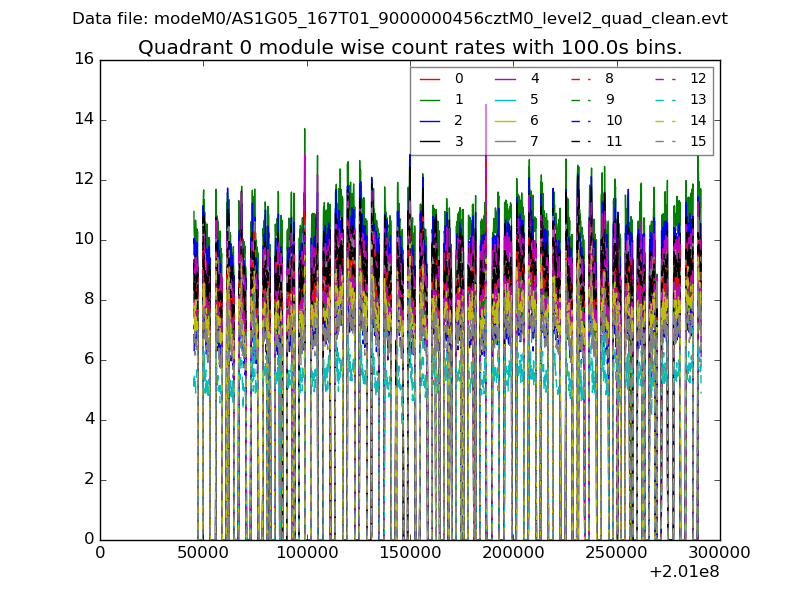
| Module-wise count rates for Quadrant A Data is divided into 100 sec bins |
 |
 |
| Module-wise count rates for Quadrant B Data is divided into 100 sec bins |
 |
 |
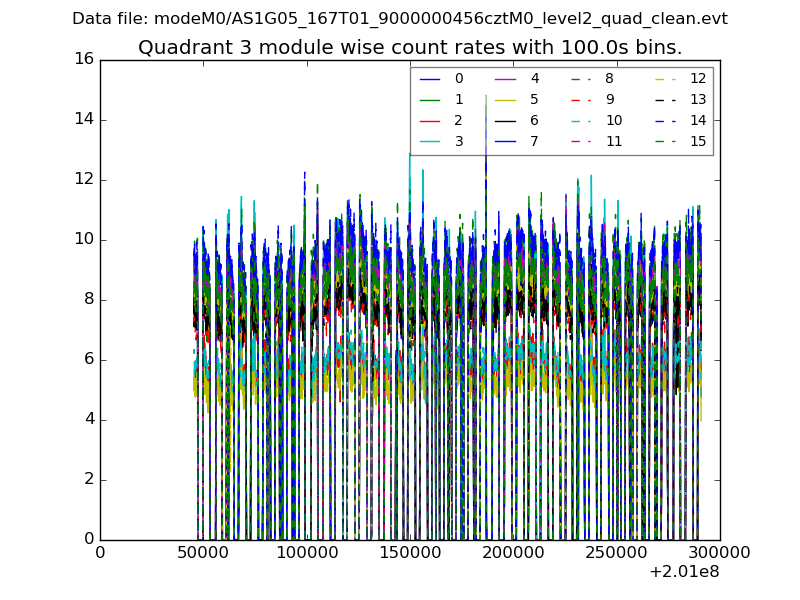
| Module-wise count rates for Quadrant C Data is divided into 100 sec bins |
 |
 |
| Module-wise count rates for Quadrant D Data is divided into 100 sec bins |
 |
 |
| Parameter | Plot |
|---|---|
| CZT HV Monitor | 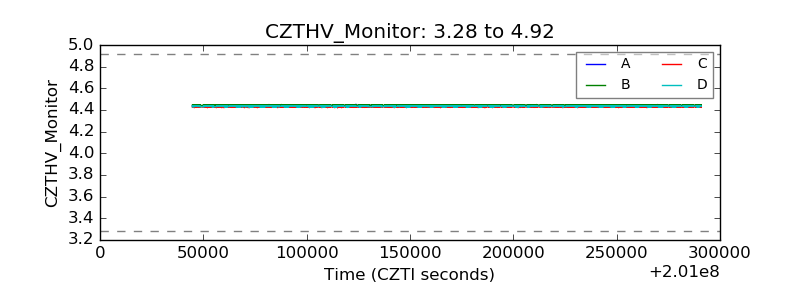 |
| D_VDD | 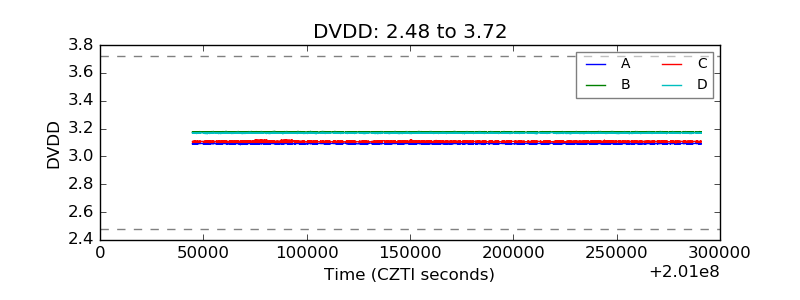 |
| Temperature 1 | 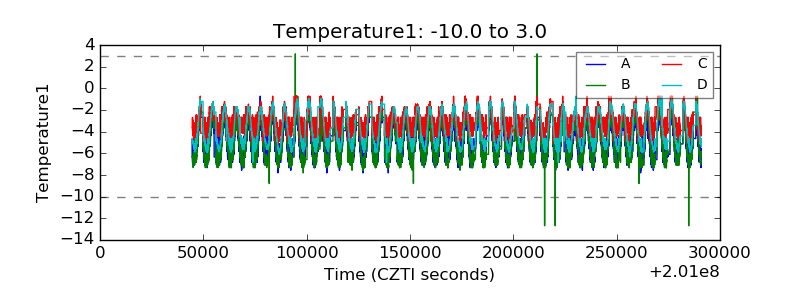 |
| Veto HV Monitor | 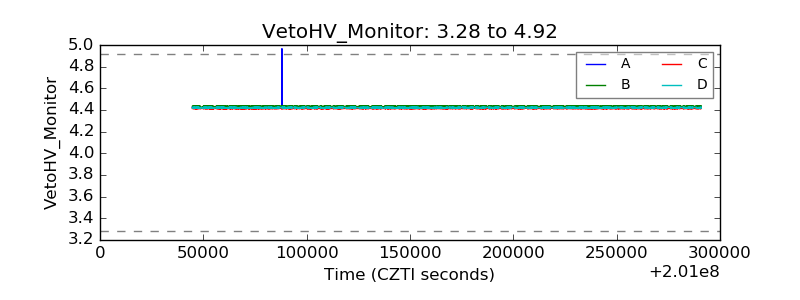 |
| Veto LLD | 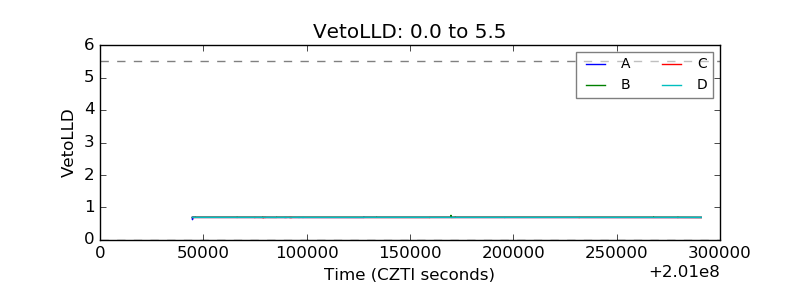 |
| Alpha Counter | 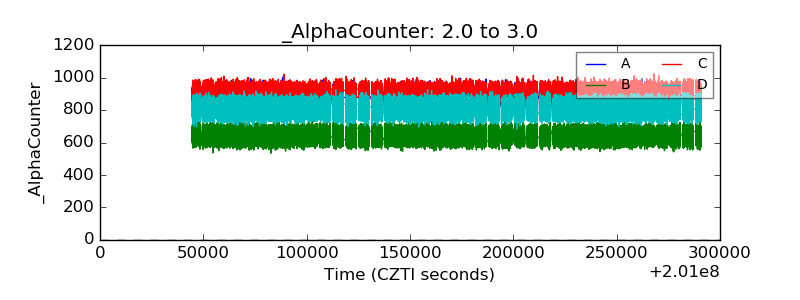 |
| _CPM_Rate | 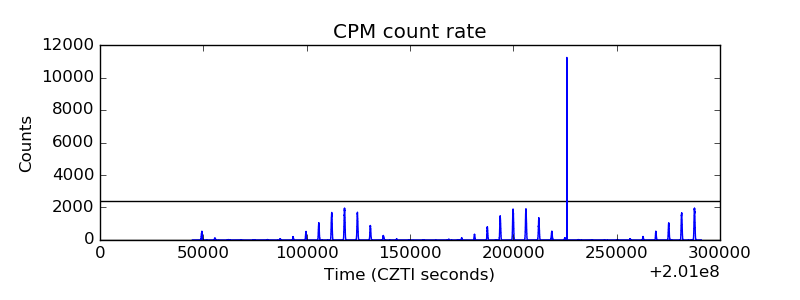 |
| CZT Counter | 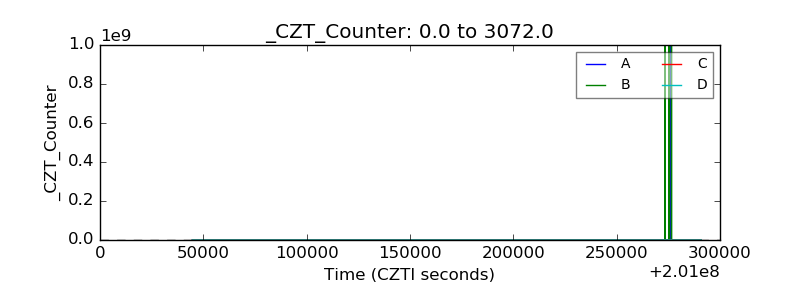 |
| +2.5 Volts monitor | 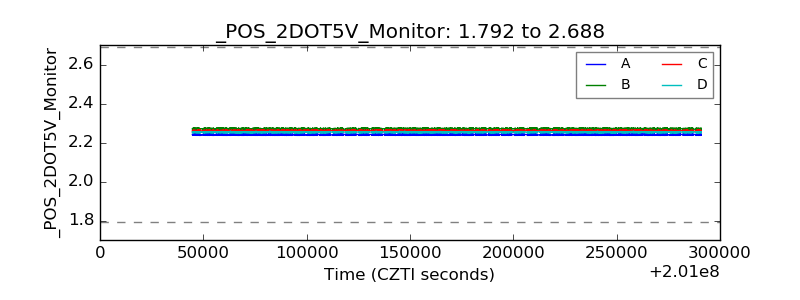 |
| +5 Volts monitor | 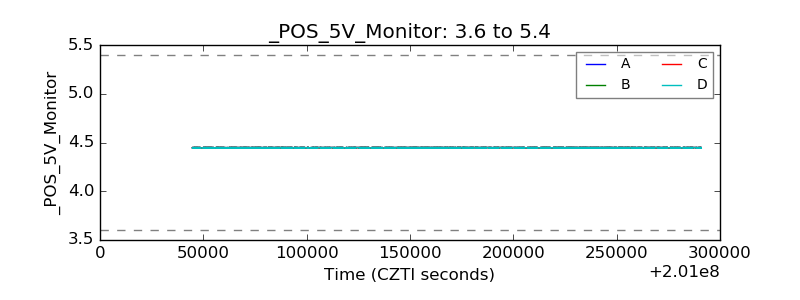 |
| _ROLL_ROT | 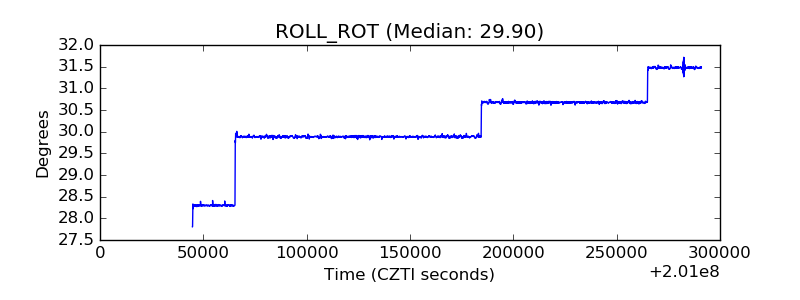 |
| _Roll_DEC | 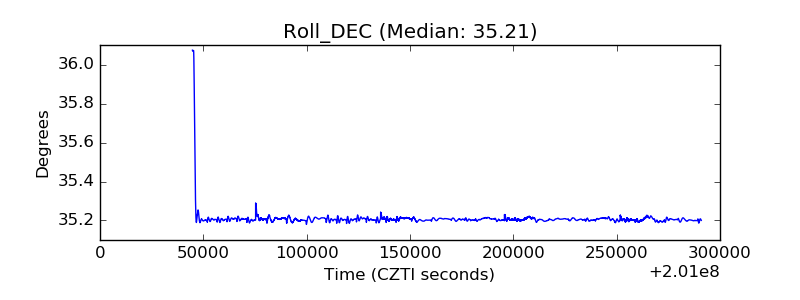 |
| _Roll_RA | 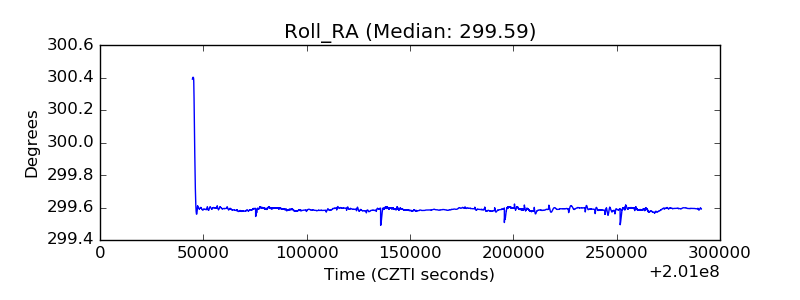 |
| Veto Counter | 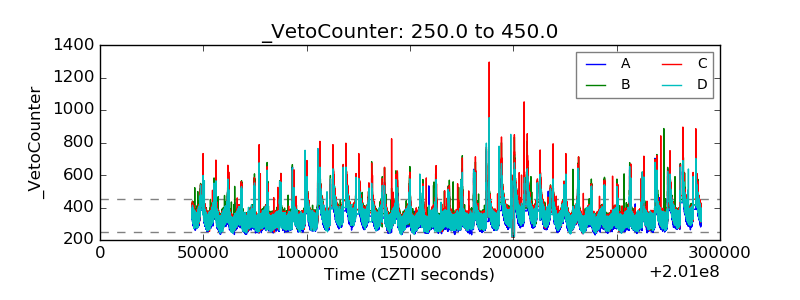 |