| Param | Original file | Final file |
|---|---|---|
| Filename | modeM0/AS1G05_167T01_9000000456_03418cztM0_level2.evt | modeM0/AS1G05_167T01_9000000456_03418cztM0_level2_quad_clean.evt |
| Size (bytes) | 528,033,600 | 87,655,680 |
| Size | 503.6 MB | 83.6 MB |
| Events in quadrant A | 3,177,093 | 559,871 |
| Events in quadrant B | 3,429,633 | 560,912 |
| Events in quadrant C | 5,471,106 | 525,035 |
| Events in quadrant D | 3,454,131 | 536,283 |
| Mode M9 | |||
|---|---|---|---|
| Quadrant | BADHDUFLAG | Total packets | Discarded packets |
| A | 0 | 14 | 0 |
| B | 0 | 14 | 0 |
| C | 0 | 14 | 0 |
| D | 0 | 15 | 0 |
| Mode SS | |||
|---|---|---|---|
| Quadrant | BADHDUFLAG | Total packets | Discarded packets |
| A | 0 | 138 | 0 |
| B | 0 | 138 | 0 |
| C | 0 | 138 | 0 |
| D | 0 | 138 | 0 |
| Mode M0 | |||
|---|---|---|---|
| Quadrant | BADHDUFLAG | Total packets | Discarded packets |
| A | 0 | 14251 | 3 |
| B | 0 | 14771 | 2 |
| C | 0 | 20815 | 2 |
| D | 0 | 15107 | 2 |
| Quadrant | Total seconds | Saturated seconds | Saturation percentage |
|---|---|---|---|
| A | 6771 | 24 | 0.354453% |
| B | 6771 | 45 | 0.664599% |
| C | 6771 | 692 | 10.220056% |
| D | 6771 | 75 | 1.107665% |
Noise dominated data is calculated using 1-second bins in cleaned event files. If a bin has >2000 counts, and if more than 50% of those come from <1% of pixels, then it is considered to be noise-dominated and hence unusable.
| Quadrant | # 1 sec bins | Bins with >0 counts | Bins with >2000 counts | High rate bins dominated by noise | Noise dominated (total time) | Noise dominated (detector-on time) | Marked lightcurve |
|---|---|---|---|---|---|---|---|
| A | 7656 | 6772 | 1 | 1 | 0.01% | 0.01% |  |
| B | 7656 | 6772 | 4 | 4 | 0.05% | 0.06% |  |
| C | 7655 | 6771 | 472 | 472 | 6.17% | 6.97% |  |
| D | 7656 | 6772 | 46 | 46 | 0.60% | 0.68% |  |
Top three noisy pixels from each quadrant. If the there are fewer than three noisy pixels in the level2.evt file, extra rows are filled as -1
| Pixel properties | Quadrant properties | ||||||
|---|---|---|---|---|---|---|---|
| Quadrant | DetID | PixID | Counts | Sigma | Mean | Median | Sigma |
| A | 8 | 15 | 102387 | 623.29 | 792 | 775 | 163.0 |
| A | 0 | 118 | 11577 | 66.26 | 792 | 775 | 163.0 |
| A | 0 | 226 | 9191 | 51.62 | 792 | 775 | 163.0 |
| B | 5 | 70 | 97627 | 618.6 | 809 | 792 | 156.5 |
| B | 15 | 204 | 88733 | 561.79 | 809 | 792 | 156.5 |
| B | 14 | 167 | 67117 | 423.7 | 809 | 792 | 156.5 |
| C | 7 | 220 | 1451142 | 8306.04 | 745 | 751 | 174.6 |
| C | 14 | 223 | 966788 | 5532.26 | 745 | 751 | 174.6 |
| C | 10 | 19 | 66304 | 375.41 | 745 | 751 | 174.6 |
| D | 13 | 223 | 250908 | 1362.95 | 762 | 742 | 183.5 |
| D | 2 | 37 | 146369 | 793.4 | 762 | 742 | 183.5 |
| D | 7 | 46 | 59961 | 322.64 | 762 | 742 | 183.5 |
Histogram calculated using DETX and DETY for each event in the final _common_clean file
| Quadrant A | 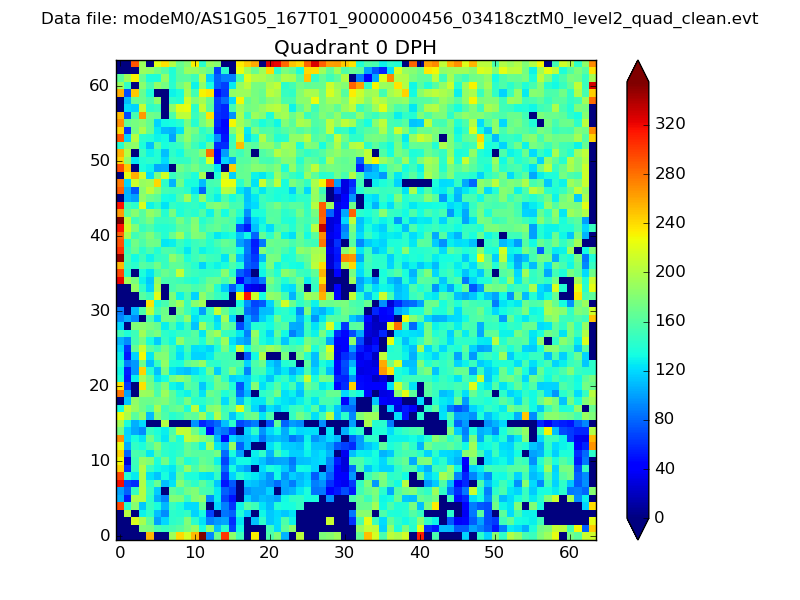 |
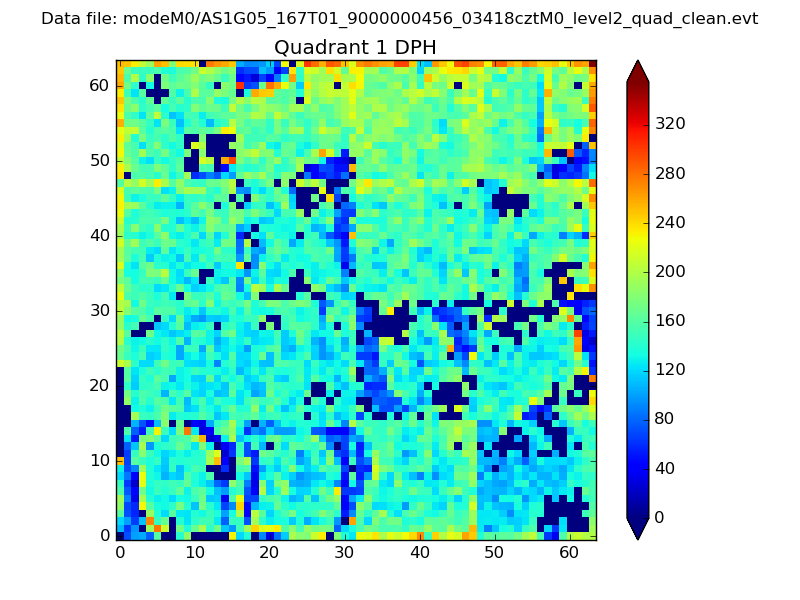 |
Quadrant B |
|---|---|---|---|
| Quadrant D |  |
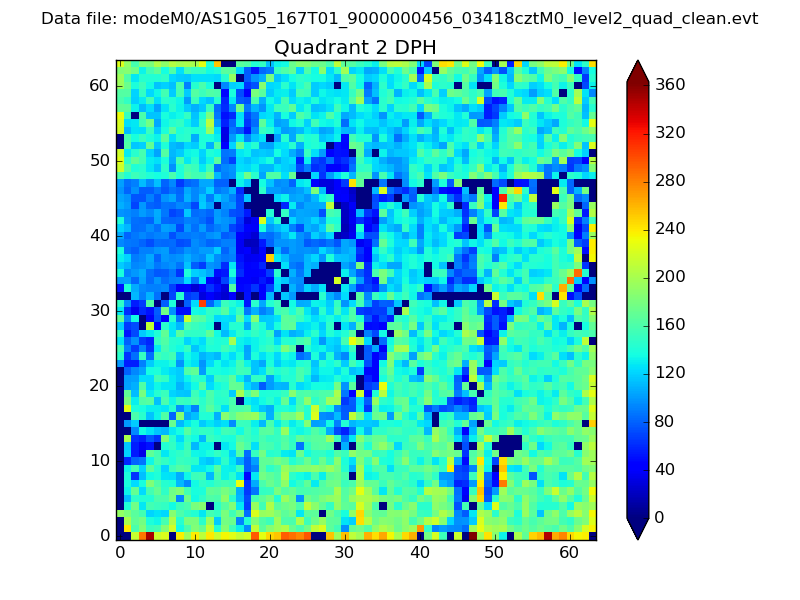 |
Quadrant C |
| Plot type | Count rate plots | Images |
|---|---|---|
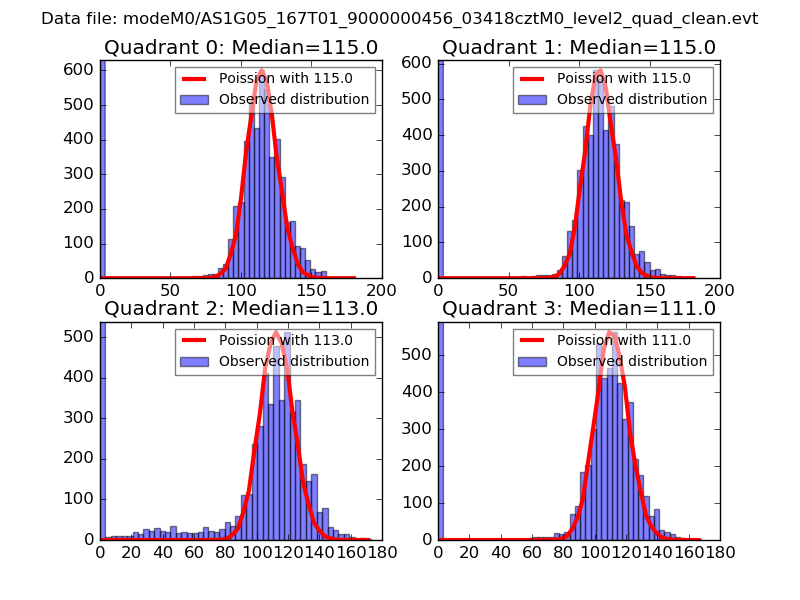
| Comparison with Poisson distribution Blue bars denote a histogram of data divided into 1 sec bins. Red curve is a Poisson curve with rate = median count rate of data. |
 |
 |
| Quadrant-wise count rates Data is divided into 100 sec bins |
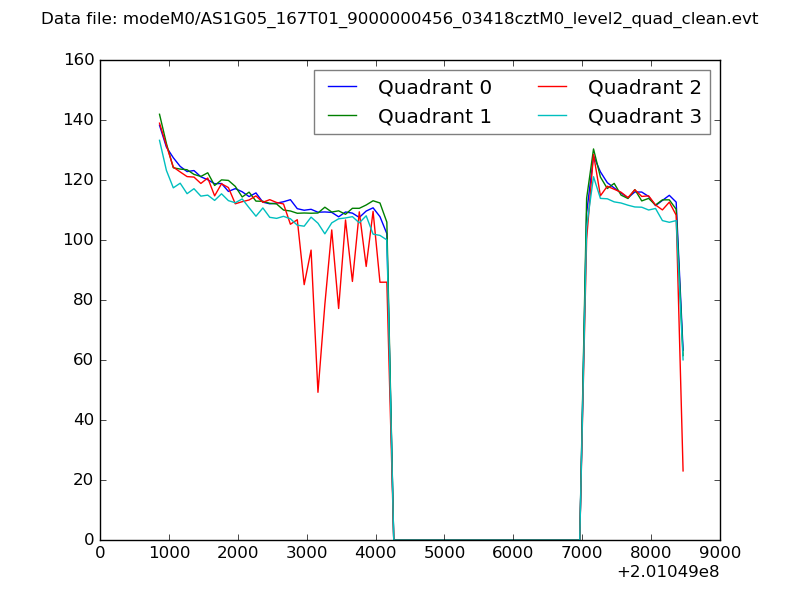 |
|
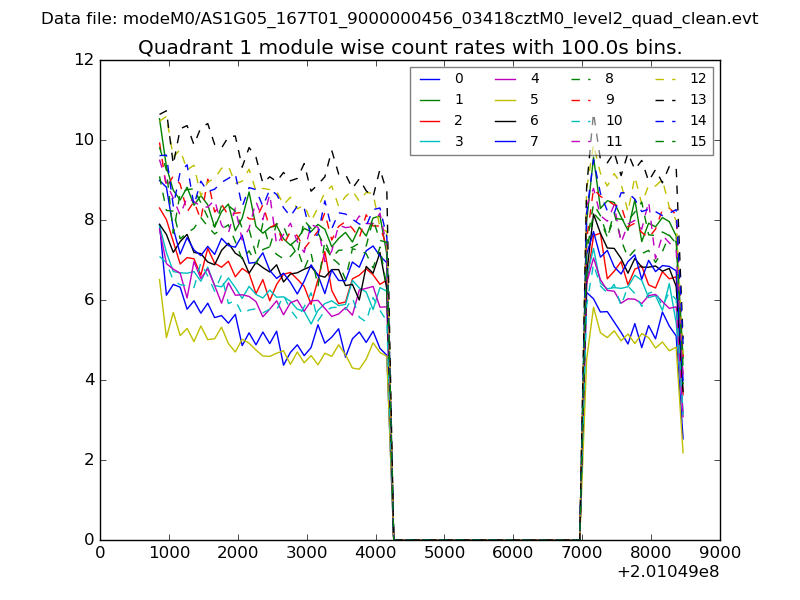
| Module-wise count rates for Quadrant A Data is divided into 100 sec bins |
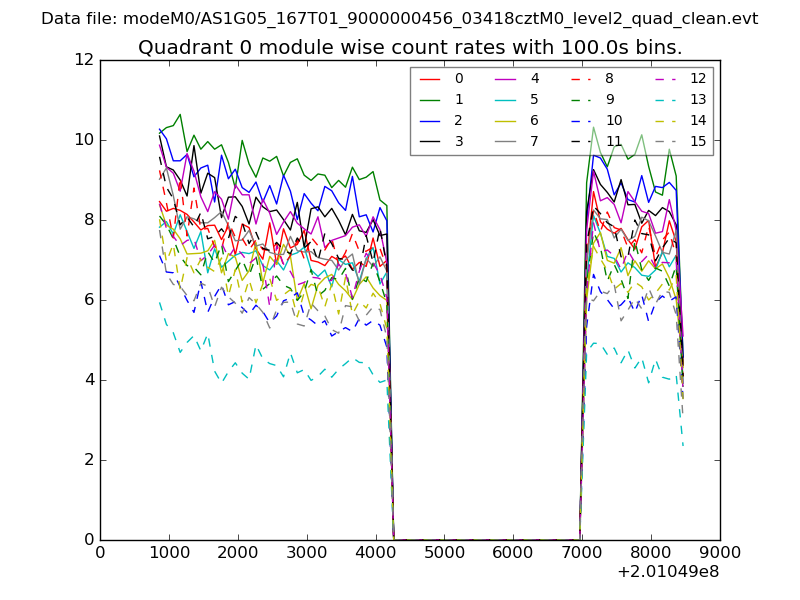 |
 |
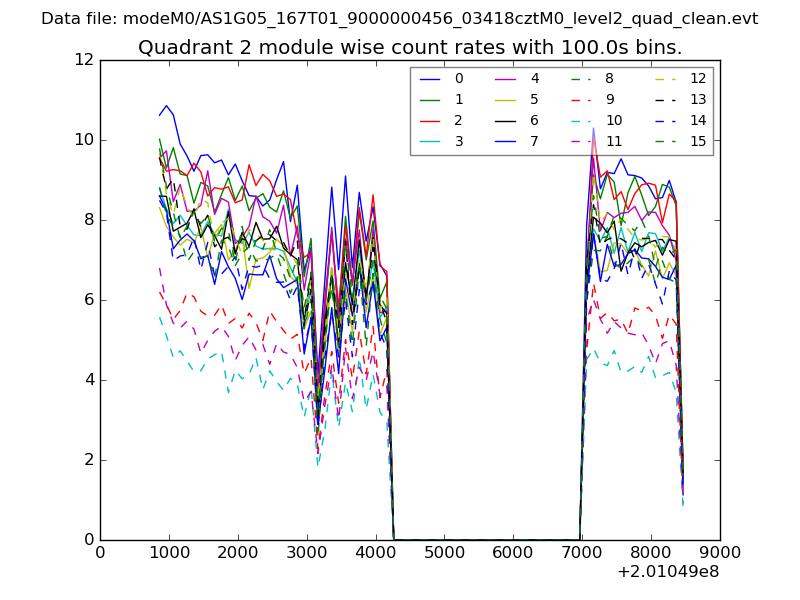
| Module-wise count rates for Quadrant B Data is divided into 100 sec bins |
 |
 |
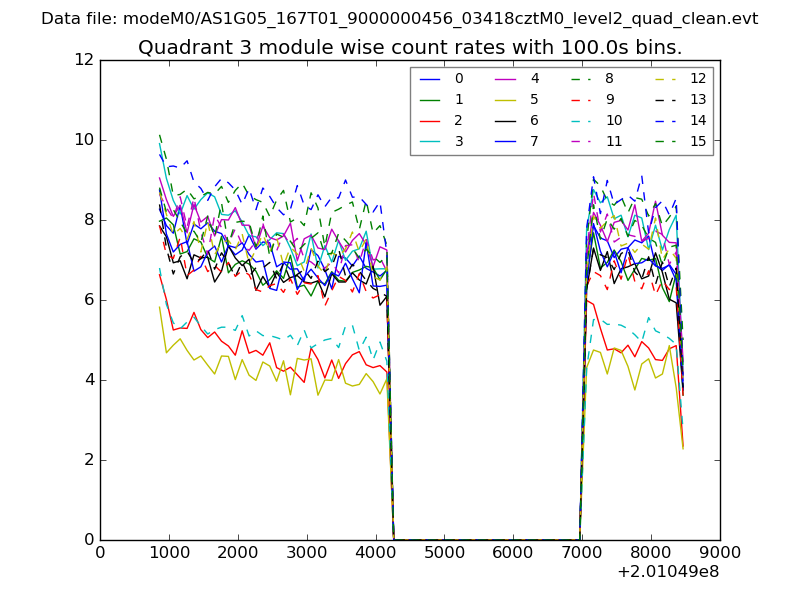
| Module-wise count rates for Quadrant C Data is divided into 100 sec bins |
 |
 |
| Module-wise count rates for Quadrant D Data is divided into 100 sec bins |
 |
 |
| Parameter | Plot |
|---|---|
| CZT HV Monitor | 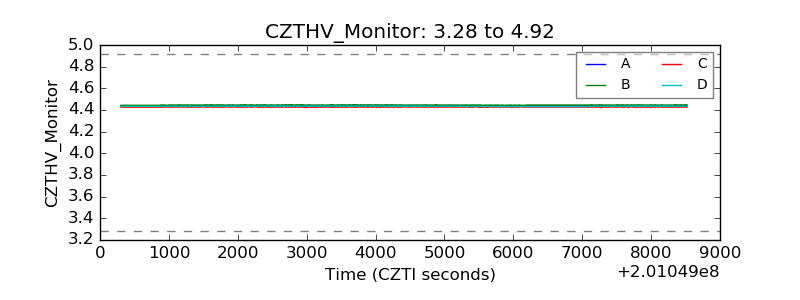 |
| D_VDD | 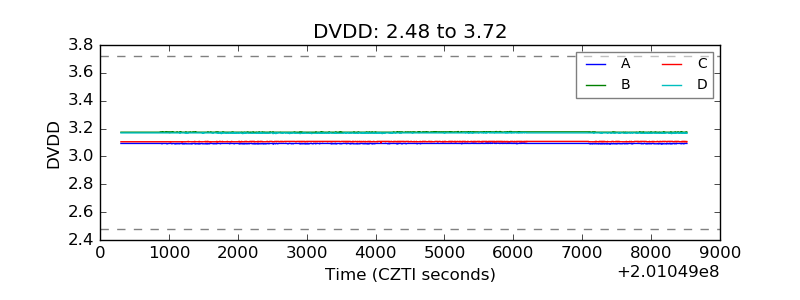 |
| Temperature 1 | 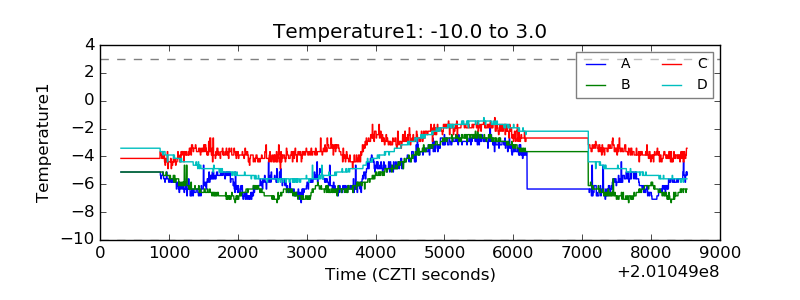 |
| Veto HV Monitor | 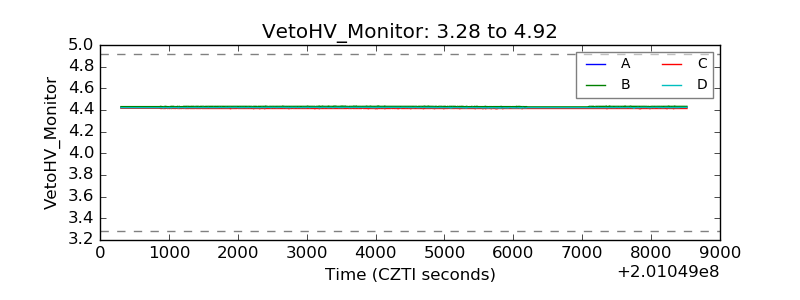 |
| Veto LLD | 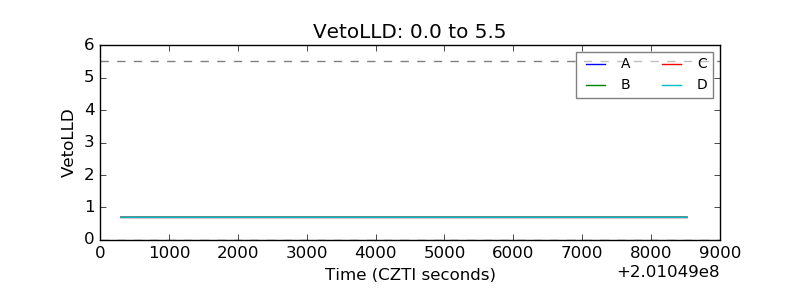 |
| Alpha Counter | 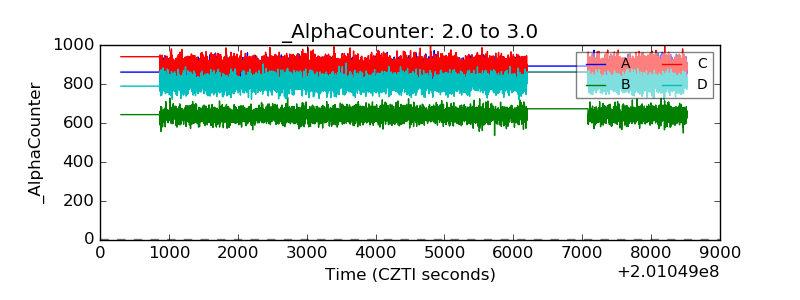 |
| _CPM_Rate | 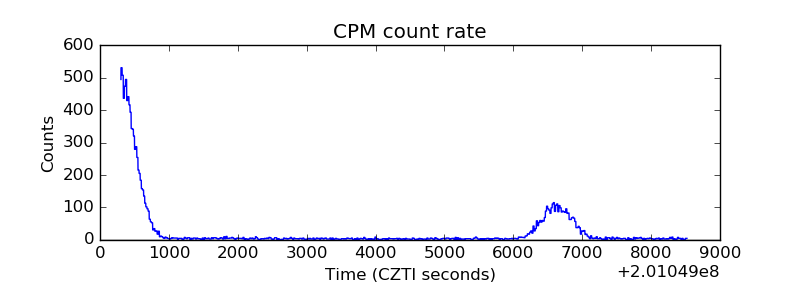 |
| CZT Counter | 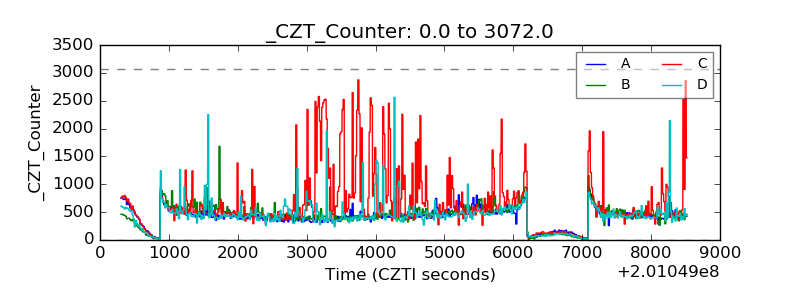 |
| +2.5 Volts monitor |  |
| +5 Volts monitor |  |
| _ROLL_ROT | 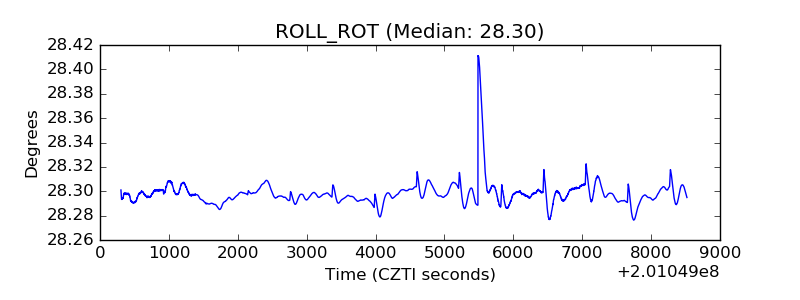 |
| _Roll_DEC | 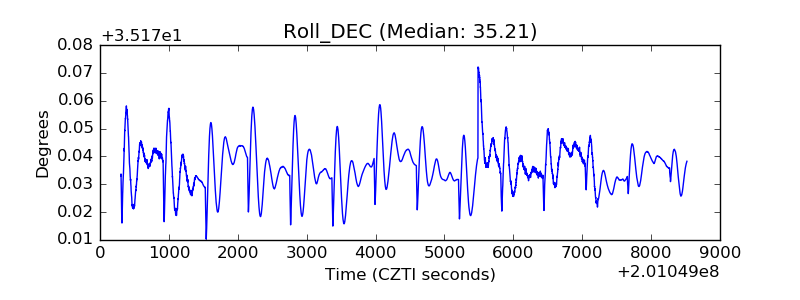 |
| _Roll_RA | 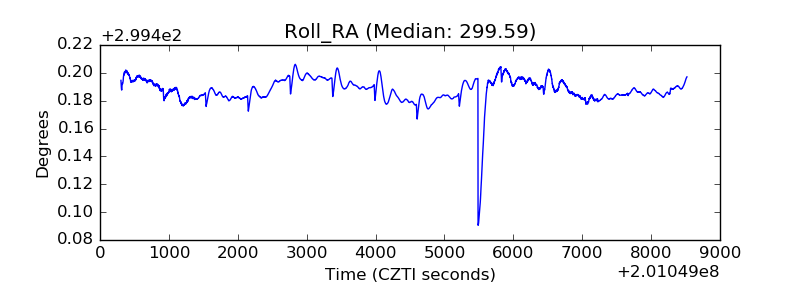 |
| Veto Counter | 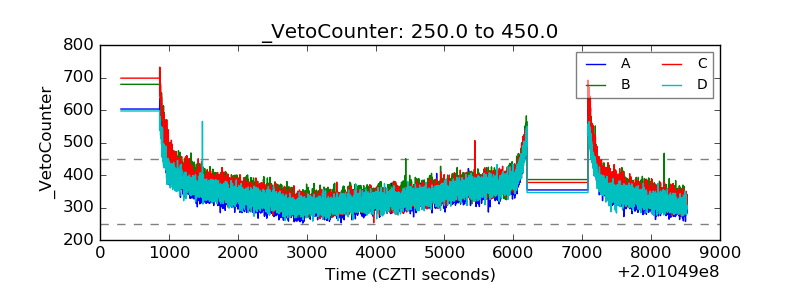 |