| Param | Original file | Final file |
|---|---|---|
| Filename | modeM0/AS1G05_167T01_9000000456_03420cztM0_level2.evt | modeM0/AS1G05_167T01_9000000456_03420cztM0_level2_quad_clean.evt |
| Size (bytes) | 561,640,320 | 97,142,400 |
| Size | 535.6 MB | 92.6 MB |
| Events in quadrant A | 4,091,637 | 609,078 |
| Events in quadrant B | 3,863,255 | 611,806 |
| Events in quadrant C | 5,001,228 | 600,792 |
| Events in quadrant D | 3,535,456 | 588,916 |
| Mode SS | |||
|---|---|---|---|
| Quadrant | BADHDUFLAG | Total packets | Discarded packets |
| A | 0 | 154 | 0 |
| B | 0 | 154 | 0 |
| C | 0 | 154 | 0 |
| D | 0 | 154 | 0 |
| Mode M0 | |||
|---|---|---|---|
| Quadrant | BADHDUFLAG | Total packets | Discarded packets |
| A | 0 | 17363 | 1 |
| B | 0 | 16464 | 0 |
| C | 0 | 20135 | 0 |
| D | 0 | 16269 | 0 |
| Quadrant | Total seconds | Saturated seconds | Saturation percentage |
|---|---|---|---|
| A | 7631 | 41 | 0.537282% |
| B | 7631 | 79 | 1.035251% |
| C | 7631 | 234 | 3.066440% |
| D | 7631 | 33 | 0.432447% |
Noise dominated data is calculated using 1-second bins in cleaned event files. If a bin has >2000 counts, and if more than 50% of those come from <1% of pixels, then it is considered to be noise-dominated and hence unusable.
| Quadrant | # 1 sec bins | Bins with >0 counts | Bins with >2000 counts | High rate bins dominated by noise | Noise dominated (total time) | Noise dominated (detector-on time) | Marked lightcurve |
|---|---|---|---|---|---|---|---|
| A | 7631 | 7631 | 1 | 1 | 0.01% | 0.01% | 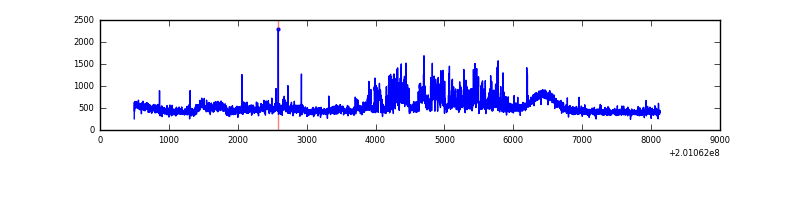 |
| B | 7631 | 7631 | 22 | 22 | 0.29% | 0.29% | 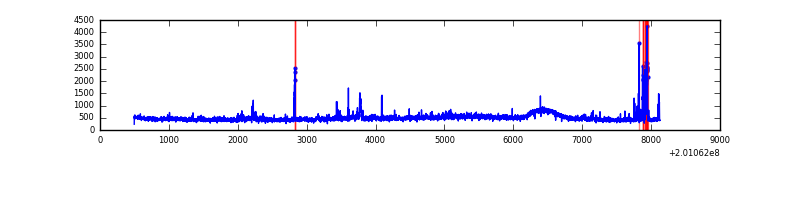 |
| C | 7631 | 7631 | 164 | 164 | 2.15% | 2.15% |  |
| D | 7631 | 7631 | 23 | 23 | 0.30% | 0.30% | 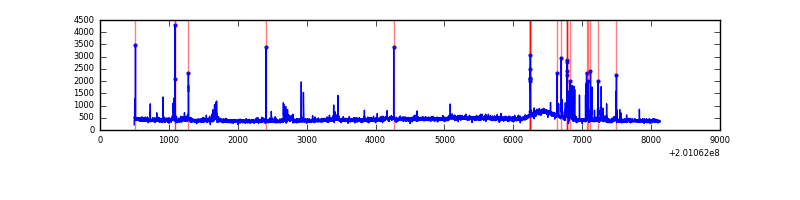 |
Top three noisy pixels from each quadrant. If the there are fewer than three noisy pixels in the level2.evt file, extra rows are filled as -1
| Pixel properties | Quadrant properties | ||||||
|---|---|---|---|---|---|---|---|
| Quadrant | DetID | PixID | Counts | Sigma | Mean | Median | Sigma |
| A | 15 | 249 | 391419 | 2158.62 | 882 | 864 | 180.9 |
| A | 14 | 249 | 266622 | 1468.86 | 882 | 864 | 180.9 |
| A | 0 | 118 | 16484 | 86.33 | 882 | 864 | 180.9 |
| B | 5 | 70 | 126720 | 708.74 | 898 | 875 | 177.6 |
| B | 15 | 204 | 104677 | 584.6 | 898 | 875 | 177.6 |
| B | 14 | 167 | 87158 | 485.93 | 898 | 875 | 177.6 |
| C | 7 | 220 | 1448533 | 7244.15 | 853 | 858 | 199.8 |
| C | 1 | 192 | 133527 | 663.87 | 853 | 858 | 199.8 |
| C | 14 | 223 | 46000 | 225.89 | 853 | 858 | 199.8 |
| D | 9 | 85 | 142165 | 685.76 | 851 | 825 | 206.1 |
| D | 13 | 223 | 92670 | 445.62 | 851 | 825 | 206.1 |
| D | 2 | 37 | 34915 | 165.4 | 851 | 825 | 206.1 |
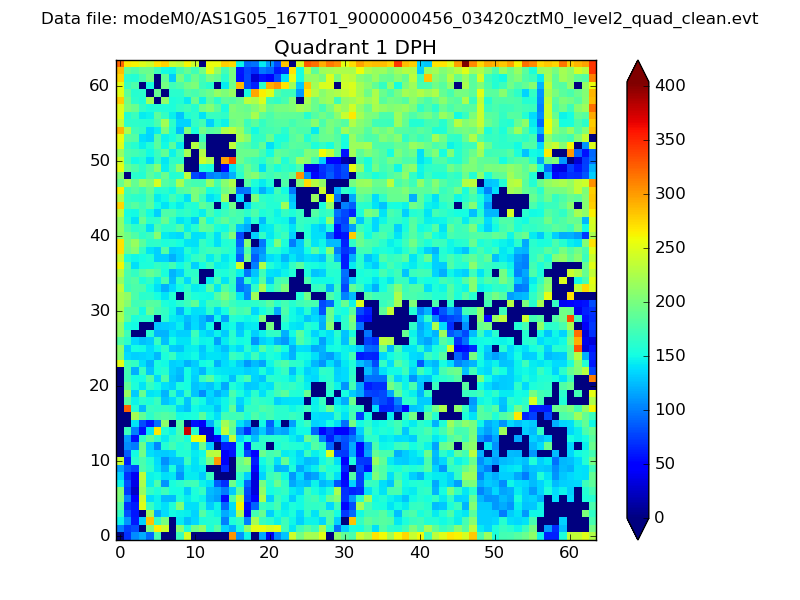
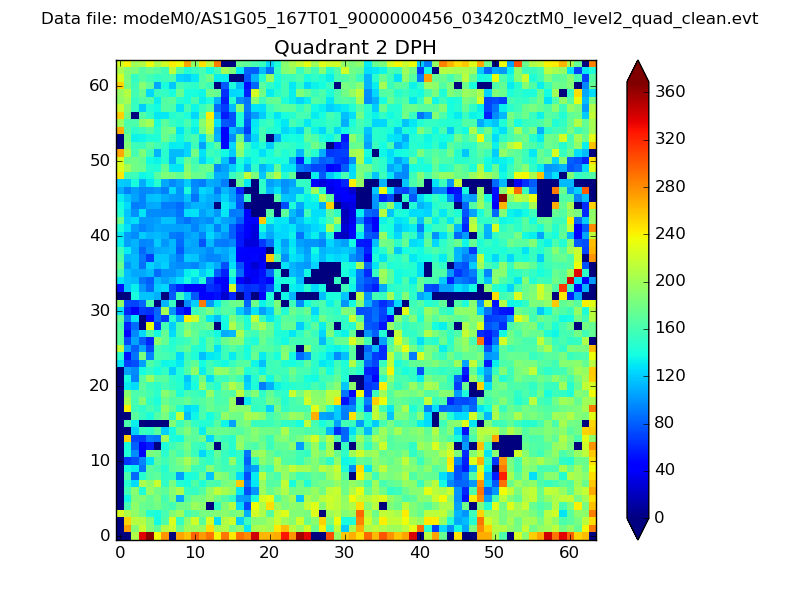
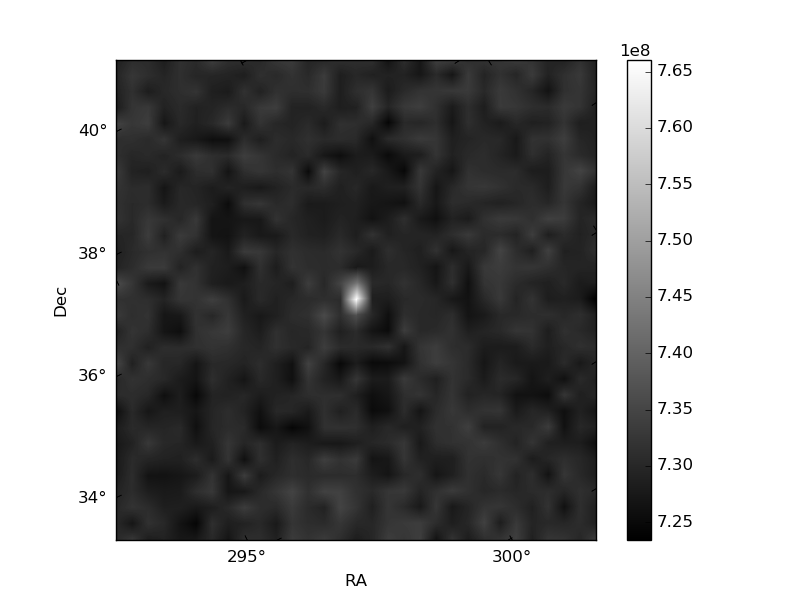
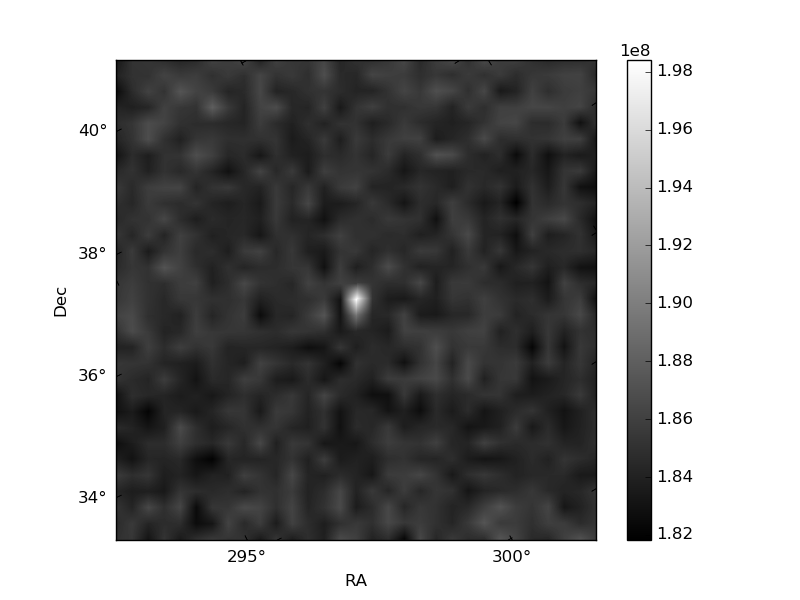
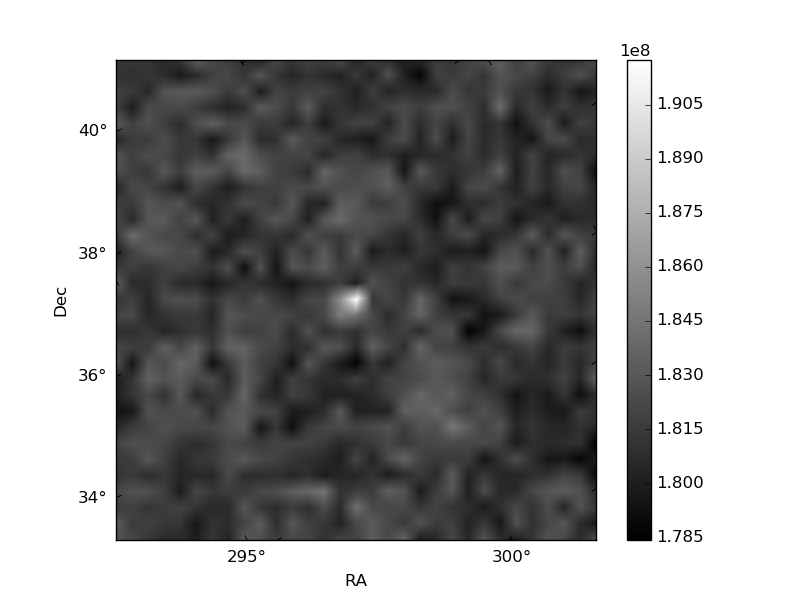
Histogram calculated using DETX and DETY for each event in the final _common_clean file
| Quadrant A | 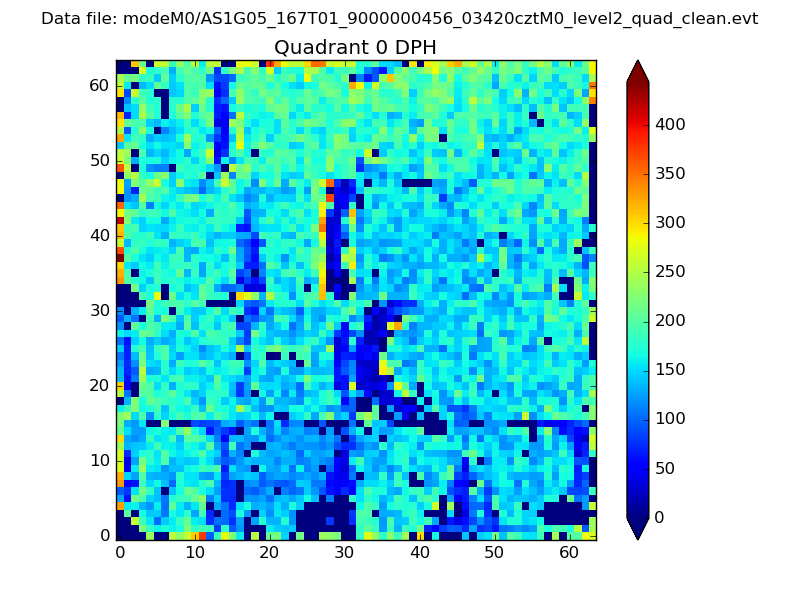 |
 |
Quadrant B |
|---|---|---|---|
| Quadrant D | 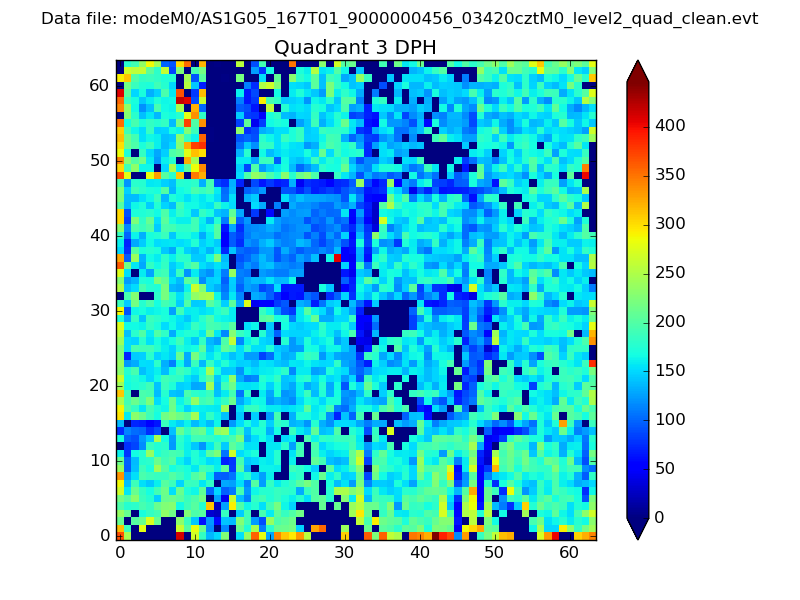 |
 |
Quadrant C |
| Plot type | Count rate plots | Images |
|---|---|---|
| Comparison with Poisson distribution Blue bars denote a histogram of data divided into 1 sec bins. Red curve is a Poisson curve with rate = median count rate of data. |
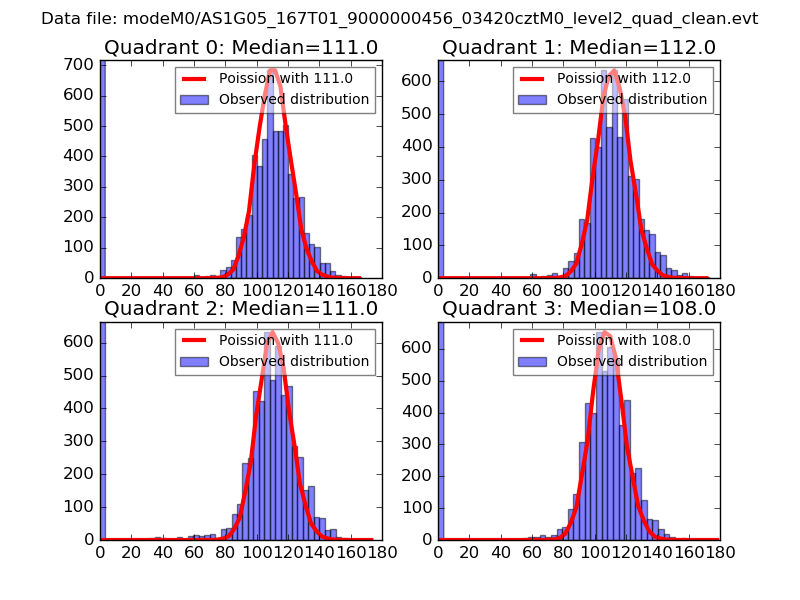 |
 |
| Quadrant-wise count rates Data is divided into 100 sec bins |
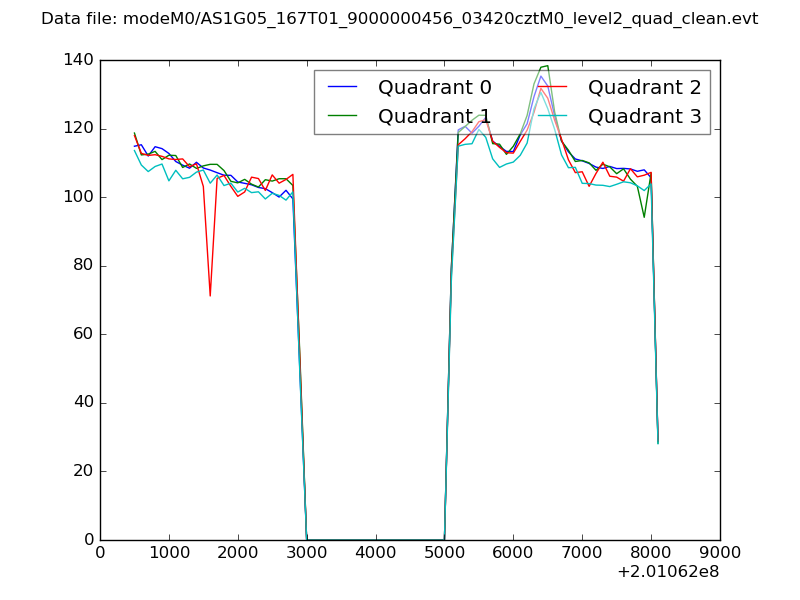 |
|
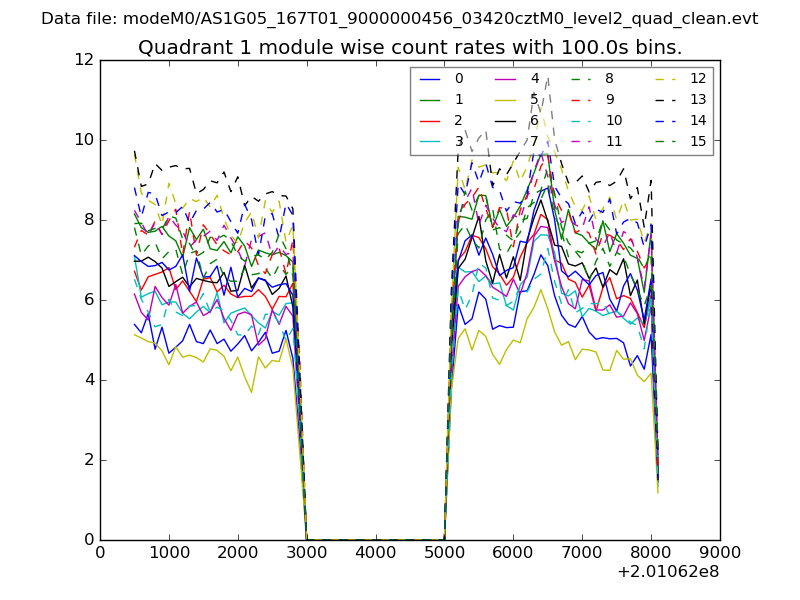
| Module-wise count rates for Quadrant A Data is divided into 100 sec bins |
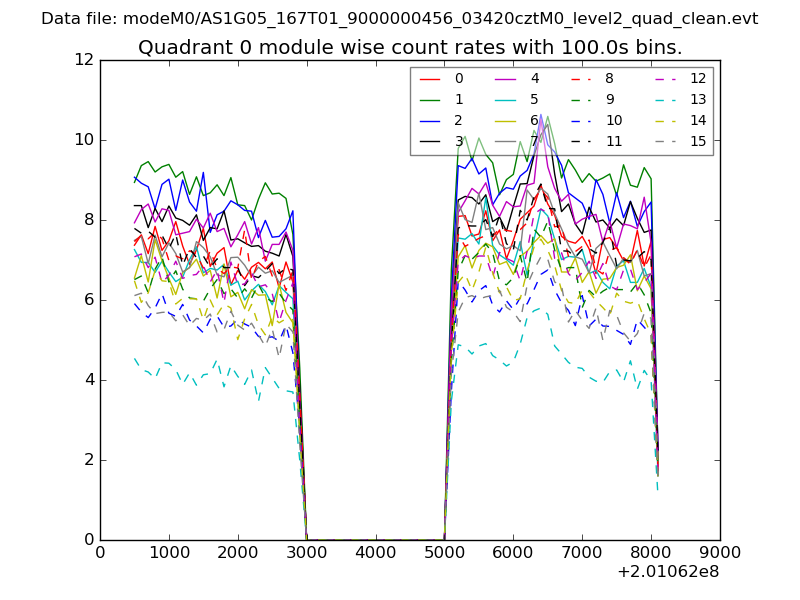 |
 |
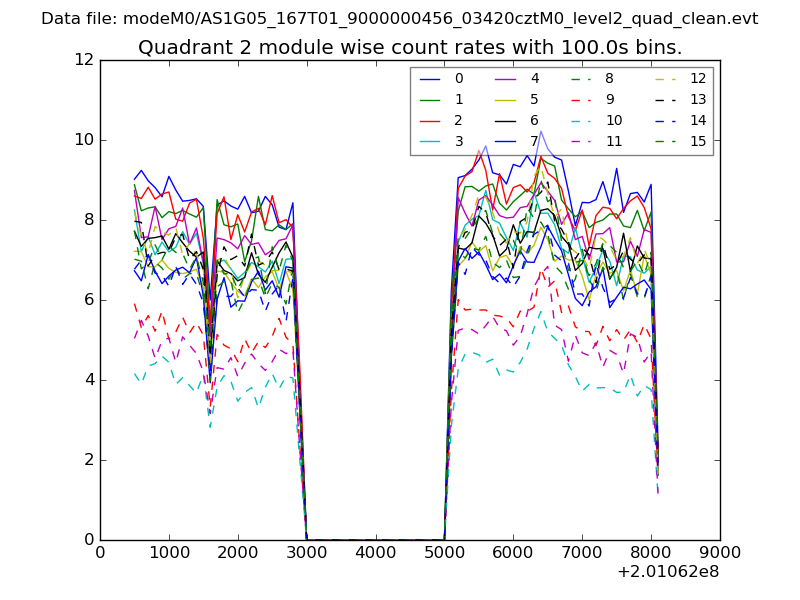
| Module-wise count rates for Quadrant B Data is divided into 100 sec bins |
 |
 |
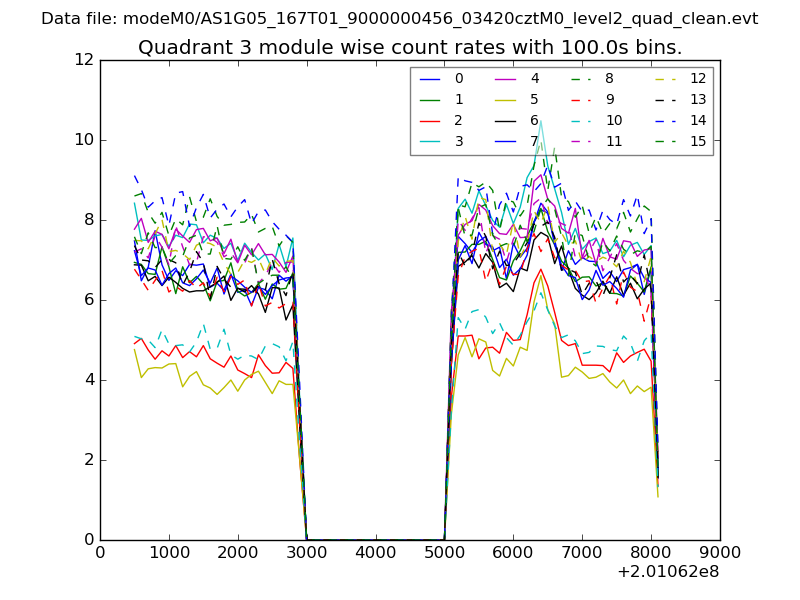
| Module-wise count rates for Quadrant C Data is divided into 100 sec bins |
 |
 |
| Module-wise count rates for Quadrant D Data is divided into 100 sec bins |
 |
 |
| Parameter | Plot |
|---|---|
| CZT HV Monitor | 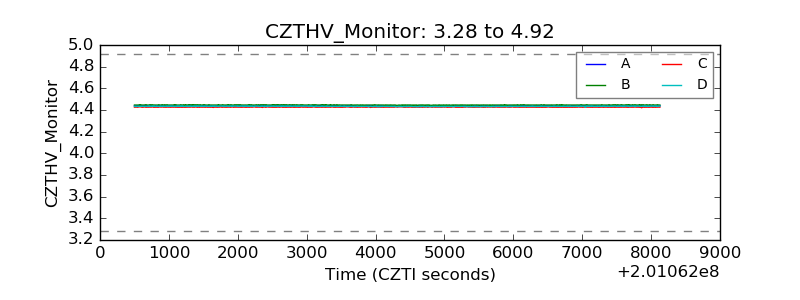 |
| D_VDD | 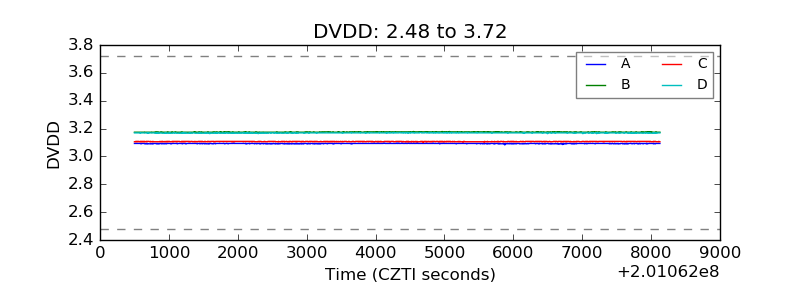 |
| Temperature 1 | 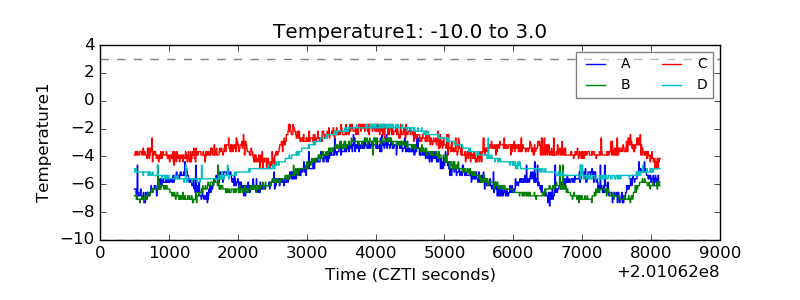 |
| Veto HV Monitor | 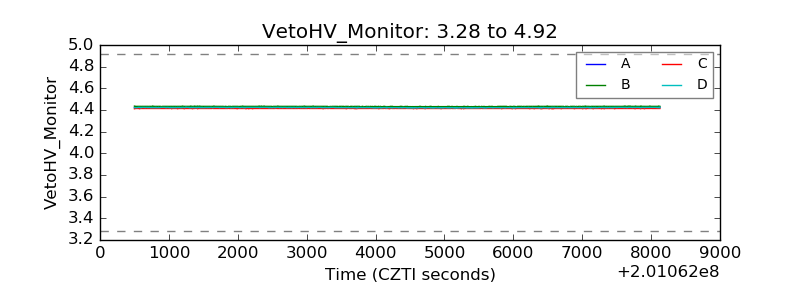 |
| Veto LLD | 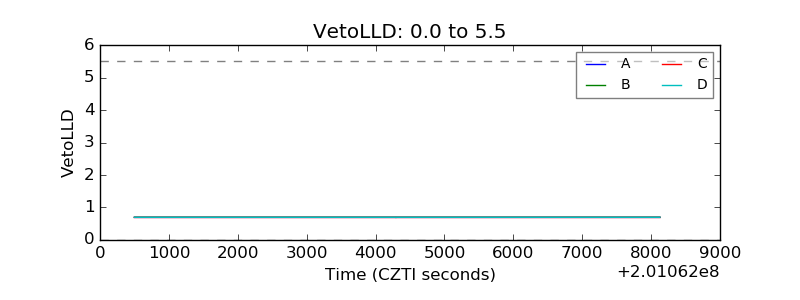 |
| Alpha Counter | 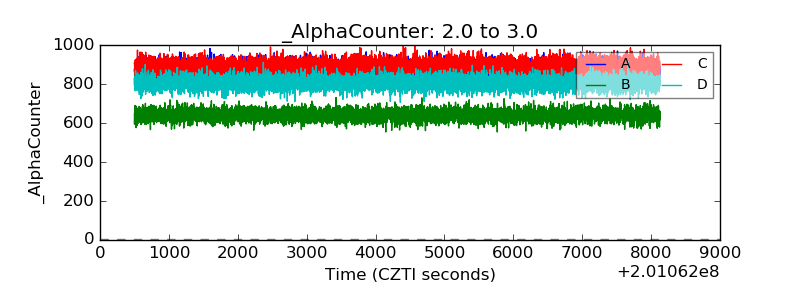 |
| _CPM_Rate | 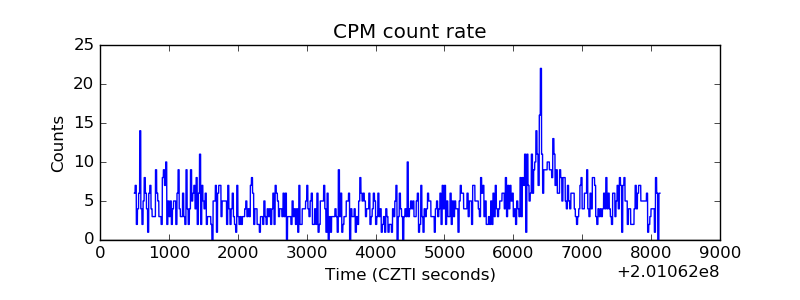 |
| CZT Counter | 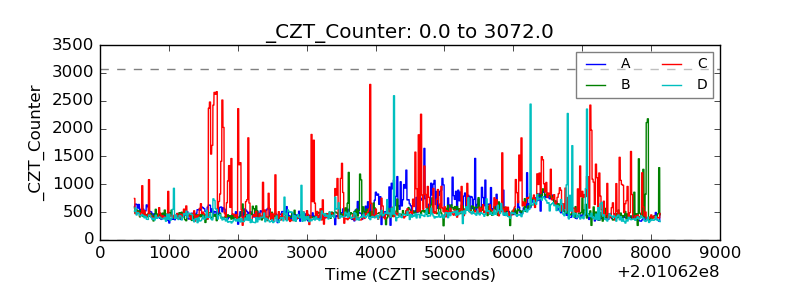 |
| +2.5 Volts monitor |  |
| +5 Volts monitor |  |
| _ROLL_ROT | 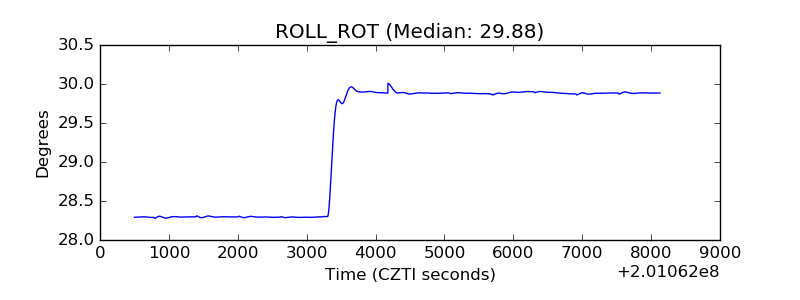 |
| _Roll_DEC | 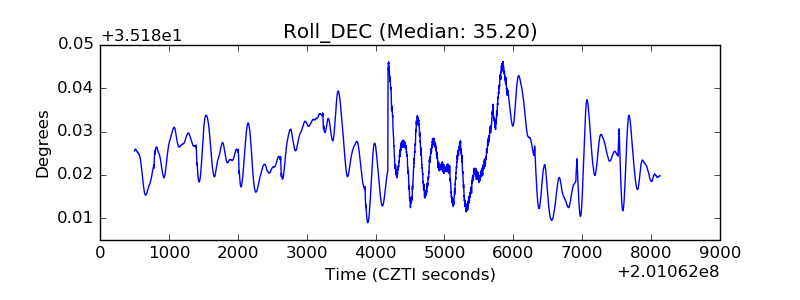 |
| _Roll_RA | 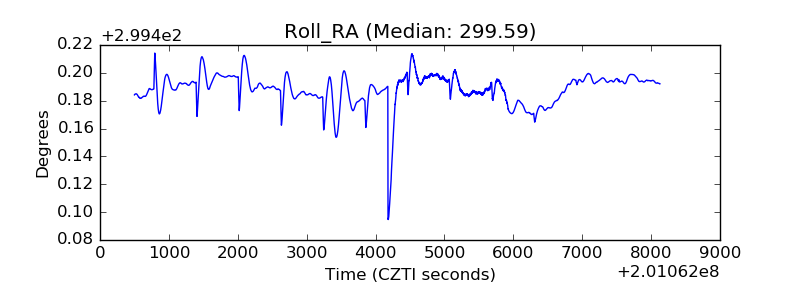 |
| Veto Counter | 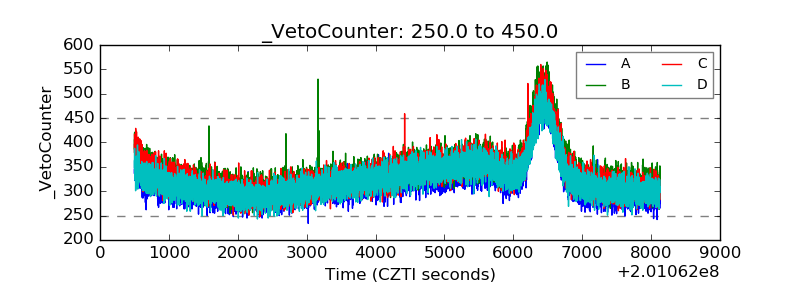 |