| Param | Original file | Final file |
|---|---|---|
| Filename | modeM0/AS1G05_167T01_9000000456_03421cztM0_level2.evt | modeM0/AS1G05_167T01_9000000456_03421cztM0_level2_quad_clean.evt |
| Size (bytes) | 544,325,760 | 89,017,920 |
| Size | 519.1 MB | 84.9 MB |
| Events in quadrant A | 3,318,509 | 558,616 |
| Events in quadrant B | 3,914,212 | 557,424 |
| Events in quadrant C | 5,443,143 | 537,415 |
| Events in quadrant D | 3,319,013 | 539,349 |
| Mode SS | |||
|---|---|---|---|
| Quadrant | BADHDUFLAG | Total packets | Discarded packets |
| A | 0 | 146 | 0 |
| B | 0 | 146 | 0 |
| C | 0 | 146 | 0 |
| D | 0 | 146 | 0 |
| Mode M0 | |||
|---|---|---|---|
| Quadrant | BADHDUFLAG | Total packets | Discarded packets |
| A | 0 | 14925 | 2 |
| B | 0 | 16282 | 1 |
| C | 0 | 21139 | 1 |
| D | 0 | 15288 | 1 |
| Quadrant | Total seconds | Saturated seconds | Saturation percentage |
|---|---|---|---|
| A | 7212 | 187 | 2.592901% |
| B | 7212 | 247 | 3.424847% |
| C | 7212 | 553 | 7.667776% |
| D | 7212 | 126 | 1.747088% |
Noise dominated data is calculated using 1-second bins in cleaned event files. If a bin has >2000 counts, and if more than 50% of those come from <1% of pixels, then it is considered to be noise-dominated and hence unusable.
| Quadrant | # 1 sec bins | Bins with >0 counts | Bins with >2000 counts | High rate bins dominated by noise | Noise dominated (total time) | Noise dominated (detector-on time) | Marked lightcurve |
|---|---|---|---|---|---|---|---|
| A | 7227 | 7213 | 0 | 0 | 0.00% | 0.00% | 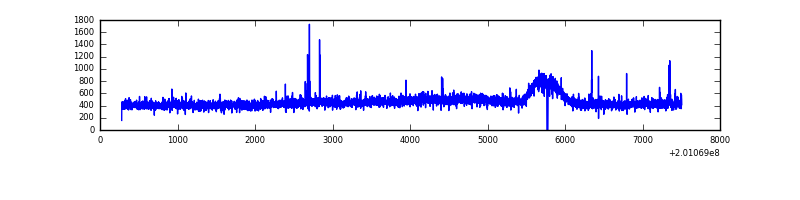 |
| B | 7227 | 7213 | 47 | 47 | 0.65% | 0.65% | 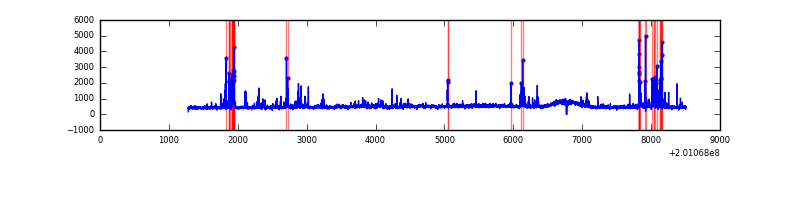 |
| C | 7227 | 7213 | 297 | 297 | 4.11% | 4.12% | 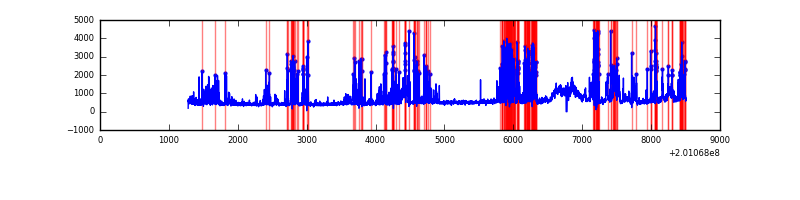 |
| D | 7227 | 7213 | 11 | 11 | 0.15% | 0.15% | 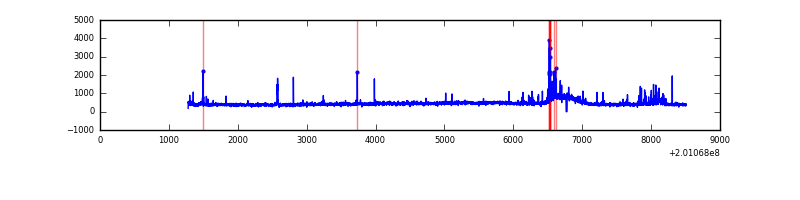 |
Top three noisy pixels from each quadrant. If the there are fewer than three noisy pixels in the level2.evt file, extra rows are filled as -1
| Pixel properties | Quadrant properties | ||||||
|---|---|---|---|---|---|---|---|
| Quadrant | DetID | PixID | Counts | Sigma | Mean | Median | Sigma |
| A | 14 | 249 | 40928 | 230.91 | 836 | 816 | 173.7 |
| A | 8 | 15 | 22031 | 122.13 | 836 | 816 | 173.7 |
| A | 0 | 118 | 13728 | 74.33 | 836 | 816 | 173.7 |
| B | 2 | 249 | 248127 | 1495.15 | 840 | 818 | 165.4 |
| B | 5 | 70 | 161010 | 968.47 | 840 | 818 | 165.4 |
| B | 15 | 204 | 139129 | 836.18 | 840 | 818 | 165.4 |
| C | 7 | 220 | 1466663 | 7890.82 | 788 | 792 | 185.8 |
| C | 1 | 192 | 634079 | 3409.0 | 788 | 792 | 185.8 |
| C | 14 | 223 | 219846 | 1179.17 | 788 | 792 | 185.8 |
| D | 9 | 85 | 99515 | 509.38 | 802 | 777 | 193.8 |
| D | 12 | 246 | 39881 | 201.73 | 802 | 777 | 193.8 |
| D | 1 | 31 | 38565 | 194.94 | 802 | 777 | 193.8 |
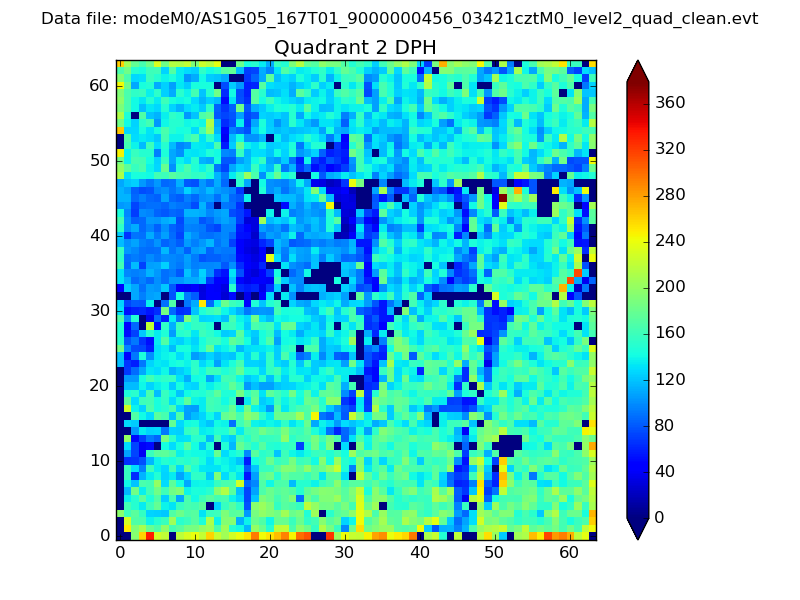
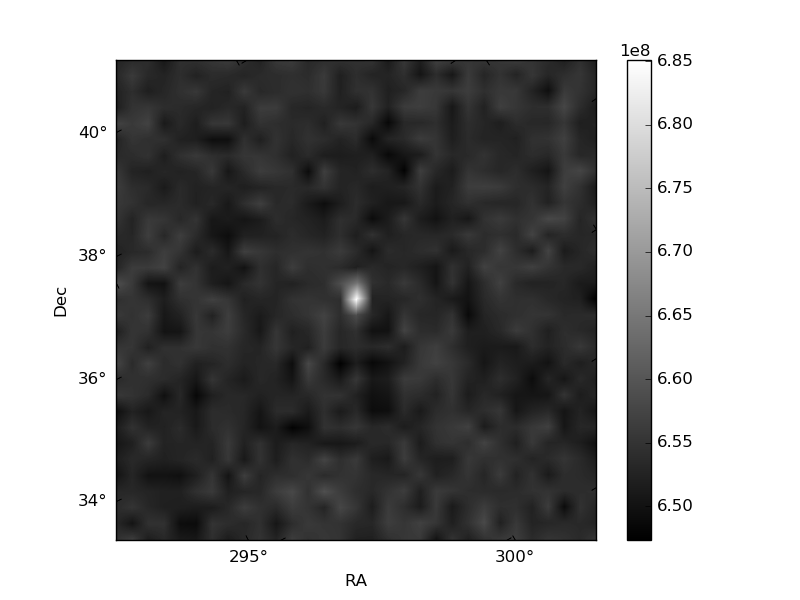
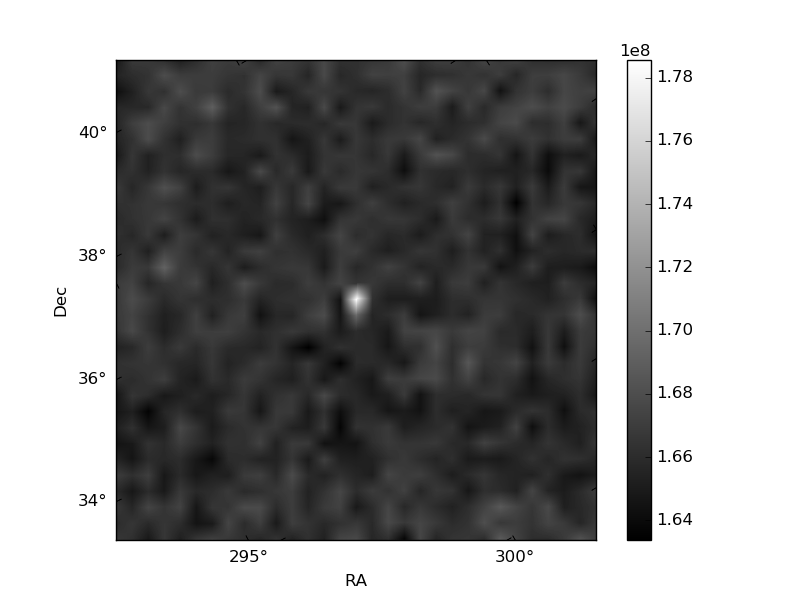
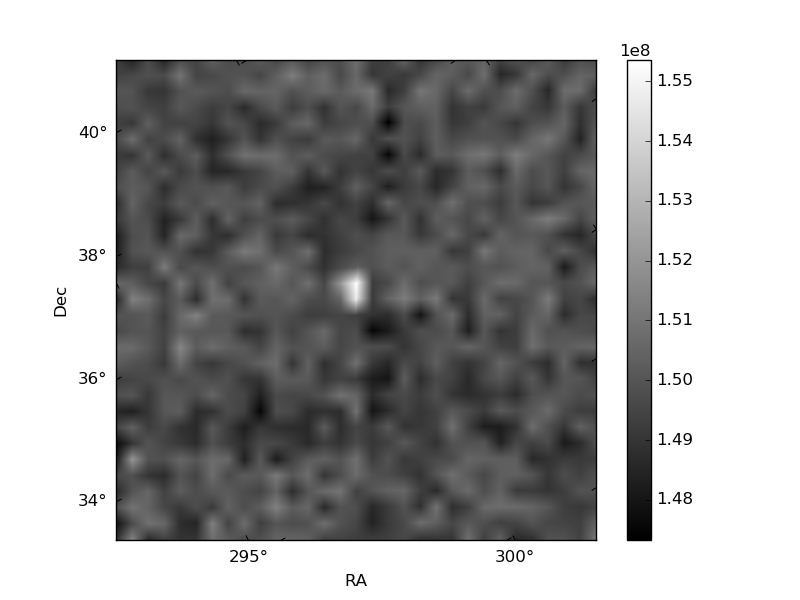
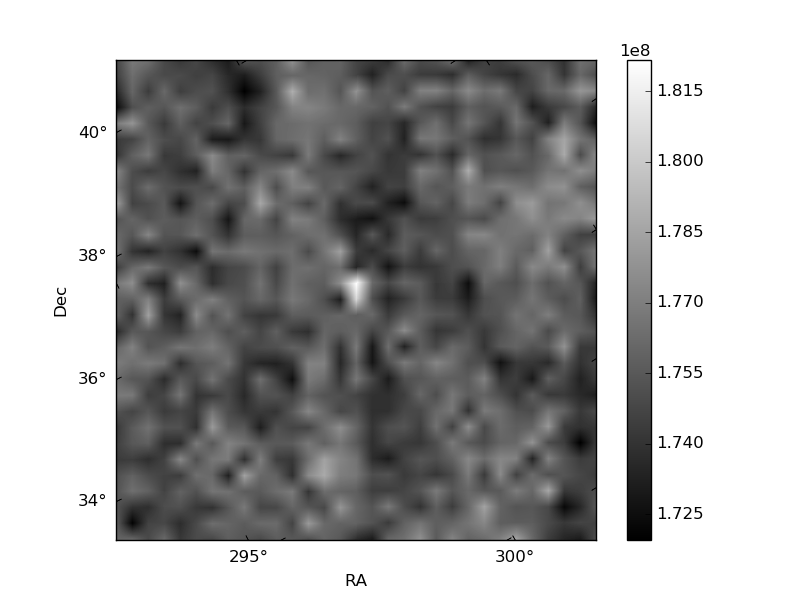
Histogram calculated using DETX and DETY for each event in the final _common_clean file
| Quadrant A | 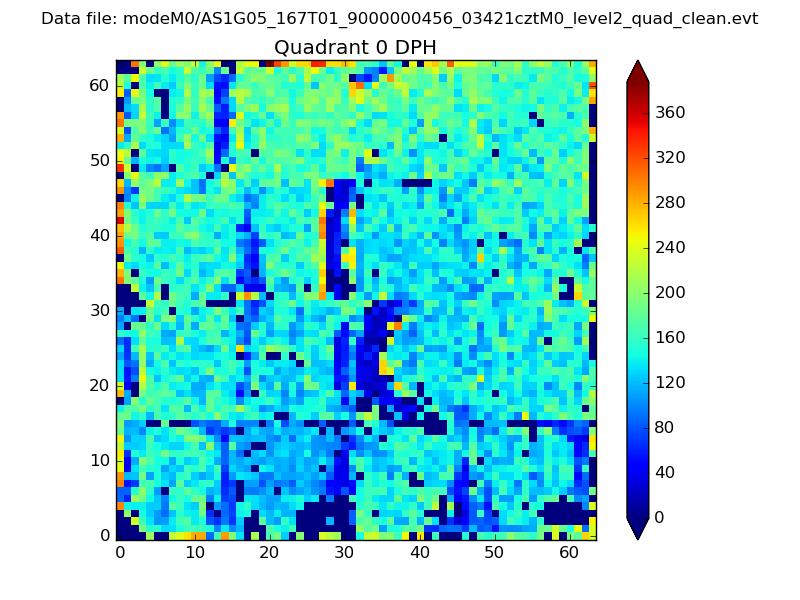 |
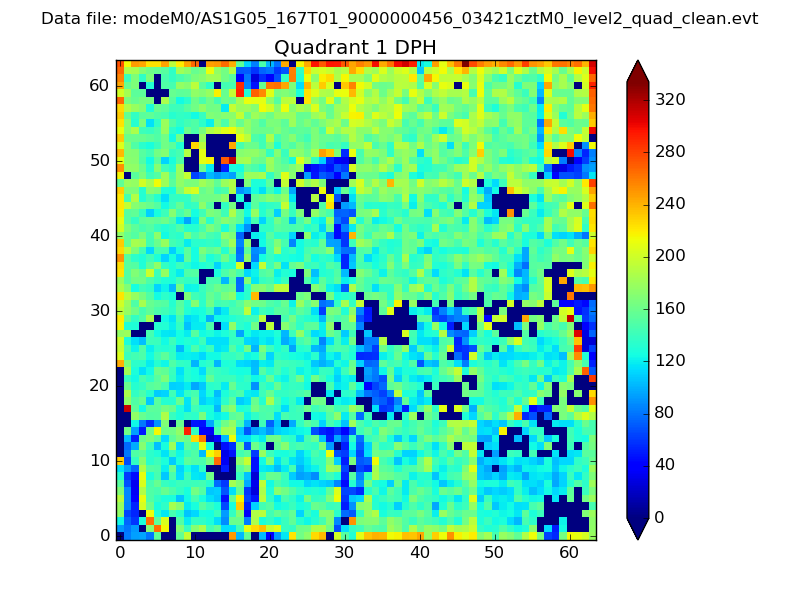 |
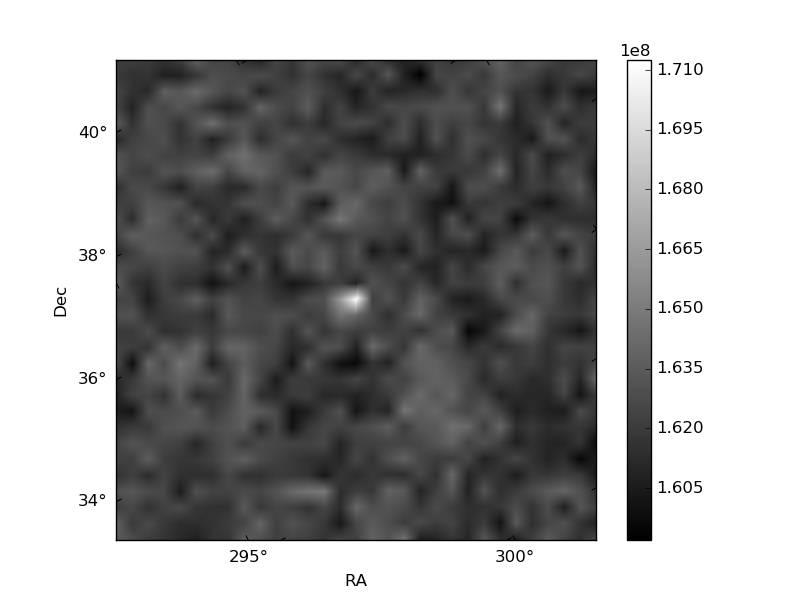
Quadrant B |
|---|---|---|---|
| Quadrant D | 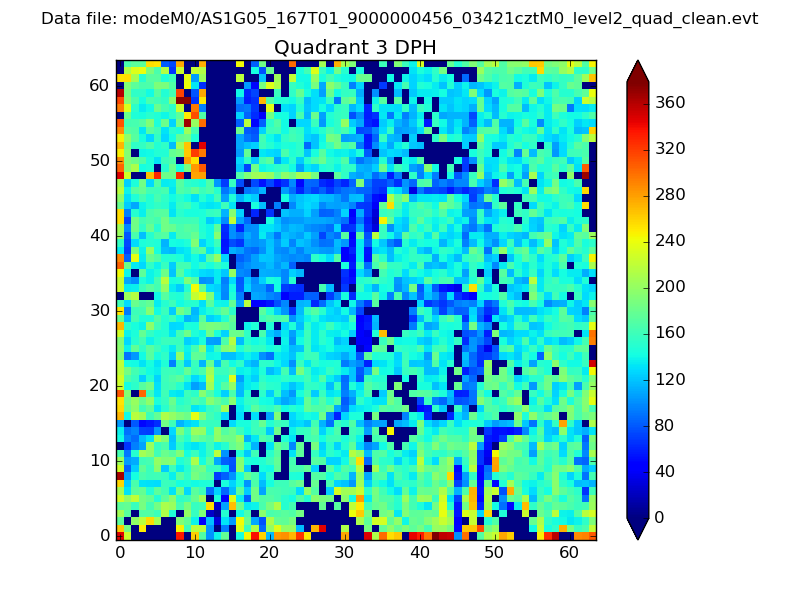 |
 |
Quadrant C |
| Plot type | Count rate plots | Images |
|---|---|---|
| Comparison with Poisson distribution Blue bars denote a histogram of data divided into 1 sec bins. Red curve is a Poisson curve with rate = median count rate of data. |
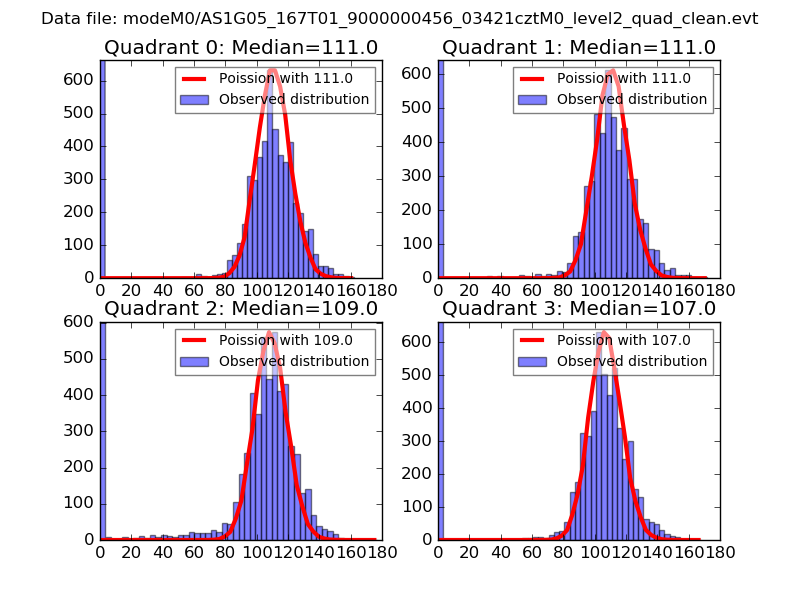 |
 |
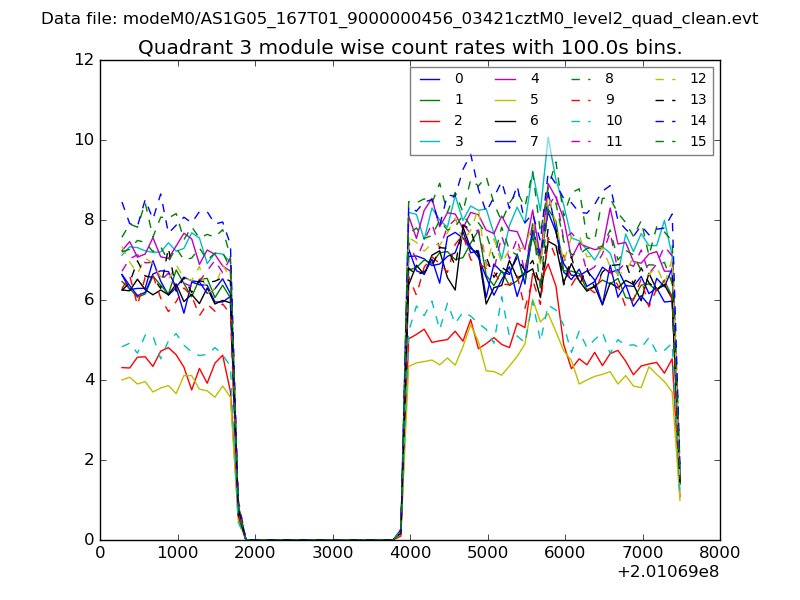
| Quadrant-wise count rates Data is divided into 100 sec bins |
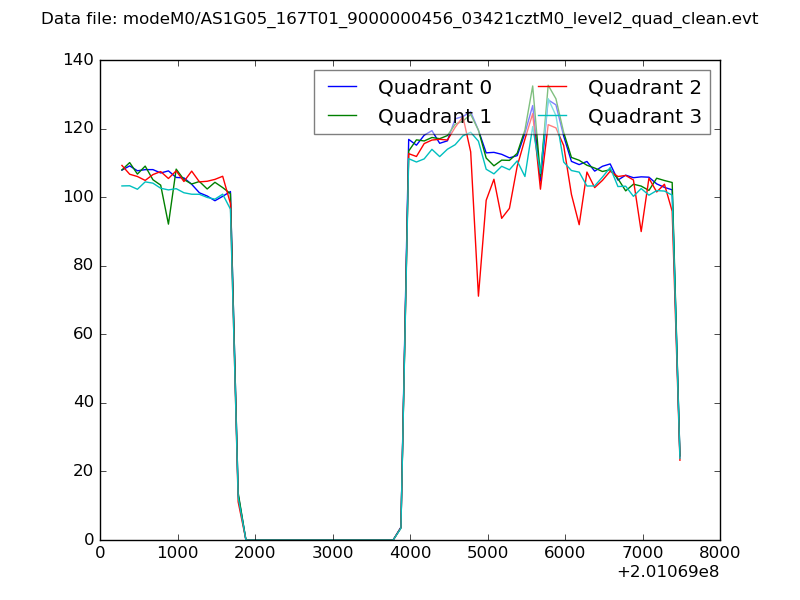 |
|
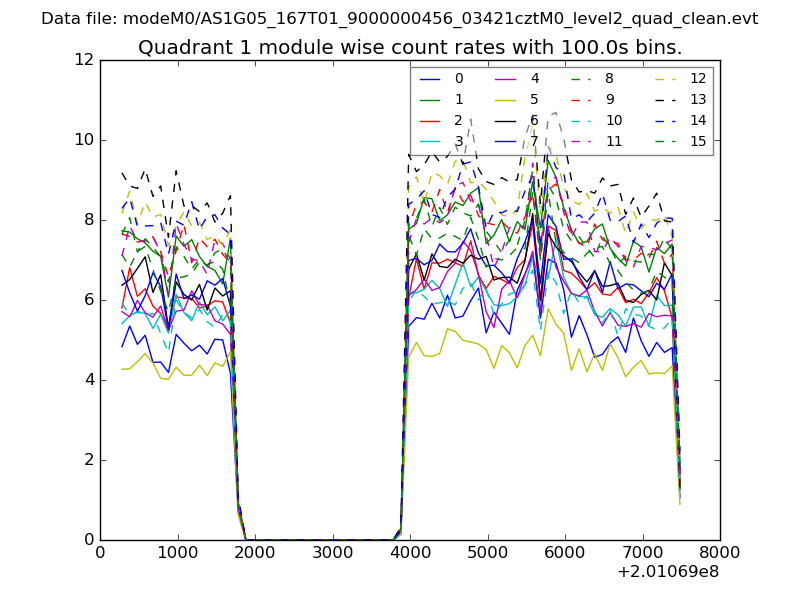
| Module-wise count rates for Quadrant A Data is divided into 100 sec bins |
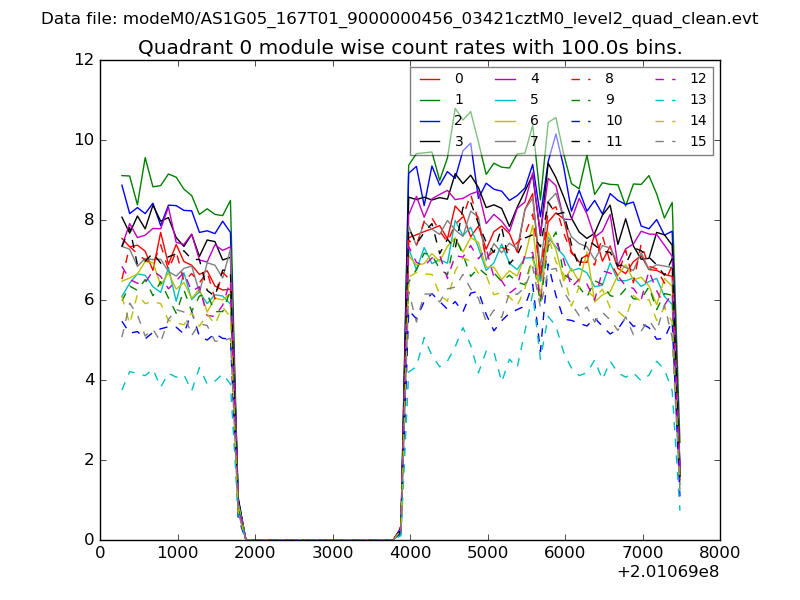 |
 |
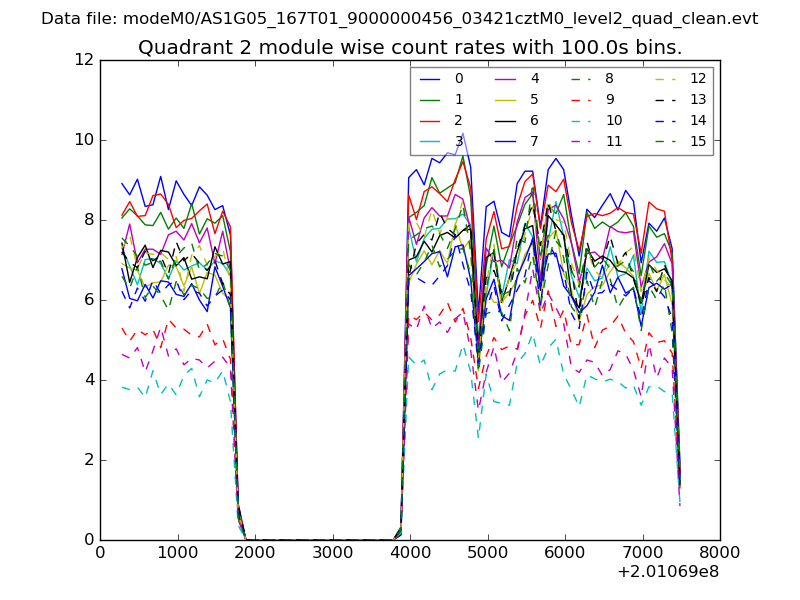
| Module-wise count rates for Quadrant B Data is divided into 100 sec bins |
 |
 |
| Module-wise count rates for Quadrant C Data is divided into 100 sec bins |
 |
 |
| Module-wise count rates for Quadrant D Data is divided into 100 sec bins |
 |
 |
| Parameter | Plot |
|---|---|
| CZT HV Monitor | 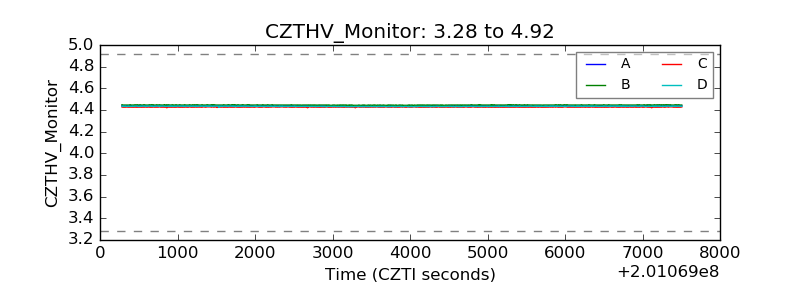 |
| D_VDD | 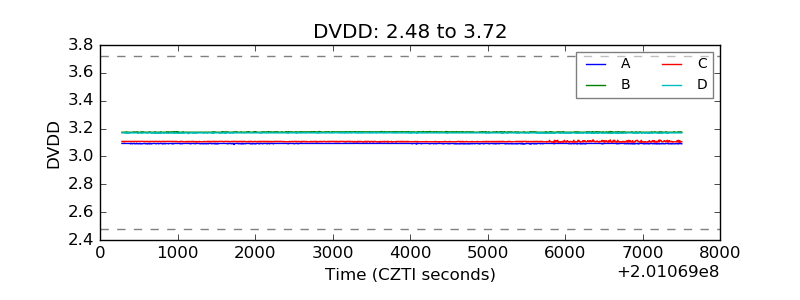 |
| Temperature 1 | 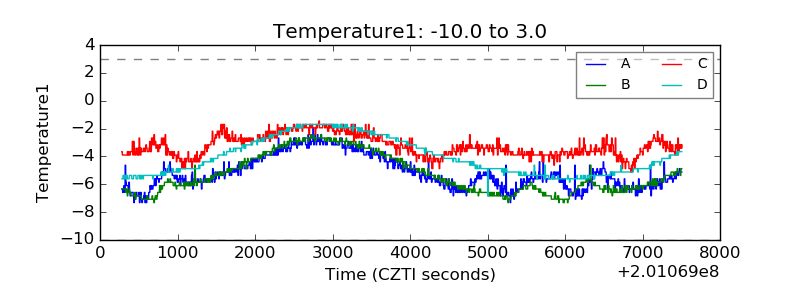 |
| Veto HV Monitor | 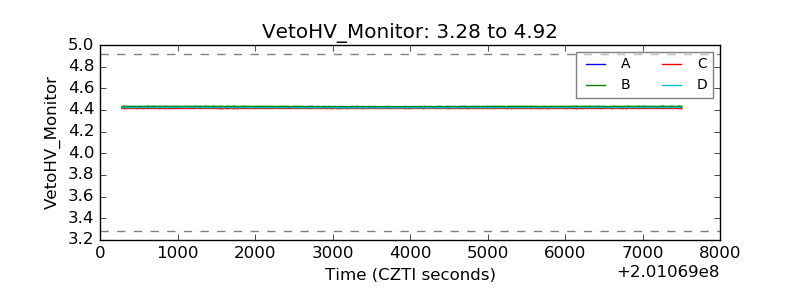 |
| Veto LLD | 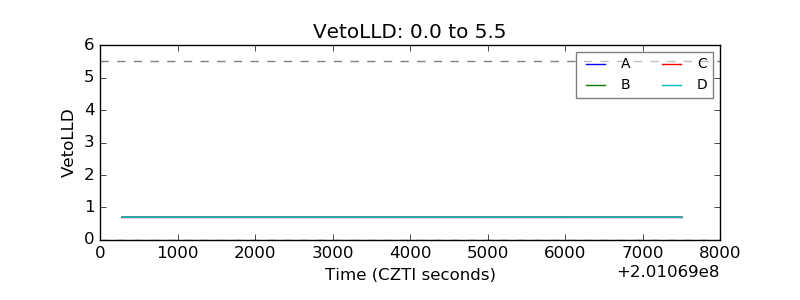 |
| Alpha Counter |  |
| _CPM_Rate | 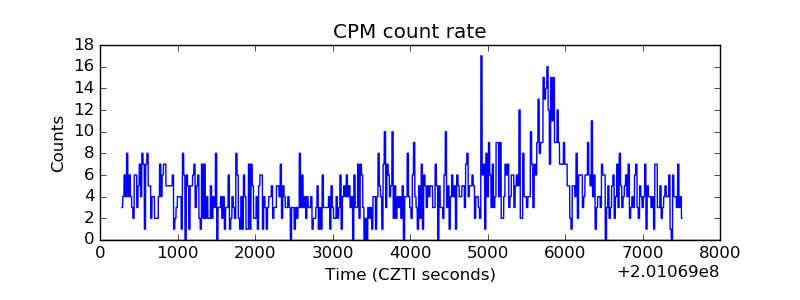 |
| CZT Counter | 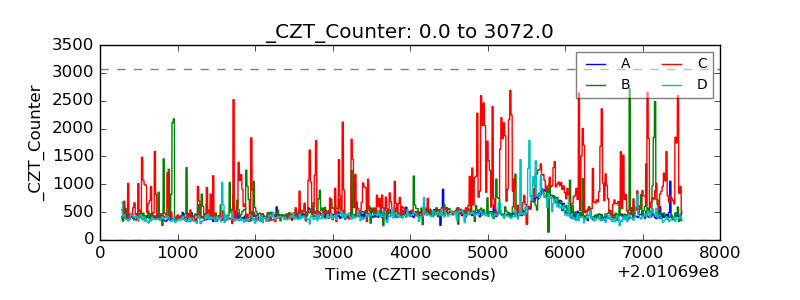 |
| +2.5 Volts monitor | 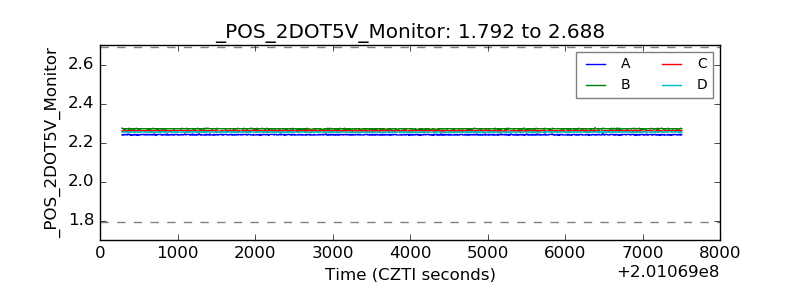 |
| +5 Volts monitor |  |
| _ROLL_ROT |  |
| _Roll_DEC | 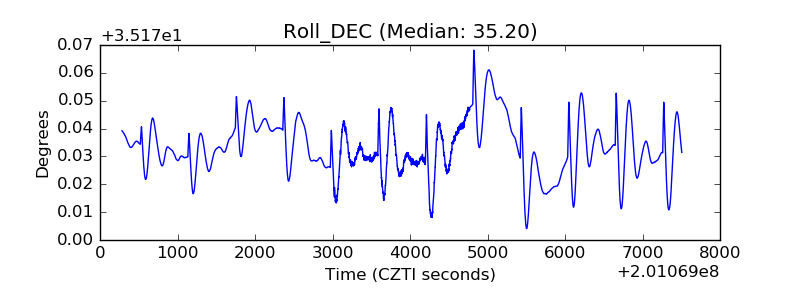 |
| _Roll_RA |  |
| Veto Counter | 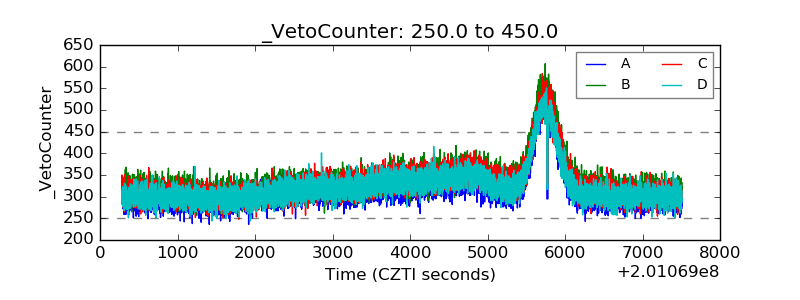 |