| Param | Original file | Final file |
|---|---|---|
| Filename | modeM0/AS1G05_167T01_9000000456_03424cztM0_level2.evt | modeM0/AS1G05_167T01_9000000456_03424cztM0_level2_quad_clean.evt |
| Size (bytes) | 1,327,112,640 | 194,083,200 |
| Size | 1.2 GB | 185.1 MB |
| Events in quadrant A | 8,593,468 | 1,175,864 |
| Events in quadrant B | 9,839,802 | 1,177,584 |
| Events in quadrant C | 11,958,849 | 1,149,065 |
| Events in quadrant D | 8,578,847 | 1,129,670 |
| Mode M9 | |||
|---|---|---|---|
| Quadrant | BADHDUFLAG | Total packets | Discarded packets |
| A | 0 | 17 | 0 |
| B | 0 | 17 | 0 |
| C | 0 | 17 | 0 |
| D | 0 | 17 | 0 |
| Mode SS | |||
|---|---|---|---|
| Quadrant | BADHDUFLAG | Total packets | Discarded packets |
| A | 0 | 366 | 0 |
| B | 0 | 366 | 0 |
| C | 0 | 366 | 0 |
| D | 0 | 366 | 0 |
| Mode M0 | |||
|---|---|---|---|
| Quadrant | BADHDUFLAG | Total packets | Discarded packets |
| A | 0 | 37859 | 4 |
| B | 0 | 40604 | 3 |
| C | 0 | 47667 | 3 |
| D | 0 | 38541 | 6 |
| Quadrant | Total seconds | Saturated seconds | Saturation percentage |
|---|---|---|---|
| A | 18069 | 295 | 1.632630% |
| B | 18069 | 326 | 1.804195% |
| C | 18069 | 976 | 5.401516% |
| D | 18068 | 306 | 1.693602% |
Noise dominated data is calculated using 1-second bins in cleaned event files. If a bin has >2000 counts, and if more than 50% of those come from <1% of pixels, then it is considered to be noise-dominated and hence unusable.
| Quadrant | # 1 sec bins | Bins with >0 counts | Bins with >2000 counts | High rate bins dominated by noise | Noise dominated (total time) | Noise dominated (detector-on time) | Marked lightcurve |
|---|---|---|---|---|---|---|---|
| A | 19735 | 18073 | 17 | 17 | 0.09% | 0.09% | 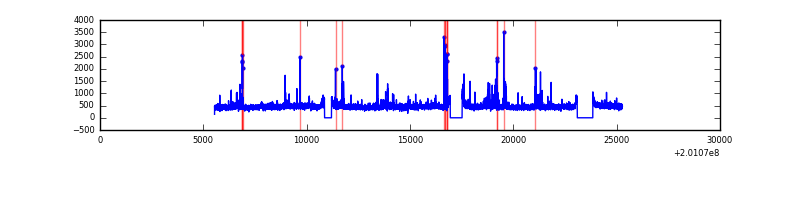 |
| B | 19735 | 18073 | 46 | 46 | 0.23% | 0.25% | 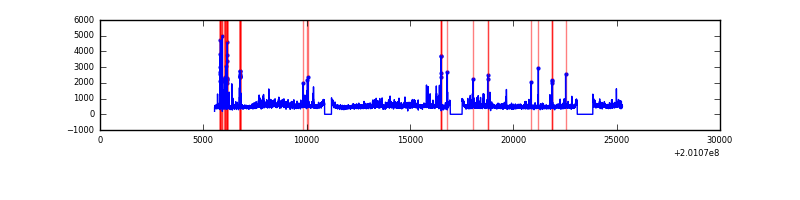 |
| C | 19734 | 18072 | 600 | 600 | 3.04% | 3.32% | 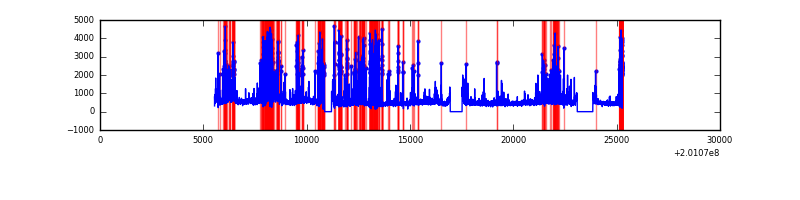 |
| D | 19734 | 18072 | 92 | 92 | 0.47% | 0.51% | 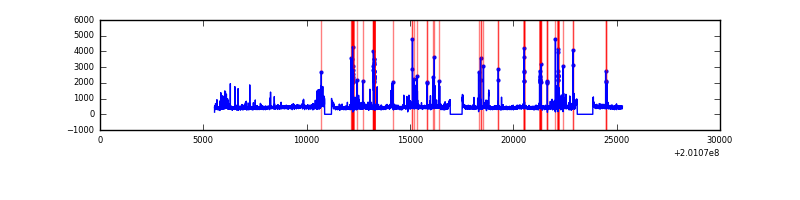 |
Top three noisy pixels from each quadrant. If the there are fewer than three noisy pixels in the level2.evt file, extra rows are filled as -1
| Pixel properties | Quadrant properties | ||||||
|---|---|---|---|---|---|---|---|
| Quadrant | DetID | PixID | Counts | Sigma | Mean | Median | Sigma |
| A | 0 | 118 | 262476 | 609.63 | 2083 | 2036 | 427.2 |
| A | 14 | 249 | 153479 | 354.49 | 2083 | 2036 | 427.2 |
| A | 0 | 50 | 56320 | 127.06 | 2083 | 2036 | 427.2 |
| B | 15 | 204 | 1095729 | 2672.4 | 2106 | 2053 | 409.2 |
| B | 2 | 249 | 369313 | 897.4 | 2106 | 2053 | 409.2 |
| B | 14 | 167 | 118562 | 284.69 | 2106 | 2053 | 409.2 |
| C | 7 | 220 | 2945863 | 6392.8 | 1975 | 1987 | 460.5 |
| C | 1 | 192 | 857082 | 1856.89 | 1975 | 1987 | 460.5 |
| C | 14 | 223 | 234454 | 504.82 | 1975 | 1987 | 460.5 |
| D | 13 | 223 | 211608 | 434.04 | 2008 | 1949 | 483.0 |
| D | 2 | 31 | 193955 | 397.5 | 2008 | 1949 | 483.0 |
| D | 9 | 85 | 140685 | 287.22 | 2008 | 1949 | 483.0 |
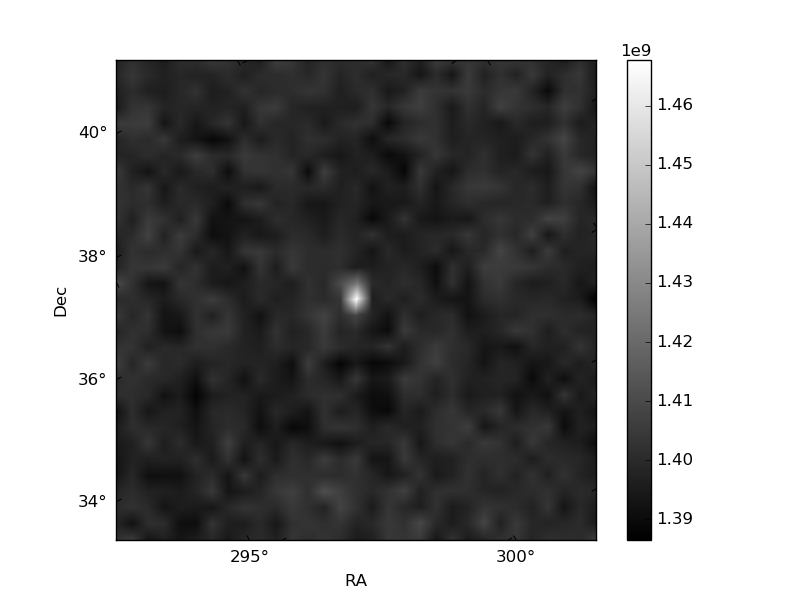
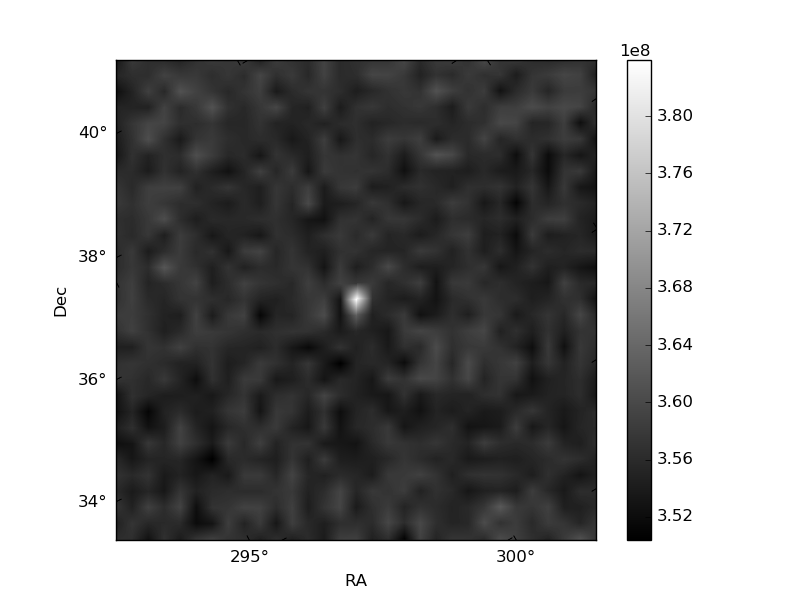
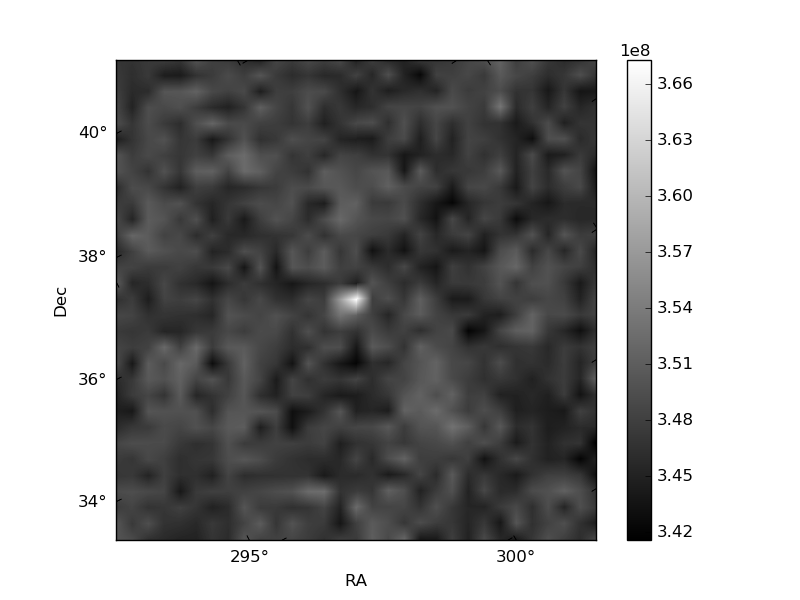
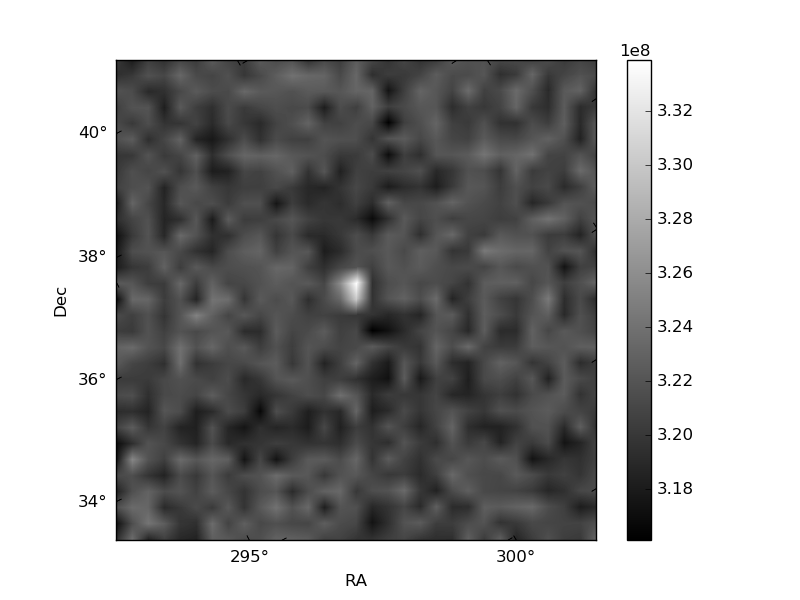
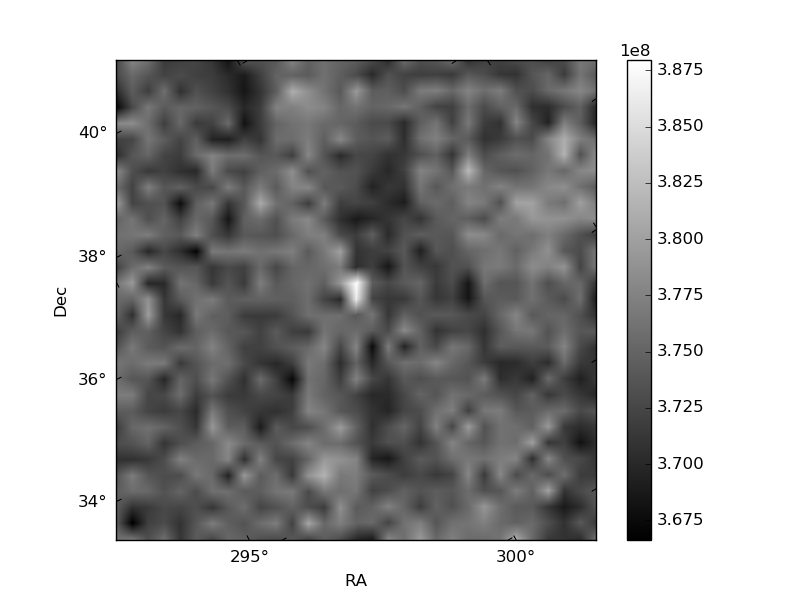
Histogram calculated using DETX and DETY for each event in the final _common_clean file
| Quadrant A | 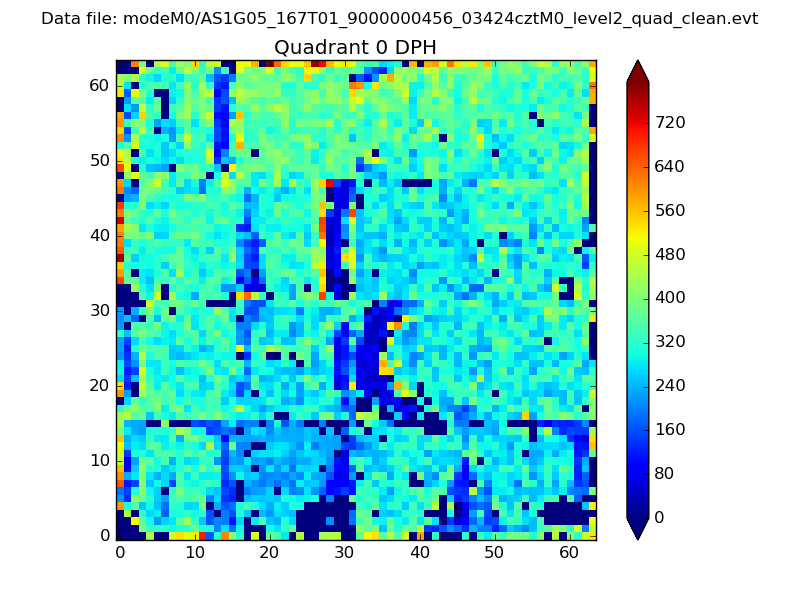 |
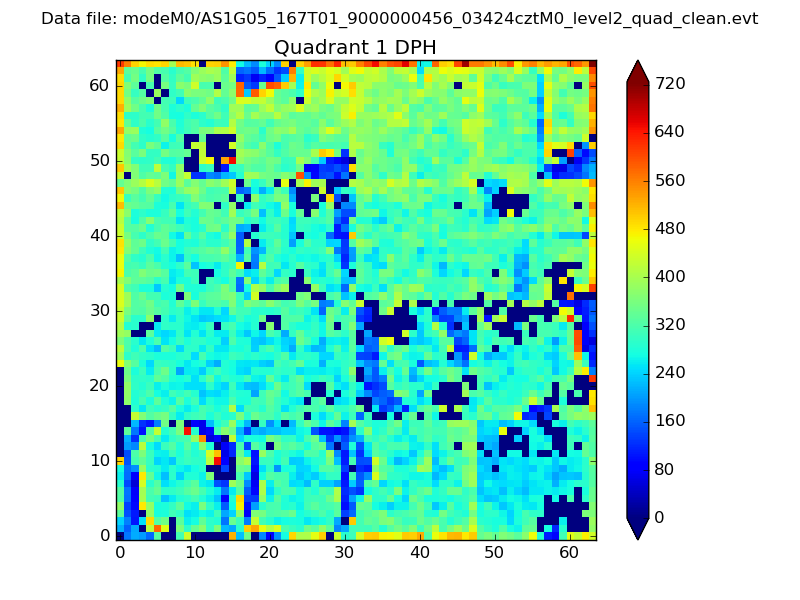 |
Quadrant B |
|---|---|---|---|
| Quadrant D | 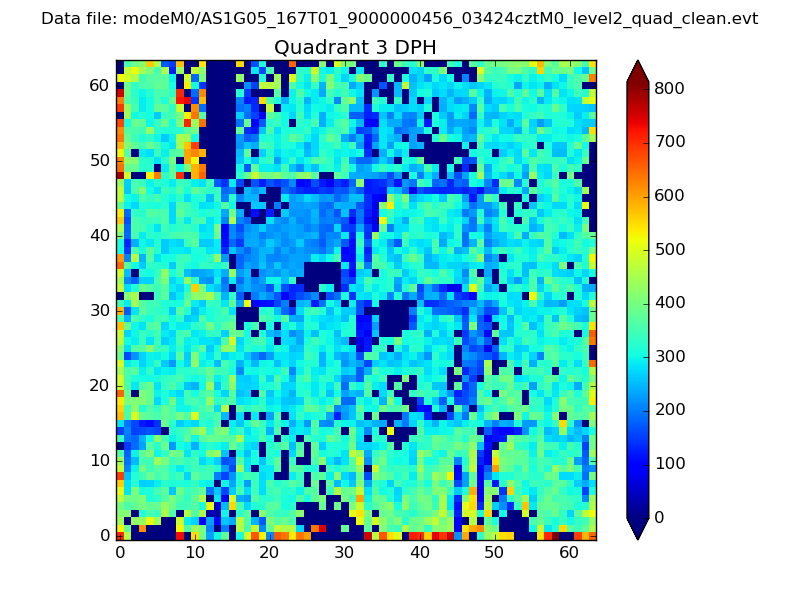 |
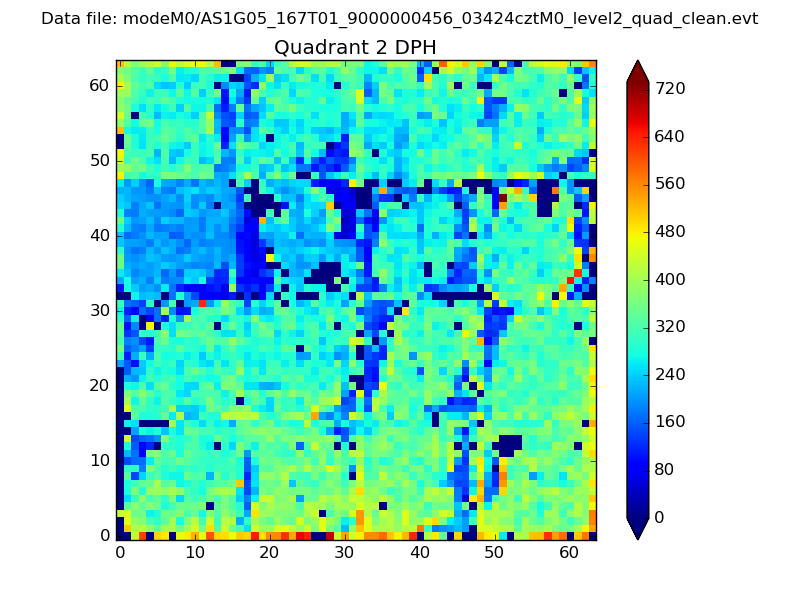 |
Quadrant C |
| Plot type | Count rate plots | Images |
|---|---|---|
| Comparison with Poisson distribution Blue bars denote a histogram of data divided into 1 sec bins. Red curve is a Poisson curve with rate = median count rate of data. |
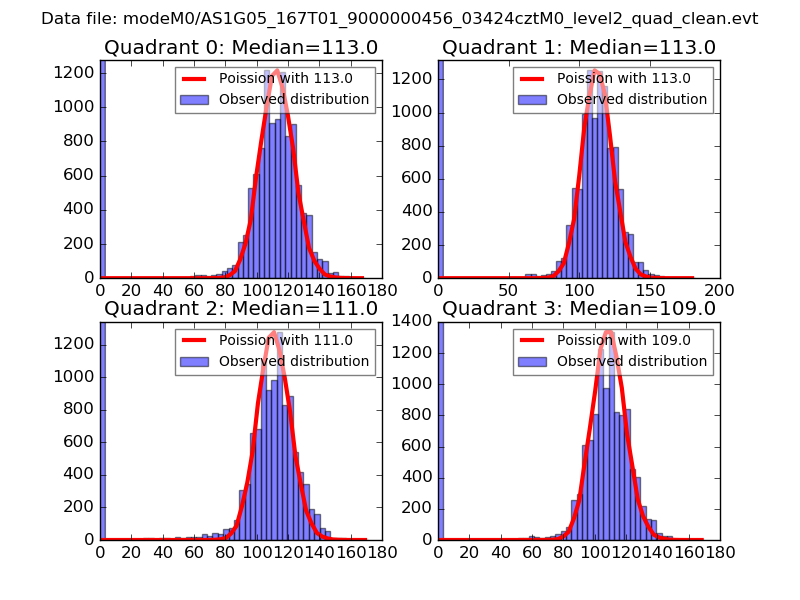 |
 |
| Quadrant-wise count rates Data is divided into 100 sec bins |
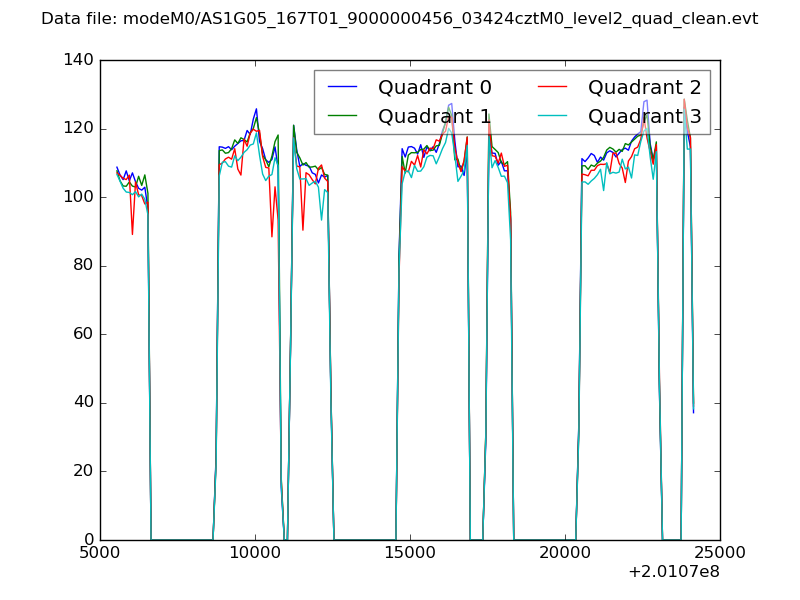 |
|
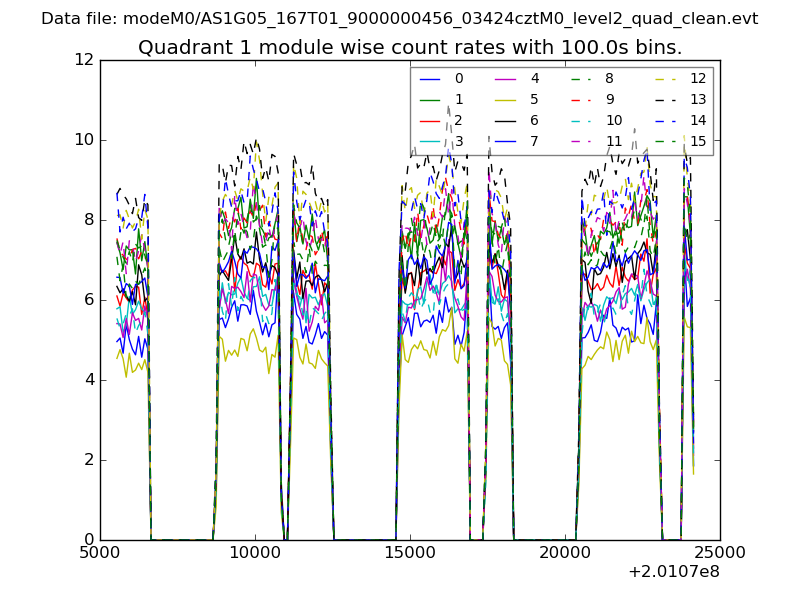
| Module-wise count rates for Quadrant A Data is divided into 100 sec bins |
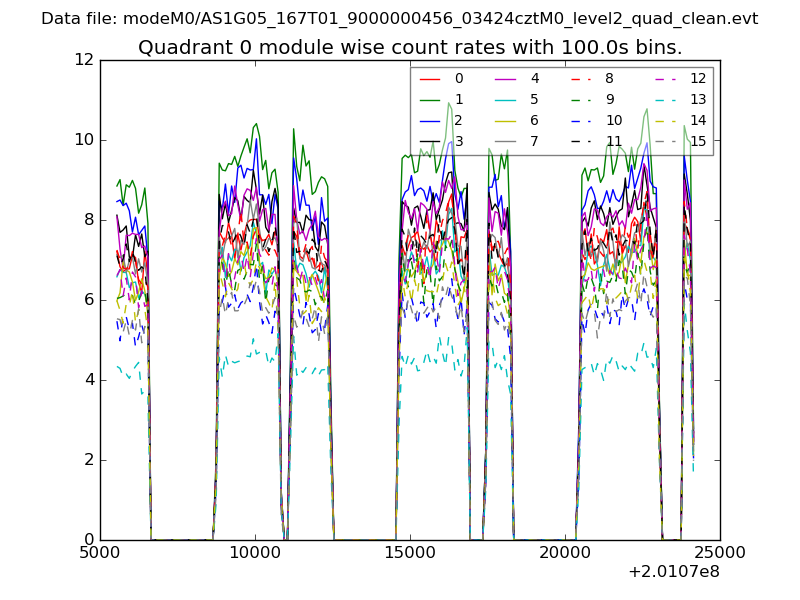 |
 |
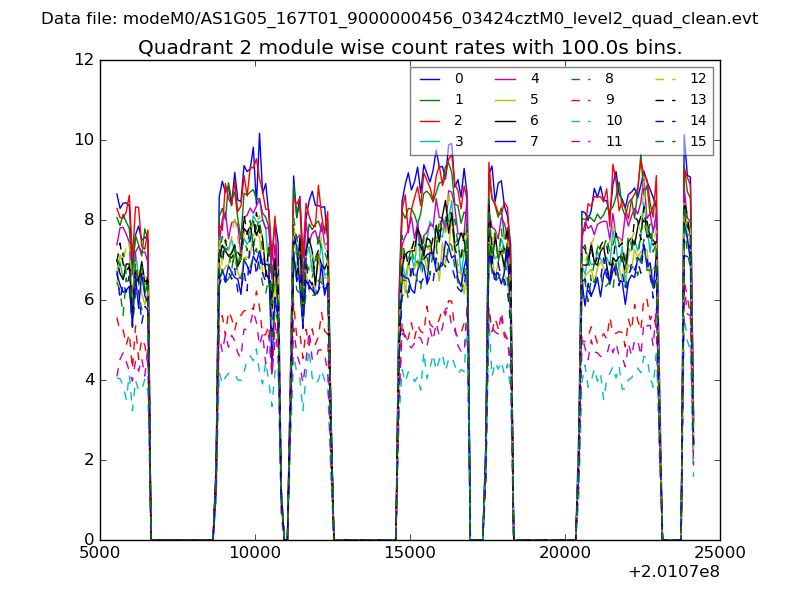
| Module-wise count rates for Quadrant B Data is divided into 100 sec bins |
 |
 |
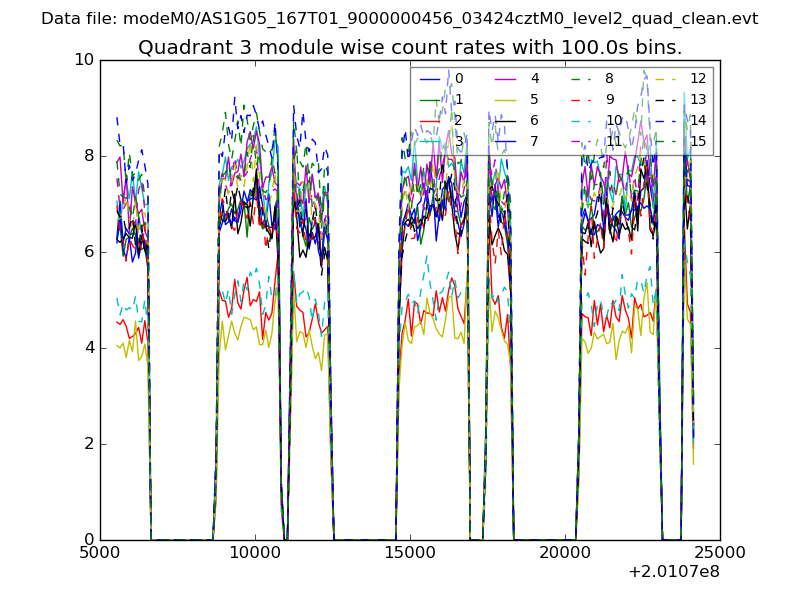
| Module-wise count rates for Quadrant C Data is divided into 100 sec bins |
 |
 |
| Module-wise count rates for Quadrant D Data is divided into 100 sec bins |
 |
 |
| Parameter | Plot |
|---|---|
| CZT HV Monitor | 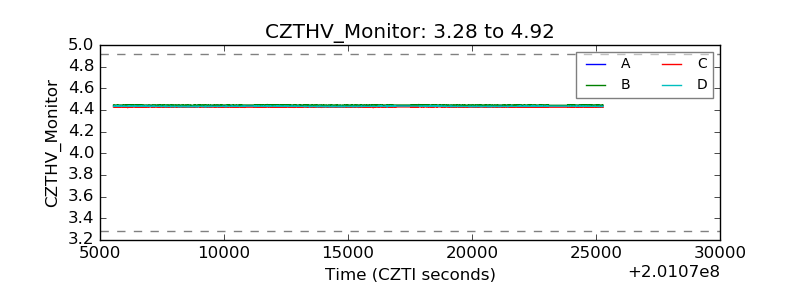 |
| D_VDD | 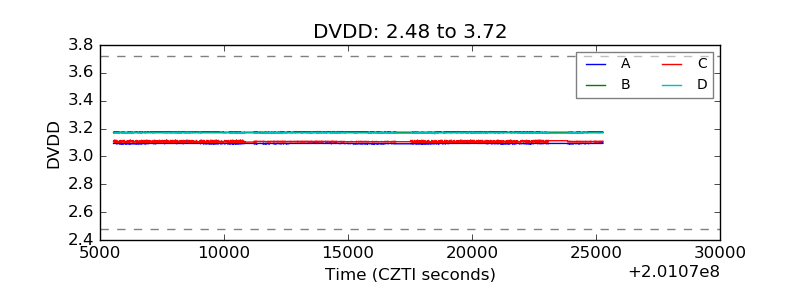 |
| Temperature 1 | 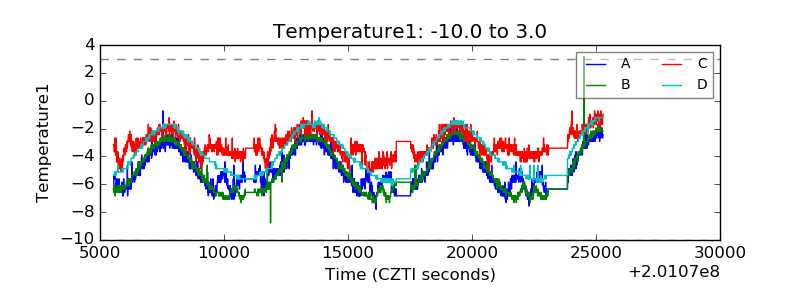 |
| Veto HV Monitor | 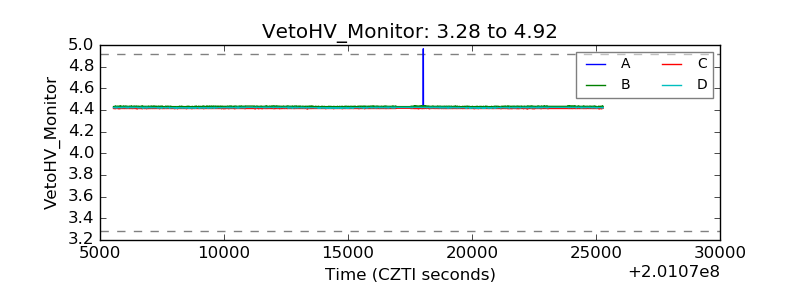 |
| Veto LLD | 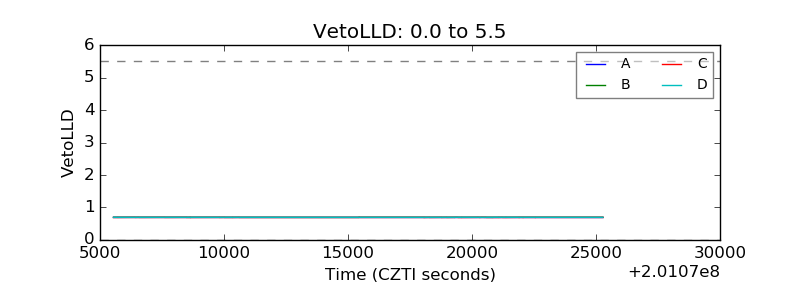 |
| Alpha Counter | 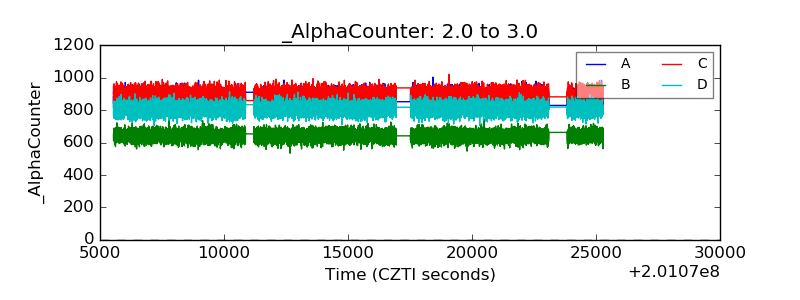 |
| _CPM_Rate | 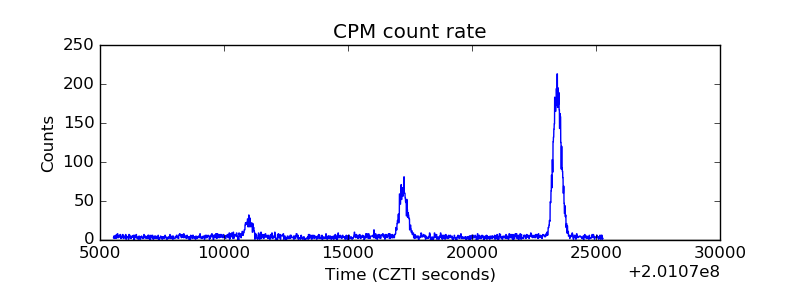 |
| CZT Counter | 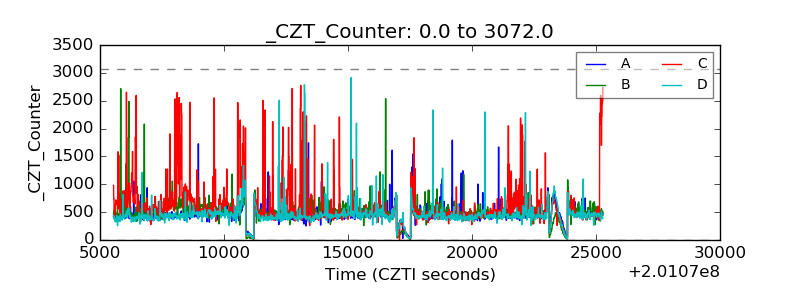 |
| +2.5 Volts monitor | 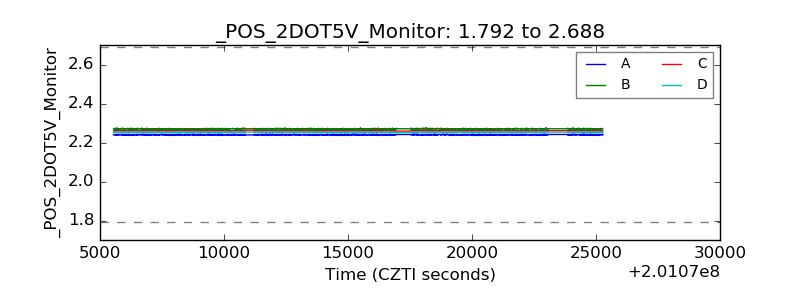 |
| +5 Volts monitor |  |
| _ROLL_ROT | 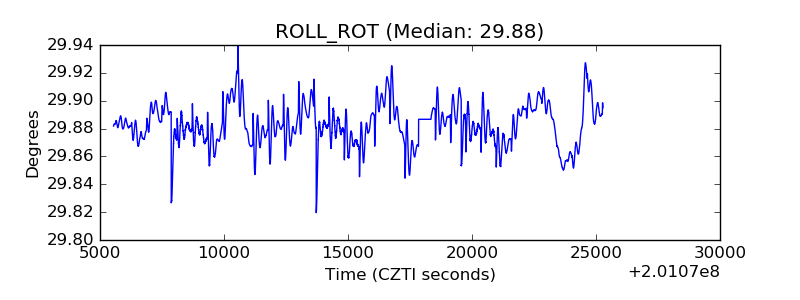 |
| _Roll_DEC | 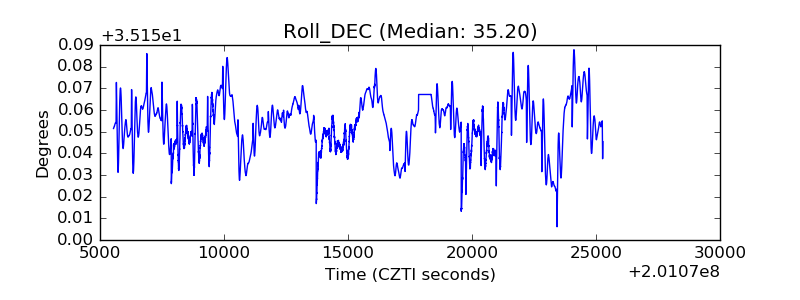 |
| _Roll_RA | 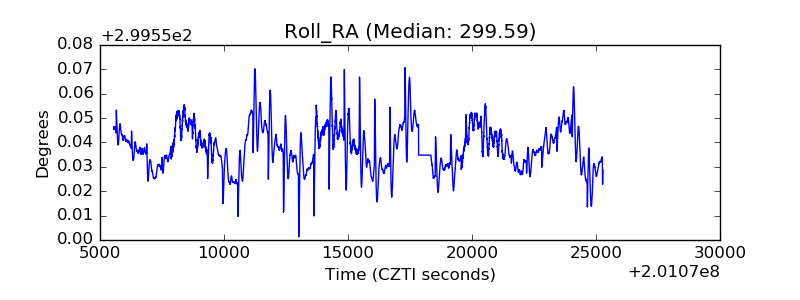 |
| Veto Counter | 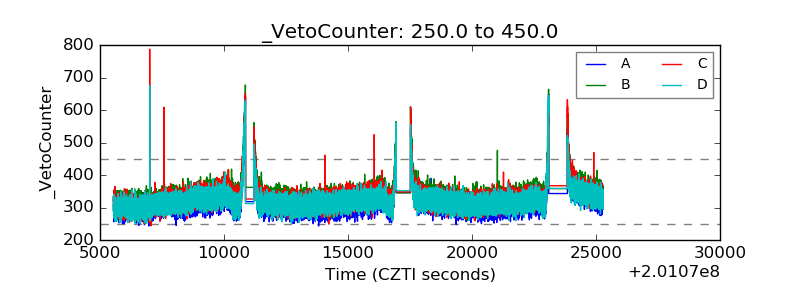 |